UNIVERSITA’ DEGLI STUDI DI CATANIA
DOTTORATO IN SCIENZE GEOLOGICHE
BIOLOGICHE E AMBIENTALI – XXXI Ciclo
Dipartimento di Scienze Biologiche, Geologiche e Ambientali
FRANCESCA TOSCANO
Environmental Accounting of Marine Protected Area
“IsoleCiclopi” by means of Emergy analysis
Ph.D thesis
Tutor: Prof.ssa Giuseppina Alongi
Co-tutor: Prof. Christian Mulder
Coordinatore: Prof.ssa Agata Di Stefano
ANNO ACCADEMICO 2018-2019
Alla memioria Emanuele Mòllica,
uomo di grande spessore umano, culturale e intellettivo,
che ha dedicato la sua vita alla conoscenza e tutela del mare.
A mio padre,
seguendo il suo esempio di onestà e dedizione al lavoro
ho trovato la motivazione per mettermi sempre in gioco
e raggiungere ogni giorno nuovi obiettivi.
A mia madre,
donna forte e paziente che, con amore discreto,
ha saputo sostenere, incoraggiare e seguire ogni mio passo.
Index
PREFACE ... 1
CHAPTER 1. INTRODUCTION ... 2
1.1 The basis of the research ... 2
1.2 Environmental accounting in MPA ... 4
1.3 PhD research proposal structure ... 10
CHAPTER 2. INTRODUCTION TO EMERGY ... 12
2.1 From qualitative to quantitative approach in environmental analysis ... 12
2.2 The arose of ecological economics ... 13
2.3 System ecology ... 15
2.4 A new approach in environmental evolution ... 16
2.5 Emergy, Transformity and Hierarchical organization of Systems ... 17
2.6 Geobiosphereemergy baseline (GEB) ... 20
2.7 Application of Emergy principles to ecosystems: a graphic model to evaluate energy flows ... 21
CHAPTER 3. EMERGY EVALUATION PROCEDURE ... 27
3.1 System diagram ... 28
3.2 Emergy evaluation table ... 30
3.3 Emergy signatures ... 32
3.4 Emergy indicators ... 32
3.5 Monetary and economic evaluation ... 34
3.6 Emergy algebra ... 35
CHAPTER 4. THE MARINE PROTECTED AREAS... 38
4.1 The Italian network of MPA... 41
4.1.1 Zonation ... 43
4.1.2 Procedure for the establishment of a MPA ... 44
4.1.3 Reserve commission ... 45
4.1.4 Regulation ... 45
4.1.5 Constraints ... 46
4.1.6 Future marine areas ... 46
4.2 The network of MPA in Sicily ... 47
CHAPTER 5. MARINE PROTECTED AREA “ISOLE CICLOPI” ... 49
5.1.1 Aci Castello ... 49
5.1.2 Aci Trezza ... 50
5.2 Marine Protected Area “Isole Ciclopi” ... 52
5.2.1 Origins... 52
5.2.2 Zonation ... 54
5.2.3 Regulations... 57
CHAPTER 6. EMERGY ACCOUNTING OF MPA “ISOLE CICLOPI” ... 60
6.1 Emergy analysis ... 62
6.1.1 Materials and methods... 62
6.1.2 Results and discussion ... 66
CHAPTER 7. BIOPHYSICAL ACCOUNTING ... 78
7.1 Trophodynamics perspective ... 78
7.1.1 Materials and methods... 78
7.1.2 Laboratory activities ... 84
7.1.3 Results and discussion ... 90
7.2 Natural capital assessment ... 93
7.2.1 Materials and methods... 94
7.2.2 Results and discussion ... 95
7.3 Environmental flows assessment ... 102
7.3.1 Materials and methods... 102
7.3.2 Results and discussion ... 103
CHAPTER 8. ECOSYSTEM SERVICES ... 107
8.1 Reference framework ... 108
8.2 Importance on mapping Ecosystem and role of Biodiversity ... 110
8.3 Mapping ecosystems ... 112
8.4 Classification of ecosystem services ... 117
8.4.1CICES framework ... 120
CHAPTER 9. ECOSYSTEMS SERVICE ASSESSMENT IN MARINE PROTECTED AREA “ISOLE CICLOPI” ... 126
9.1 Materials and methods... 126
9.2 Results and discussion ... 134
CHAPTER 10. CONCLUSIONS ... 150
APPENDIX ... 160
1 Preface
The purpose of this work is to illustrate the procedural and methodological approaches, with field-testing of materials and methods, necessary to carry out an environmental accounting studyEmergy-based in a marine protected area. The study was conducted in the marine protected area "IsoleCiclopi" following a multi-year pathway, in line with the document "Environmental accounting in
Italian Marine Protected Areas" (EAMPA), developed by several research groups
and coordinated by Federparchi (Italian federations of Parks and Nature Reserves).In particular, the aim of EMPA project is the assessment of the ecological and economic value forthe Italian marine reserves, elaborated in order to answer ministerial applications.Indeed, in 2014, the Italian Ministry of the Environment and Protection of Land and Sea financed the four-year project "Environmental accounting for Italian marine protected areas" aimed at implementing an environmental accounting system for the Italian marine protected areas (MPAs). The main purpose of this project is to detect and evaluate both biophysical and economic aspects of the reserves in order to assess the Natural Capital stocks and the Ecosystem Services generated by MPAs. The PhD research is based on a bibliographic analysis of international and national literature, oriented both in the study of the relationship between the economy and the environment, and in theevaluation of environmental policies with a focus on marine protected areas.From this, emerged the absence of a scientific methodology of evaluation, able to provide in a way immediate and complete summary information on the context of marine reserve about the economic sphere, social and environmental aspects.It is important to point out that, at the time of the bibliographic research activity (2015), research proposals for environmental accounting analysis in MPAs had not yet been published, there were only general guideline. These works have been published since 2017 and, where necessary, they have been integrated, in this PhD research, to the methodologies already adopted.The results of the research are intended to partially fill this gap by offering an innovative methodology and new points of reflection in the field of environmental evaluation and of policies while having some limitations set out inthe paper.
2
Introduction
Chapter 1
Introduction
1.1 The basis of the research
Since the United Nations World Conference on Environment and Development in Rio de Janeiro (1992), the need to integrate environmental, economic and social issues into the decision-making process and into the legislative, regulatory and planning framework, as well as into the market and national accounting systems has been highlighted. From it derives the Strategic Plan for Biodiversity 2011-2020, declared by the United Nations General Assembly in December 2010, with the forecast of 5 strategic objectives to face the safeguard of the loss of biodiversity and of the connected Ecosystem Services (ES). The 189 member countries are required to prepare a multi-year report on the state of biodiversity and the monitoring of the state of progress with respect to the targets. In the same year, Italy defined its National Biodiversity Strategy 2011-2020, which refers to the commitments made and shared at global and EU level. The strategy includes the development of a system of "Environmental Accounting" in protected areas that allows a collection and analysis of data integrated and coordinated between different parks, to detect not only the economic potential. The inclusion of environmental aspects in traditional economic accounts has the task of introducing corrective measures. In this perspective, for example, the loss of biodiversity, the consumption of natural capital and the restoration of impoverished resources can be considered and accounted for, in order to integrate the environmental dimension in the social and economic dimension of development policies. In 2014, the Italian Ministry of the Environment and Protection of Land and Sea financed the four-year project "Environmental accounting for Italian marine protected areas" aimed at implementing an environmental accounting system for the Italian marine protected areas (MPAs). The main objective of this system was the calculation of the ecological and economic value of the Marine Protected Areas with reference to the Natural Capital stocks and the Ecosystem Services generated in each protection area. In addition, the environmental and economic costs, arising from the anthropic impact, must be assessed and a net balance of
3
Introduction
benefits calculated.In the last years, the use of environmental accounting for the assessment and monitoring of ecosystems has seen an ever-increasing interest at international and national level. This is due to the need to improve environmental policies towards the protection of natural resources that provide goods and services for the well-being of society.In 2016, since increasing interest on ecosystem assessment and sustainable development and on the basis of “Collegato
green” ("Environmental provisions to promote green economy measures and
contain excessive use of natural resources", linked to the 2014 Stability Law, approved by the Chamber and amended by the Senate), in Italy was established the “Committee on Natural Capital”. Its task was to prepare and send an annual report on the state of the country's Natural Capital to the President of the Council and the Minister for the Economy and Finance, in order to ensure the achievement of social, economic and environmental objectives consistent with the annual financial and budgetary planning. The report must be accompanied by environmental information and data expressed in physical and monetary units, as well as ex ante and ex post evaluations of the effects of public policies on natural capital and ecosystem services.The year 2017 marked an important turning point in the complex question of sustainability in Italy. Within the framework “Agenda 2030 ONU” on Sustainable Development and the National Strategy for Sustainable Development (SNSvS), the above Committee on Natural Capital has presented the First Report on the State of Natural Capital in Italy. It allowed highlighting, for the first time, the most important features and value of Natural Capital of the country, from the complex institutional system to the fundamental role played by with respect to the collective socio-economic system of Italy. This value is expressed in benefits that we enjoy every day and that come from the set of ecosystem services that nature provides us, but that often we do not perceive and do not evaluate at their proper value. The objective that the Committee for Natural Capital pursues is also to make visible to citizens and policy makers the value of these benefits. In 2018, with the Second Report, important progress has been made in terms of enriching the factors of analysis thanks to an ever-increasing synergy between experts in the field, national and international research centers, and the public administration. This Report further improves the
4
Introduction
biophysical evaluation of terrestrial ecosystems at eco-regional and regional level,updates the state of conservation of some of them. Moreover, the focus on the biophysical value of Natural Capital stocks in marine ecosystems highlights the first results of the experimental above mentioned projectof environmental accounting system for Italian Marine Protected Areasstarted in 2014. Finally, the Committee on Natural Capital proposes new recommendations, that will serve as an agenda for future reports, which are intended to make a significant contribution to achieving the global objectives set out in Agenda 2030 for sustainable growth, which Italy must continue to pursue for present and future generations.In this framework, this doctoral project is configured as a methodological research with field-testing of materials and methods useful to conduct a comprehensive accounting survey in line with ministerial guidelines.
1.2 Environmental accounting in Italian Marine Protected Area
Coastal and marine ecosystems are among the most productive environments in the world and their Natural Capital stocks provide a set of Ecosystem Services essential to human life (Costanza et al., 1997). Marine protected areas were created with the aim of achieving conservation of marine habitats and key role species. Moreover, the protection measures adopted, would led to a sustainable use of marine resources.The term Natural Capital identify the stock of a system capable of providing the natural resources at the base of production of goods and services, from which all human activities originate. It is necessary to measure the amount of natural resources but also to understand which uses affect them leading to high environmental costs. Usually, no market value was assigned to natural capital by classical environmental analysis. Its value is attributed by the economyonly to the final benefit (the only thing perceived by humans), while the effort of nature in the productive process is neglected.Environmental accounting represents a model of analysis that assess natural capital, based on the investment made by nature, in terms of resources committed. In this way, it is possible to evaluate the real effort of nature in maintaining a certain good or service. Ecosystem services are the components of the natural capital which man exploits
5
Introduction
directly and that allow him to get a benefit. They can only be supported by the presence of that basic environmental heritage mentioned above.To understand the functioning of a natural system it is essentialto know not only the value of this capital, but also evaluate the processes, the functions and the knowledge of the most exploited services.This is because the possibility to preserve and increase environmental heritage depends on the type and from the degree of exploitation. An accurate evaluation of the services can correctly address administrators and operators, highlighting the main administration opportunities for managers. Therefore, the purpose environmental accounting is to quantify both the physical and monetary value of natural systems and to monitor their variations in order to maintain it at least intact.Environmental accounting in marine protected areas is an experimental project, started in 2014 and aimed at implementing an environmental accounting system for Italian MPAs. Among the different methodologies for assessing resources in quantitative terms, emergy accounting (Odum, 1996) has been selected.The application of this methodology allowsto express all the resources necessary to maintain a system in a single ecological unit of measurement and then to translate the total amount into monetary units. In this way, the value of one or more ecosystems is calculated as resources that have been (or are) necessary to store the biomass contained in it and maintain its functioning and goods and services are evaluated according to the work done by the biosphere for their production. The methodology has to be applied to the benthic habitats of MPAs, thus arriving at an estimate of the capital and the flows of resources that maintain it, as well as an assessment of the ability of the MPAs to generate these resources and be, therefore, more or less independent from external systems.It isalso necessary to transport the general definitions to a local context, considering the supply and demand that territory can offer, contextualizing them toimprove and implement “ad hoc” policies of management. The importance of this project lies in achieving methods and tools useful to assess environmental features in order to estimate and monitor the natural heritage in a reserve. This survey also aims to return a complete profile of the system investigated, including social and economic characteristics, to highlight interaction between humans and nature for management purpose. The
6
Introduction
methodological approach of environmental accounting in MPAs can be divided into several operational phases and requires the collection and analysis of data for each MPA, including bathymetric and bionomic mapping, the characterization and extension of the macro-ecosystems present and the quantitative evaluation of the biomass of macro-benthonic organisms and sedentary fish fauna.
The different phases of the analysis (from the document “Environmental Accounting in Marine Protected Area” Federparchi, 2014) are described as follows:
Phase 0. Photograph of data availability relating to the naturalistic accounting of the MPAs.
1. Inventory of the data necessary for the realizationof the model and already available to the MPAs, and evaluation of the comparability between different samplings and/or different sites.
2. In case of missing data, formulation of a shared and standardized protocols for the collection of information functional to the implementation of the model and comparable between different sites.Creation of a database connected to SIT (System Territorial information) containing biomass associated with each taxon. Phase 1. Accounting of the ecological and economic value of the Natural Capital of the MPAs.
1. Identification of benthic communities in the area (e.g. through the consultation of cartography) and the associated fauna (e.g. by means of consultation of data from visual census campaigns).
2. Attribution of an ecological and economic value through the modelling of each biocenosis and the application of the systemic methods (Emergy Analysis) (For a more detailed description see Chapter 3).
Phase 2. Identification of the main functions and Ecosystem Services.
Once assessed the ecological value of the environmental heritage,it will be necessary toidentify the functions and ecosystem services. Their identification is essential in order to find the relationships between ecosystem and anthropic
7
Introduction
system and to quantify their resource flows. To do this, it will be consulted and carefully analyzed the entire bibliography of reference, paying particular attention to the marine environment (e.g. Liquete et al., 2013; De Groot et al., 2002; MA, 2005; Ronnback et al,2007). The mapping of ecosystem services will be conduct also according to the guidelines indicated by the MAES working group (Mapping and Assessment on Ecosystems and their Services) to support the implementation of the Action 5 of the European Biodiversity Strategy (European Union, 2013, 2014). Functions and services will also be identified based on in-depth knowledge of the ecosystems analyzed through the phases or by identifying all the previous characters from an ecological point of view. This is to achieve a classification of functions and services specifically designed for each MPA.
Phase 3. Accounting of the environmental and economic costs. Ecocentric approach
1. Identification of uses and their impacts exercised in the area or of the activities carried out from users e.g. seaside tourism and walking, boating, sport and professional fishing, diving.
2. Assessment of direct environmental costs in terms of use of natural and anthropic resources and environmental degradation, whose repercussions are recorded within the MPA.
3. Evaluation of indirect environmental costs (in terms of resource use and degradation of natural environment), the effects of which are recordered outside the MPA.
Anthropocentric approach
1. Environmental costs contribute to the formation of the environmental flow statement.Therefore, they will be traced back to some main types, such as, for example: the anthropogenic presence, consumption of resources,fuel consumption for the determination of emissions, electricity and raw material consumption. 2. Monetization takes place through steps that result in the transformation of consumption into tones of CO2 equivalents and their subsequent conversion into
8
Introduction
in monetary units, through the adoption of economic and monetary conversion factor that attributes a social cost to each unit emissions (social cost of carbon). 3. Economic costs: accounting data, financial statements of the marine protected area.
Phase 4. Accounting of the environmental and economic benefits. Ecocentric approach
From an ecocentric point of view, the benefits of a MPA originate from the maintenance of the ecological heritage and the functions it performs. The natural system, in fact, constantly provides services that derive from the environment, and that are generated regardless of the utility, the direct benefit or advantage of humans.
Anthropocentric approach
The evaluation of ecosystem services, as well as what happened with the mapping, will be conduct in accordance with the guidelines laid down by the working group of the MAES (Mapping and Assessment on Ecosystems and their Services) to support the implementation of the Action 5.
1. Environmental and economic benefits: The monetary value of ecosystem services is quantified at this stage:
a. Identification of biophysical indicators and socio-economic factors appropriate for measuringecosystem services.
b. Monetization of indicators calculated in the previous phase. Definition of ecosystem services is preparatory to the formulation of the correct indicators. 2. The environmental benefits, as well as the costs of environmental and economic factors, contribute to the formation of the flow statement.
3. Profits: accounting data, financial statements of the area
Phase 5.Environmental flows and implementation of the cost-benefit balance. The flow statement is acost-benefit analysis based (Fig. 1) which add-ons the economic account (costs and profits) of the managing organization with the accounting of environmental resources (benefits and environmental, social and economic costs) of the area.
9
Introduction
Figure 1. Cost-benefit analysis approach in environmental accounting.
Regarding resources accounting, the environmental costs and benefits can be compared to understandthe effectiveness of management policies for the maintenance and growth of the ecological heritage.
The sum of costs and benefits makes it possible to carry out a budget of the MPA, i.e. thewealth produced or consumed. The relationship betweennet benefits produced by the area and thepublic finance makes it possible to estimate thereturn on investment made by the institution public in the marine area (Marangon et al., 2008). Cost and benefit assessments are used in the construction of the balance sheet of flows according to the evaluation described in phases 3 and 4.The results of the eco-centric andanthropocentric procedures conducted in all phasesof the project will be comparedto get more information about the complete and detailed information on the value of the MPA and the perception of this value byusers. The two approaches will also allowto better understand the consequences of management actions within the MPAs about conservation or promotion activities.
Phase 6.Computerization data management and development of the accounting system.
The collected data can be managed byusing information systems, already available for the different MPAs or “ad hoc” developed. The use of structures,
10
Introduction
interoperable and potentiallyexpandable, will allow a simpler and morerational dynamic management of accountingenvironmental procedure, in order to make itfunctional toadministrationpurpose. Moreover, an easier data and information collection and exchangebetween operators, institutions and users of different MPAs should improve the communication web. In addition,the new information systems will allow to fit in with the recent networks ofEuropean and international environmental information systems,and collecting, managing,making the data according to the new international standards (INSPIRE, OGC, etc.).
1.3 PhD research proposal structure
A summary of the activities carried out during the doctorate, in order to facilitate understanding of the research work, is presented below.
At first, the definition of the theoretical framework of the research has been conducted. The focus was oriented both in the study of the relationship between the economy and the environment, and in the evaluation of environmental policies with attention on marine protected areas. In this phase, the evolution of the historical and cultural background, underlying the study of ecosystems, has been reconstructed,paying particular attention to the paradigm shift between the conception of the neoclassical economic system model and the environment model. In addition, the rise of System Ecology and its application in the study of ecosystems wastaken into account, in order to have a more conscious approach to Emergy. Based on these concepts, the second part of the PhD research has developedand adapted to the setting the environmental accounting model emergy-based in accordance with the guidelines of the Ministry. At the same time, field-surveys were conducted to get an overview of the main features present in the study area from ecological to socio-economic point of view. The knowledge of the whole system is fundamental to achieve conservation objectives with a view to sustainable development. The last phase of the thesis concerns the application of the model of evaluation elaborated in the study area and the discussion of results gained from the data analysis, also defining strengths and weaknesses of the accounting system proposed. Finally, the last objectivewasto point out the knowledge of marine reserve performance as essential instrument for management
11
Introduction
purpose: a more accurate awareness of the issues involved would allow the public decision-makers to develop conservation and protection strategies as consistent as possible with the realities in these areas.
12
Introduction to Emergy
Chapter 2
Introduction to Emergy
2.1 From qualitative to quantitative approach in environmental analysis
Environment can provide support for men and the society. Support means to have all natural resources useful for men‟s health, culture and economy. Consequently, our well-being is strictly linked to the relationship with environment and its components. The great economic development is leading to a decreasing of natural capital (defined as the world‟s stocks of natural assets which include geology, soil, air, water and all living things) with a consequent loss of raw material, loss of biodiversity and loss of other stored-energy sources.Really, it is from this natural capital that humans derive a wide range of services, often called ecosystem services, which make human life possible. There is a conflict between what is important for the actual/further economic development and the will to protect environment. In the past,industrialized society based the growth model on the maximum economic profit using natural resources over the natural renewal rate. Fromthis perceptionsustainable development became more and more important.There are many definition of sustainable development, probably the best one is the one given by World Commission on Environment and Development: development that meets the needs of the present without
compromising the ability of future generations to meet their own needs. The aim
of sustainable development is to maintain a stable relationship between human activities and the natural world, guiding economic growth together with the protection of environmental quality: humanity must take no more from nature than nature can replenish.Nowadays, renewable resources are used by humans at a rate that, in most cases, is higher than their replacement rate. It implies that the renewable resources are decreasing. In addition,non-renewable resources are used by humans at a rate that is higher than the rate at which alternatives to the non-renewable resources are found. The decreasingnon-renewable and non-non-renewable resources demonstrate that the earth is not in a sustainable development (Jørgensen 2012). Two different systems have to be investigated to study
sustainable development from a scientific point of view, the economical-productive system and the ecological one.The use of the most common
13
Introduction to Emergy
environmental analysis methods, that take into account a qualitative approach, can generate a wrong estimation of natural capital because without a market price it could result underestimated. On the contrary, environmental problems require a quantitative approach that is able to consider both ecological and economical values.
2.2 The arose of ecological economics
Ecology and economics have been pursued as separate disciplines through most of the 20th century.By the end of the 19th century, the trend to increasing specialization and professionalization in science was well under way, and economics as a profession became more and more popular (Coats 1993). What has come to be called the “reductionist” paradigm was beginning to hold sway. This paradigm assumes that the world is separable into relatively isolated units that can be studied and understood on their own, and then reassembled to give a picture of the whole. As the complexity of science increased, this was a very useful idea, since it allowed dividing the problem into smaller, more manageable pieces that could be attacked intensively.This rapidly led to a reduction in communication across disciplines and a tendency for the disciplines to develop their peculiar unique languages, cultures, and ways of looking at the world. In economics, this led to a growing isolation from the natural resource (or land) component of the classical triad of land. Ecology itself there was something a split between the population ecologists (e.g., Robert MacArthur) who concentrated on individual populations of organisms, and ecologists(e.g., E. P. and H. T. Odum) who focused on whole ecosystems. Through all of this, ecologistshave maintained communication across most of the natural sciences (Costanza et al. 1997).In 1971 two authors,Howard T. Odum‟s (ecologist) and Nicholas Georgescu-Roegen‟s (economist) published two books that seem to have made a major contribution to setting the stage for ecological economics.The books,“Environment, Power, and Society” and “The Entropy Law and the Economic Process”,were very different in style but both of them were about energy, entropy, power, systems and society.Georgescu-Roegen argued that all economic processes entail the use of energy and that the second law of thermodynamics, the entropy law, clearly
14
Introduction to Emergy
indicates that the available energy in a closed system can only decline. Like others before him, he also noted the parallel between the degradation of the availability of energy and the degradation of the order of materials. Biodiversity degradation can also be thought of as a parallel problem. New technologies do not “create” new resources; they simply allow us to degrade energy, material order, and biological richness more rapidly (Costanza et al. 1997).Howard T. Odum has been concerned with material cycles and energy flow in ecosystemsand he produced one of the first energy flow descriptions of a complete ecosystem in his famous study of Silver Springs, Florida (H.T. Odum 1957). He also contributed heavily to his brother Eugene P. Odum‟s influential textbook, Fundamentals of Ecology, first published in 1953 (E. P. Odum 1953). Lotkainfluenced H. T. Odum in his thinking, and he was concerned with many of the same problems as Georgescu-Roegen. His approach went beyond economics and thermodynamics to include systems in general, from simple physical and chemical systems to biological and ecological systems to economic and social systems. The work of E. P Odum and H. T. Odumhas inspired a whole generation of ecologists to study ecology as a systemscience and to link it with economics and other disciplines.In 1980 a group of scholars realized that improvements in environmental policy and management and protecting the well-being of future generations were dependent both on ecological and economic issues. It was immediately clear that these subjects had to be considered as one and evaluated together. This was the birth of Ecological economics. Numerousexperiments with joint meetings between economists and ecologistswere held, particularly in Sweden and the United States, to explorethe possibilities of working together (Jansson 1984; Costanzaand Daly 1987). Economists and ecologists joined to encourage the major international agencies to develop accounting systems that included the environment (Ahmad et al. 1989). Buoyed by such initialefforts, the International Society for Ecological Economics (ISEE) was formed during a workshop of ecologists and economists held in Barcelona in late 1987, and the journal, Ecological Economics, was initiated in 1989. Ecological economics is not a single new paradigm based in shared assumptions and theory. It represents a commitment among economists, ecologists, and others, both as academics and as practitioners, to learn from each
15
Introduction to Emergy
other, to explore new patterns of thinking together, and to facilitate the derivation and implementation of new economic and environmental policies (Costanza et al. 1997).
2.3 Systems ecology
Another important contribution to the new approach to environmental analysis is the systemsecology, a branch of ecosystem ecology. System ecology aims to clarify the structure and the function of ecosystems using applied mathematics, mathematical simulation models and computer programs. It can be also defined as the application of system theory to the study of ecology because it studies the interaction between biotic and abiotic components through system modelling. As a system science, it is based upon the principle called synthesis, which is focused primarily on the interaction between system componentsand the patterns that emerge out from interactions instead ofthe properties of the components themselves. It arose in 1960, after computers became available and system analysis were successfully applied in military and industrial settings. The origin of the term “systems ecology” and the breadth of this new field are found in E. P. Odum‟s “The New Ecology” (Odum, 1964). Odum sees computers and the mathematical systemapproach as powerful means to advance theory of ecosystem self-organization and establish principles of ecosystem management (Dale, 1970). Systems ecology is applied widely in environmental management and in particular in the ecological subdisciplines: ecological modelling, ecological engineering and assessment of ecosystem health or integrity by ecological indicators (Jørgensen, 2012). To the point, System Ecology is able to explain changes in ecosystems through changes in energy and material flows. This working definition of Systems ecology let us introduce the concept of Emergy accounting. Indeed, Emergy accounting is able to evaluate energy and material flows of different qualities to overcome diversity of metric used for quantifying processes and activities (Tilley and Swank, 2003).
16
Introduction to Emergy
2.4 A new approach in environmental evaluation
The development of emergy and its theoretical base cannot be separated from development of the concept of energy quality (Brown and Ulgiati, 2004). Since 1970, the concept of energy quality was evolving: from a qualitative description of the different forms to quantitative methods of expressing the different energies for comparative purpose. It was clear that all forms of energy have different ability to do work and some corrections were necessary to compare and evaluate them correctly. For example, a Joule of sunlight is not the same as a Joule of fossil fuel or a Joule of food, unless it is being used to power a steam engine (Brown and Ulgiati, 2004).Energy has been defined as the ability to do work and it is measured in units of heat or molecular motion that are quantified in calories or Joules.The use of heat measures of energy that can only recognize one aspect of energy, its ability to raise the temperature of things, cannot adequately quantify the work potential of energies used in more complex processes of the biosphere (Brown and Ulgiati, 1999). In biosphere system, energies should be converted to units able to take into account for multiple levels of system processes, ranging from the smallest scale to the largest scales of the system, and useful to evaluate processes different from that of heat engine technology.Odum was reflecting on these differences when he understood the errors of energy technologies that promised unlimited energy from society from sun or from oil shale. In both cases, the costs associated to the concentration of energy were greater than the net yield.H. T. Odum began to investigate the quantification of energy quality, the net yield of energy sources to understand how the biosphere worked through the different levels.In fact, Ecosystems circulate materials, transform energy, support populations, join components in network interactions, organize hierarchies and spatial centers, evolve and replicate information, and maintain structure in pulsing oscillations (Ulgiati and Brown, 2009). Odum introduced the concept of emergy in order to account for the quality of incoming energy andresources, i.e. for the environmental services supporting a process as well as for their convergence through a chain of energy and matter transformations in both space and time.
17
Introduction to Emergy
2.5 Emergy, Transformity and Hierarchical organization of Systems
In 1996 Odum published the book “Environmental Accounting”, which explicitly laid out the accounting rules for EMERGY analysis, and in the introduction he started…”A science-based evaluation system is now available to represent both
the environmental values and the economics value with a common measure. EMERGY spelled with an “m”, measures both the work of nature and that of humans in generating products and services. By selecting choices that maximize EMERGY production and use, policies and judgements can favour those environmental alternatives that maximize real wealth, the whole economy, the public benefit” (Odum, 1996).
All environmental processes, systems and societies present interconnections characterized by a complex net of interchange involving energy, materials and information. The possibility to understand the relationships between energy flows and matter transformation may be fundamental to identify and to describe the complex inter-relationships between society and biosphere. In fact, the maintenance of society is due to the use of energy (in term of energy fluxes and storage) produced by the biosphere. Human society draws energy directly from the environment, from short-term storage (form 10-1000 year turnover times) like wood, soils, and ground water, and from long-term storages of fossil fuels and minerals (Brown and Ulgiati, 1999). Neoclassical economic theory does not attempt to quantify the value of all the environmental goods (biomass, food, etc.) and service (evapotranspiration, waste assimilation, etc.) of ecosystems that represent the benefits that humans derive from ecosystem functions (Berrios et al., 2017). Therefore, natural goods and service without commercial importance often end up being ignored in public and private decisions, compromising the sustainability of ecosystems from a global point of view (Odum and Odum, 2000). Emergy accounting (Odum, 1996) is a technique of quantitative analysis that offers theoretical and applicative basis to make a biophysical accounting of natural and anthropic ecosystems. This procedure returns the value of environmental resources as a function of the work of the biosphere to produce them (donor-side approach); it provides an evaluation of environmental value of a resource and the real welfare of a system.
18
Introduction to Emergy
Emergy is a system concept, and cannot be fully understood or utilized outside of systems (Brown et al., 2000). Emergy is context driven and has been described as the memory of energy used in the past to make something (Scienceman, 1987). In other words, can be considered the energy required doingthe work of productionand represents an expression of all the energy used in a process. By definition Emergy is the amount of energy of one form (usually solar) that is required, directly or indirectly, to provide a given flow or storage of energy or matter. The unit of emergy is the Emergy Joule or emjoule.When we take into account the biosphere, the energy used as common unit is usually sunlight. Solar Emergy is the available solar energy used up directly and indirectly to make a service or product (Odum, 1996). The unit of Solar Emergy is Solar Emergy Joule or emjoule (abbreviated sej).Being able to convert all form of energy into equivalents of one form, let us exceed one of the most relevant problem inthe study of energy fluxes: different energy sources are not comparable because they are not equivalent in their ability to do work.Emergy then, is a measure of the global processes required to produce something expressed in units of the same energy form (Brown et al., 2000).To derive the Solar Emergy of something, it is necessary to calculate the energy of each kind required to produce it; then resources and energy have to be express in the amount of Solar Emergy that went into their production. The ratio between the Emergy of a product and its energy returns a transformation coefficient called TRANSFORMITY. By definition Solar Transformity is the solar Emergy required to make one joule of a service or product. Its units are solar emjoul per joule (sej/j) (Odum, 1996). The coefficient is useful to transform a given energy into Emergy, by multiplying the energy by the transformity. Sometime, the unit related to particular products must be more specific and easier to quantify and so it can be expressed in:
Sej/g (Emergy per unit mass);
Sej/€ (Emergy per unit money), defined as the Emergy supporting the generation of one unit of economic product;
Sej/yr or sej/hr (Emergy per unit labor), defined as the amount of Emergy supporting one unit of labor directly supplied to a process).
19
Introduction to Emergy
The more energy transformation there are contributing to a product, the higher is the transformity because at each transformation, available energy is used up to produce a smaller amount of energy of another form (Odum, 1996). Therefore, when the production of goods have required the most work to make, they have low energy and the value of the transformity is elevated.
As a result, transformity value play an important rule into the evaluation of the efficiency of a process: the lower is the value of transformity, the higher is the ability to make a rational and effective use of the resources.Another size used is Empower, defined as the flow of Emergy per unit time,it measure isemjoule per unit time. Evaluating Emergy of a system means identify all sources of energy involved in the productive processes of the system considered and follow their transformations. ,(Brown et al., 2000). A series of successive energy transformations can generate an energy hierarchy.The structure of the system is hierarchal organized as a web (Fig. 2) in which energies are concentrated, through a series of energy transformations, in the final product. Transformation web can be aggregated in into transformation chains (Fig. 2), where energy flows decrease with each transformation step and transformity increases (Brown et al., 2000).The final product has less energy but a higher quality than the initial one.
Figure 2. Systems hierarchical organization and transformation chains (From Brown et al. 2000)
20
Introduction to Emergy
In other words, the diagram of the process of figure above shows an energy transformation hierarchy starting with large flow of low-quality energy that are transformed into smaller volumes of higher quality energies.The use of a system approach in environmental analysis, let us better understand the principles that govern natural and human systems and to predict their performances under different conditions.
2.6 Geobiosphere emergy baseline (GEB)
The emergy method accounts for all inputrequirements of systems and processes by expanding temporal system boundaries to include all energy, material and information sources consumed previously in support of processes that supply contemporary inputs (Brown and Ulgiati, 2004). Energy and matter are extracted from the geobiosphere that gives the environmental support to productive process of goods and services. The geobiosphere contribution can be evaluated by estimating the whole emergy driving the geobiosphere and apportion to it. There are three primary exergy (available energy) sources of different origins (solar radiation, geothermal heat and gravitational energy) that interact to drive processes between geobiosphere and can be expressed with the same unit by equivalency factors. Each of this sources are expressed in solar equivalent exergy from which, all other forms of energy can be computed, so that they may be expressed as emergy in units of solar emjoules (Brown et al., 2016). Equivalent in this context means equal in quality or value, or corresponds in value to another. The result is the amount of direct available energy supporting the biosphere, expressed in terms of solar equivalent exergy, named “geobiosphere baseline” (GEB), in a temporary domain of one year. This baseline is an important contribution to emergy evaluations because is the basis to calculate unit emergy value (UEVs) of storage and flows in the geobiosphere. Over time, the new GEBs were developed since the availability of updated information about earth‟s energy budget. In 1971, at the beginning of emergy development, Odum considered solar energy as the basis for all other forms of energy, estimating 1000 joules of sunlight to produce 1 joule of organic matter and about 42E+6 joules of solar energy to produce 1$ of human service. After further amendments, in 1996 Odum,
21
Introduction to Emergy
with the publications of Environmental Accounting, proposed the baseline of 9.44E+24 sej y-1. The first emergy folio (Odum and Odum, 2000) used a new value called “global empower base” of 15.83E+24 sej y-1. Since 2000, researches have proposed several baselines as alternatives to values put forward by Odum, ranging from 9.44E+24 sej y-1 to 15.83E+24 sej y-1 and based on different methods of computation, different assumption regarding system organization and inclusion or exclusion of emergy sources driving biosphere processes. The presence of different and alternative baselines raised the problem of standardization to make comparison among studies and generated some confusion within the scientific community. The results obtained with one baseline can be easily updated to another baseline by using a scaling factor: to convert data obtained with analyses performed under an earlier baseline to this new baseline, the data should be multiplied by the ratio of the new baseline to the older one. However, a research effort was undertaken to obtain a unified baseline. During 8th biennial emergy conference in January 2014, a group of scientist re-examined the latest three approaches used in GEB evaluation. Finally, Brown et al. (2016) updated the baseline value to 1.20E+25 sej yr-1. Past analysis, with reference to old baselines, can be easily compared to new studies by using a scaling factor as already explained.
2.7Application of Emergy principles to ecosystems: a graphic model to evaluate energy flows
The systems are defined as group of parts that are connected and work together. Ecosystems are systems that present living and non-living components. To survive an ecosystem needs a continuing supply of materials and in its processes energy is always required. Some living organisms take energy from the sun and create a flow of energy and materials through a food web. Organisms that are capable to make their own food from chemicals, using the energy of the sun, are called PRODUCERS. Organic products of living organisms are biomass. Other organisms consume products made by producers and are known as CONSUMERS.
22
Introduction to Emergy
Herbivores → plant eaters Carnivores → meat eaters
Decomposers → digesters or dead organic matter
The chemical waste product, coming from consumer‟s digestion, are called NUTRIENTS and can be taken by producers to form organic matter again: we said they are recycled. H. T. Odum in his books uses symbols as a simple graphic representation of system components (Fig. 3). The use of this system language can help in the understanding of how systems operate.
Figura 3. Symbol used for parts of an ecosystem
Figure 4 shows an example of a simplify ecosystem food chain using the language described. Sun is presented as the energy sources, plants are represented by the symbol of producers and animals indicated as consumers. Arrows point out materials and energy flows.
23
Introduction to Emergy
Environmental components require a system overview. The diagram is a simple model showing the relationship between the different components of the ecosystem and the flow of energy and materials from one unit to another. It helps us to get the whole picture of the system. For this, Energy System diagrams are a necessary step in the emergy analysis of ecosystems. They are called “energy” because every element has some energy. To easily understand and investigate energy exchanges within a food web it is convenient to transform the web into a single food chain. Figure 5 shows a food chain with numbers on the flow lines representing the rates of flows of energy per year.
Figure 5. System diagram of a quantitative food chain (from Brown, 2003).
The source of energy is the sunlight, part of it is direct and the other part is the sun energy that falling on the ocean to give rain. About 1% of the 1.000.000 joules of sunlight that support the system in one year are transformed by producers into plant biomass (about 10.000 joules of new trees and plants are produced per year). The efficiency use of sunlight is calculated by the ratio 10.000/1.000.000 = 1/100 or 1%. At each successive level, about 10% of the energy available is converted to new biomass. In conclusion, 1.000.000 joules of sun and rain are required to produce 1 joule of tertiary consumers. The food chain is characterized by different steps, each representing the food categories consumed by organisms that are called trophic levels. In the food web, producers are in the left end of the chain while consumers are in the right end. Generally, consumers took more energy than producers, so they can be considered organisms that required higher quality of energy. Many joules of energy are taken at the left of the chain to produce few
24
Introduction to Emergy
joules at the right: the energy quality is lowest at the left and rises at each level of the food chain. Interactions between different elements are represented in system diagrams by interaction symbols. In addition, quantity have their symbols: the storage tank symbol (Fig. 6).
Figure 6. Interaction and storage symbolsFigure 7. Heat sink symbol
During interaction processes, some energy can be dispersed from a storage of concentrated energy (the form available to do work). All storage and processes are accompanied by energy dispersal that cannot be used again and it is indicated with the heat sink symbol (Fig. 7).In the system diagram, symbols are enclosed by a box that marks the boundary of the ecosystem (Figs. 4, 5). Sources and heat sink are outside the box because the source (sun) is provided from an external font and energy dispersed cannot be reused. Moreover, figure 5 shows the sunlight source with one branch coming out again because part of solar radiation flows without being used. The outside sources (circle) influence the ecosystem. Sun drives photosynthesis, wind tide and river inflow release their emergy used for water movements (kinetic energy). The tide and the river also bring into the ecosystem nutrients, carbon dioxide, organic matter and other components. On the right side of the diagrams there are the inputs coming from human services and economy: fishing activities, boats, fuels and so on. All items farther to the right are defined as higher quality because they require more resources to maintain. Consequently, there is a gradient of energy through the energy diagrams: the amount of energy decrease to left end to right end of the diagram while its quality rise. A simple system (as shown in figure 4) usually contains at least one source, a producer, a
25
Introduction to Emergy
consumer, a heat sink and the connecting pathways. In the diagram the energy of sources are transformed by processes to give items called products. Production is the process by which two or more ingredients are combined to form a new product (Odum, 1988). When a consumption process accompanies production process, two different kind of production have to be considered:
GROSS PRODUCTION that represents the rate at which new productare made;
NET PRODUCTION (product minus the accompanying consumption process) is the production observed when production and consumption processes are occurring at the same time.
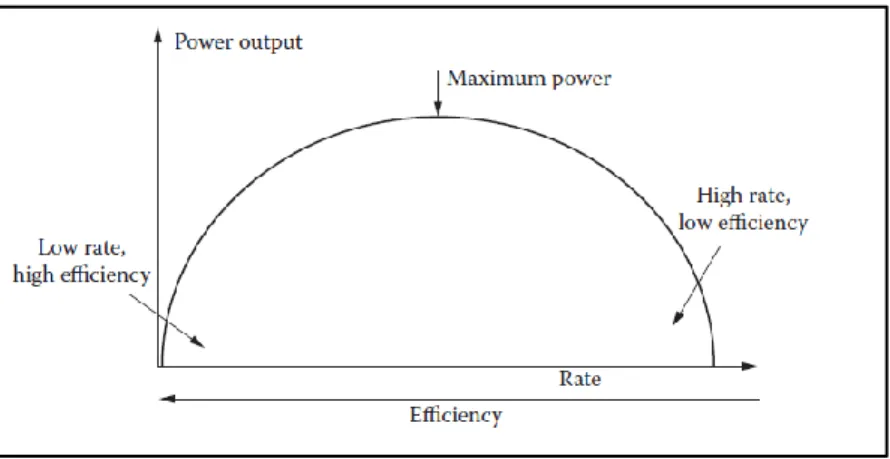
The productive process go faster when materials or energy required are available in large quantities. If they are no or less available, they are called limiting factors. Some systems are more able to survive than others, the MAXIMUM POWER PRINCIPLE explains the reason.
Figure 8. The maximum power principle claims that the development of an ecosystem is a trade-off (a compromise) between the rate and the efficiency, i.e., the maximum power output per unit of time (from Jørgensen, 2012).
Lotka (1956) formulated it and H.T. Odum used this principle to explain some characteristics of ecosystems. The principle states that the most successful ecosystems are those in which energy-capturing devices are most efficient in directing available energy into channel useful to their preservation and maintenance. In other words, system prevail if they manage to maximize the flow
26
Introduction to Emergy
of useful energy (for their maintenance and growth). Lotka‟s principle of Maximum Power revisited in terms of emergy of systems is known as Maximum Empower Principle. At all scales, systems prevail through system organization at first developing the most useful work, with inflowing emergy sources by reinforcing productive processes and overcoming limitation and secondly by increasing the efficiency of useful work. The term “useful work” means the use of the inflowing emergy in reinforcement actions that ensure and, if possible, increase it. Energy dissipation without the increasing of inflowing emergy is not a reinforce and, consequently, a system cannot compete with other systems that use inflowing emergy in self-reinforcing ways. Maximum Empower Principle is an important basis for emergy accounting.
27
Emergy evaluation procedure
Chapter 3
Emergy evaluation procedure
Emergy analysis is an environmental accounting method used to comprehensively measure the sustainability of human and natural systems. This analytical procedure is able to evaluate system‟s relationship with its human and natural surroundings by using similar units, considering all contributions to the formation of a particular good or service. Emergy analysis generally translates each form of matter or energy in a system into its equivalent solar energy or solar emergy by way of a unit emergy value (UEV) that reflects the quality value of matter and energy (Brown and Ulgiati, 2004). Both UEVs and other conversion factors provide the means of evaluating all the fluxes supporting the system in a common unit of measure called the solar emjoule(sej) (Vassallo et al., 2009). Specifically, it can be used to account for estimating the work required to deliver ecosystem services, environmental flows of energy and storage of energy in the form of natural capital (Tilley, 2006).
According to Hau and Bakshi (2004) the emergy analysis offers a number advantages, as it:
o Provides a way to bridge economic and ecological systems.
o Provides an objective means by which to quantify and value non-market inputs into a system.
o Shares the rigor of thermodynamics and is scientifically sound. o Provides a common unit that allows for a comparison of all resources. o Provides a more holistic alternative to many existing methods of
decision-making.
For such reasons, emergy analysis overcomes the shortcomings of traditional economic statistical methods and the energy analysis method. It has gradually become an important method to evaluate the sustainability of systems. The general methodology used to conduct an emergy analysis consists of defining the system boundary and using energy systems diagrams to depict the system‟s features, inputs and outputs to be analyzed. The next step involves creating an emergy table summarizing the emergy values of the system‟s stocks and flows. The stocks and flows are converted from units of energy or mass to equivalent
28
Emergy evaluation procedure
units of emergy by using transformity coefficients. The system‟s sustainability can then be investigated using a number of emergy indicators.
3.1 System diagram
The evaluation starts with energy Systems diagramming (Fig.9) to obtain an overview of the system because, to understand a problem, it is necessary to understand both the mechanism and the way the problem is controlled by the larger surrounding system.
Figure 9. Energy systems diagram of a general system with ecosystem and the economy (From Odum, H.T. and E.P. Odum, 2000).
The diagram underline the components and the processes of the system considered the contributing factors and the alternatives for management. The pathways of the diagram determine the line items in the following emergy evaluation table.
According to Odum (1996) several steps are essential in diagramming: - Identification of the boundary of the system.
- Analyze and list the most important external sources (an effect is suspected to be 5% or more of the total system functioning).
- Analyze and list the most important components within the system boundary. - Analyze and list the processes within the system boundary as flows, relationships, interactions, production, consumption and transactions of money. - Draw the diagram.
29
Emergy evaluation procedure
In order to standardize the diagram there are some rules to follow in drawing. The system is represented as a rectangular frame; external sources are arranged around the rectangle while internal components are inside it. Both sources and components are characterized by symbols (Fig. 10) with specific energetic and mathematical meanings. Even pathways are connected by symbols. It is important to include all known connections between system components in the draft diagram to insure completeness of the evaluation. Items and flows are arranged in order of transformityfrom left (lower transformity value) to right (higher transformity value).
Figure10.Odum’s systems language symbols (from Ascione et al. 2009)
At each process in the system most of the available energy is degraded, dispersed and transformed in a smaller amount of energy of another type to the right. In addition, it is possible to color the draw to make it easier to focus.
In this case, the following color scheme is suggested:
COMPONENTS COLOR
Sunlight, heat dispersal Yellow
Producers Green
Water, nutrients, material resources Blue
Consumers, cities, high transformity units
Red
30
Emergy evaluation procedure
Sometimes the diagram is complex because there are more components and pathways. For this reason, the first detailed diagram can be simplify by aggregation that combines all sources and components in a model with less pathways and symbols. In addition, the time scale for the diagram is important. If it is established that time scale for the matter of interest is one year, then items with a turnover time shorter than one year are aggregated and storage tanks are not included for them. A diagram like this is a useful tool for defining data needs, it shows clearly the main inputs to evaluate.
3.2. Emergy evaluation table
After a system diagram is drawn, all relevant items identified (flows of matter and energy) have to be categorized and added to a computational table or emergy table. The table is created in order to group flows with the same characteristics and to allow their conversion from conventional units (for example mass, energy euros or other currency) into emergy units (sej). In the emergy tables, raw data on the mass of flows and storage reserves are converted to energy and then to emergy units and Emeuros to aid in comparisons and public policy inferences. This is possible thanks to conversion factors called transformities. The emergy of each input is its energy multiplied by its transformity. Apart from the sun, that has a transformity of one by definition, it is necessary to calculate the transformitiesof the various resources. Today in the literature it is possible to find transformities of the main natural flows in the biosphere. Many are periodically revised by emergy scientists in special publications called folios.
Emergy flows to the system are divided into the maincategories as given in the following:
Local Renewable Resources (R) represent the resources replenished on a regular baseas a result of the use of planetary emergy inflows (solar radiation, geothermal heat). In general all renewable resources (rain, runoff, tide, wind…) are included in the emergy tables, but not all of them are calculated in emergy evaluation. This is due to the possibility that some resources could be co-product and so they cannot be counted twice to avoid double counting of the same flow.
31
Emergy evaluation procedure
Local Non-Renewable Resources (N) are raw materials that have been built over a long time by environmental processes, with use rates exceeding replacement rates. For example the fuel, metal and mineral extraction are non-renewable resources.
Purchased Resources (F) and service coming from outside system. Yield (Y) are the output of the system.
Solar emergy is calculated for each inflow, product or item of special interest. Tables provide a template for the calculation of the emergy values for energy sources and flows.The common format used to set up emergy tables is illustrated above. Each emergy evaluation table has almost six columns as shown in table1:
Column 1 Column 2 Column 3 Column 4 Column 5 Column 6
Note Item Data Emergy/Unit Solar Solar Emergy Em€
J, g, € sej/J, sej/g, sej/€ sej, sej/y Em€/y
Table 1. Tabular format for an emergy evaluation
Column 1: Note. The line number for the item evaluated is listed. Each line number corresponds to a footnote in a table where raw data sources are cited and calculations shown.
Column 2: Item. The name of the item is listed.
Column 3: Data. For each line item the raw data is given in joules, grams, euros or some other appropriate unit.
Column 4: Solar Emergy per Unit. For many items the solar emergy per unit (transformitywhere the unit is energy) has already been calculated in previous studies. If it has not, the solar emjoulesper unit can be calculated using one of the methods listed in Odum (1996).
Column 5: Emergy. The solar emergy is given here. It is the product of columns three and four. It can be an emergy flow (sej y-1) or emergy storage (sej).
32
Emergy evaluation procedure
Column 6: EmEuros. This number is obtained by dividing the emergy in column 5 by the emergy/euro ratio for the economy in the selected year. The total emergy of the output is the sum of the emergy inputs, and the tranformity of the output is its emergy divided by its energy value (see emergy algebra below 3.6).
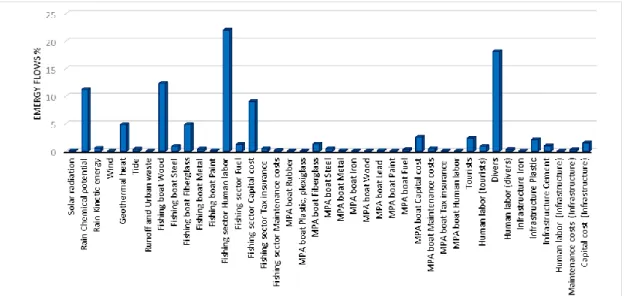
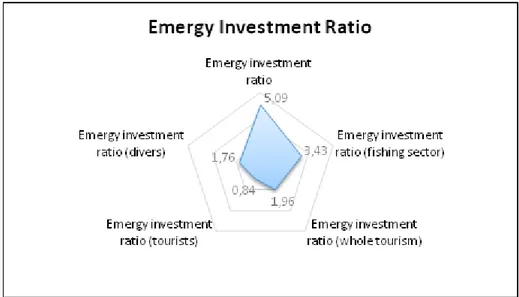
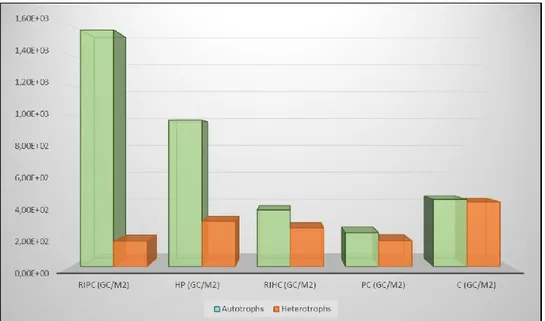
3.3 Emergy signature
Emergy signature of a system show the magnitude of environmental and economic inflows and outflows of a system on a synoptic plot that is useful in characterizing and classifying systems. The emergy signature is a bar graph of energy flows, with the magnitude and direction of the flow (in or out of the system) in sej per year shown on the ordinate and the type of energy flow identified on the abscissa. Emergy signature shows the relative contributions of the various energy inputs in terms of equivalent ability to do work. If functionally distinct areas have different emergy signatures and similar areas exhibit similarities in their emergy signature, the emergy signature may be useful in classifying different environmental systems based on differencesin their inputs.
3.4 Emergy indicators
Once the system has been quantified in emergy units, it can then be analyzed by using a number of
emergy indicators.
Several of these most common indices are listed and defined as follows:
- Local Renewable Sources (R): the flow of free renewable resources that are locally available.
- Non-Renewable Resources (N):the flow of non-renewable resources that are locally available.
- Imports Non-Renewable Resources (F): the flow of emergy imported in the form of goods and services from outside.
- Total emergy use (U=R+N+F): a measure of the global emergy support the system.
33
Emergy evaluation procedure
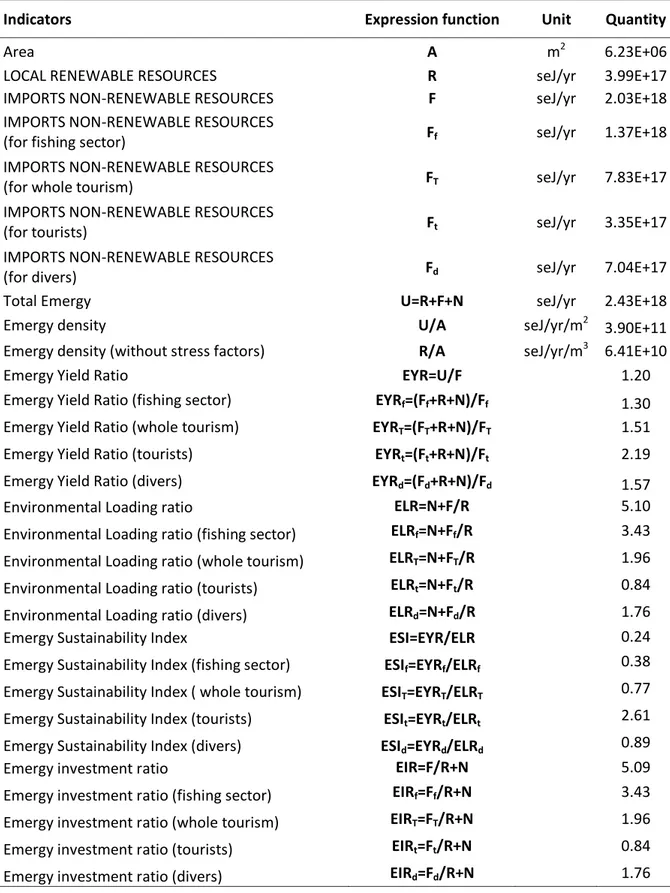
- Percent Renewable (%Ren): the percent of the total energy driving a process that is derived from renewable sources (R/(R+F+N). It represents the Renewable fraction of emergy use, an indicator of the actual carrying capacity. In the long run only processes with high %Ren are sustainable. - Nonrenewable to renewable ratio (NRR): is the ratio of non-renewable - Emergy density (U/area): the ratio of the total emergy use and the area of
the system.It measures spatial concentration of emergy. If the system needs high rates of emergy,compared to its surface the index value is elevate. High values indicate elevated range of anthropic pressure and environmental stress. The index can be considered also a measure of system‟s carrying capacity that represents the maximum load of a system. - Emergy-to-money ratio (Em/€): describes purchasing power, in emergy
units, of one unit of currency spent within the local economy. It is computed by dividing the total emergy use (R+N+F) by GDP (Gross Domestic Production).
- Emergy Yield ratio (EYR=U/F): is the emergy supporting the Yield (U=R+N+F) divided by the emergy of all the feedbacks from the economy including fuels and services.Calculates the amount of renewable energy utilized per investment of non-renewable energy. It is an indicator of the yield compared to inputs other than local and gives a measure of the ability of the process to exploit local resources. Low value of EYR indicate that a small amount of renewable energy is used per investment of amount of non-renewable energy.
- Environmental Loading ratio (ELR=(F+N)/R): is calculated as the sum of the emergy of non-renewable goods and services supplied by the economy and local free non-renewable sources, divided by the free renewable emergy drawn from the environment. ELR ratio is related to the fraction of renewable resources, it is an indicator of the pressure of the process on the local ecosystem and can be considered a measure of the ecosystem stress due to production activity.