AND SOUTHERN LAZIO
Ph.D. in Methods, models and technologies for
engineering
XXXII Cycle
Ph.D. thesis
Exposure to airborne Particles: estimation of dose
and Excess Lung Cancer Risk of populations living
in Western countries
Supervisor
Ph.D. student
Prof. Giorgio Buonanno Antonio Pacitto
Coordinator
Prof.ssa Wilma POLINI
ABSTRACT
In the present thesis, six experimental campaigns were carried out to better understand the influence of the lifestyle in the exposure to airborne particles and to estimate the typical received daily dose of different populations. Moreover, a risk assessment based on an Excess Lung Cancer Risk (ELCR) model was performed taking into account two crucial environments: school environments and street canyons. In addition, an evaluation of the effectiveness of some possible solution to reduce the ELCR was performed taking into account two solution: (i) personal protectors (facemasks) for outdoor environments, and (ii) air purifiers and ventilation strategies for indoor environments.
The daily dose in terms of particle surface area received by citizens living in five cities in Western countries (Barcelona, Cassino, Guilford, Lund and Brisbane), characterized by different lifestyle, culture and climate, was evaluated and compared. Non-smoking volunteers performing non-industrial jobs were considered in the study. Particle concentration data allowed obtaining the exposure of the “typical citizen” for each city. Such data were combined in a Monte Carlo method with the time activity pattern data characteristics of each population and inhalation rates to obtain the most probable daily dose in terms of particle surface area as a function of the population gender, age, and nationality. Indoor Air Quality (IAQ), and in particular cooking and eating activities, was recognized as the main influencing factor in terms of exposure (and thus dose) of the population: then confirming that lifestyle (e.g. time spent in cooking activities) strongly affect the daily dose of the population.
Looking at outdoor environments/activities, one of the most influencing microenvironments/activity to airborne particle exposure is "transport". To better understand this environment Vehicular Indoor Air Quality (VIAQ) was investigated inside 14 diesel/non-diesel taxi pairs operating simultaneously and under normal working condition over six weekday hours (10:00-16:00) in the city of Barcelona.
IV
Parameters measured included PM10 mass and chemistry, particle number
concentration (PNC) and size, lung deposited surface area (LDSA), black carbon (BC), CO2, CO, and a range of volatile organic compounds (VOCs). Keeping the windows
open or close has shown the dominant influence of the air exchange rates on VIAQ. Median values of PNC and LDSA were reduced to around 104 #/cm3 and <20 µm2/cm3 respectively under closed conditions, but more than doubled with windows open and sometimes approached 105 #cm-3 and 240 µm2/cm3.
In urban areas, the coexistence of nanoparticle sources and particular street-building configurations can lead to very high particle exposure levels. An innovative approach for the evaluation of lung cancer incidence in street canyons due to exposure to traffic-generated particles was proposed. To this end, the literature-available values of particulate matter, PAHs and heavy metals emitted from different type of vehicles were used to calculate the ELCR at the tailpipe. The estimated ELCR was then used as input data in a numerical CFD (Computational Fluid Dynamics) model that solves the mass, momentum, turbulence and species transport equations, in order to evaluate the cancer risk in every point of interest inside the street canyon. Thus, the influence of wind speed and street canyon geometry (H/W, the height of the building, H and width of the street, W) on the ELCR at street level was evaluated by means of a CFD simulation. It was found that the ELCR calculated on the leeward and windward sides of the street canyon at a breathable height of 1.5 m, for people exposed 15 minutes per day for 20 years, is equal to 1.5×10⁻⁵ and 4.8×10⁻⁶, respectively, for wind speed of 1 m/s and H/W equal to 1. The ELCR at street level results higher on the leeward side for aspect ratios equal to 1 and 3, while for aspect ratio equal to 2 it is higher on the windward side. In addition, the simulations showed that with the increasing of wind speed the ELCR becomes lower everywhere in the street canyon, due to the increased in dispersion.
Moving the attention on the indoor environments, schools may be classified as a critical microenvironment in terms of IAQ due to the proximity to outdoor particle sources and the frequent lack of proper ventilation and filtering systems. Moreover, the population exposed in schools (i.e. children) represents a susceptible population due to their age. Measurements in terms of PNC, LDSA, and PM fraction
V
concentrations were measured inside and outside schools in Barcelona (Spain) and Cassino (Italy). Simultaneously, PM samples were collected and chemically analyzed to obtain mass fractions of carcinogenic compounds. School time airborne particle doses received by students in classrooms were evaluated as well as their ELCR due to a five-year primary school period. Median surface area dose received by students during school time in Barcelona and Cassino resulted equal to 110 mm2 and 303 mm2, respectively. The risk related to the five-year primary school period was estimated about 2.9×10⁻⁵ and 1.4×10⁻⁴ for students of Barcelona and Cassino, respectively.
Different solutions were taken into account to reduce personal as well as collective exposure to airborne particles. An individual protective measure against particle pollution may be represented by face masks. A custom experimental set-up was developed in order to measure the effectiveness of nine different respirators under real environmental conditions in terms of particle mass concentration below 2.5 microns (PM2.5), PNC, LDSA and BC. Facemask performances were assessed in a typical
traffic affected urban background environment in the city of Barcelona under three different simulated breathing rates to investigate the influence of flow rate. Results showed a median face mask effectiveness for PM2.5 equal to 48% in a range of
14-96%, 19% in a range of 6% - 61% for BC, 19% in a range of 4% - 63% for PNC and 22% in a range of 5% - 65% for LDSA.
A collective and indoor-adaptable solution to reduce exposure to airborne particles could be represented by air purifiers and ventilation strategies. To evaluate the effect of different ventilation methods (natural ventilation, manual airing) and the use of air purifiers in reducing the indoor concentrations of different airborne particles and gaseous pollutants in indoor environments an experimental campaign was performed. The samplings were carried out in two naturally-ventilated school gyms in Barcelona (Spain) of different volumes and different distance to major urban roads. Indoor and outdoor measurements of PNC, BC and PM1-10 concentrations were performed as well
as indoor measurements of CO2 and NO2 concentrations. The study revealed that the
use of air purifier with windows kept closed (natural ventilation) can lead to a significant reduction in terms of indoor-to-outdoor concentration ratios. In the smaller gym (air changes per hour of the purifiers, ACH, equal to 9.2 h-1) the I/O ratios were
VI
reduced by 93% and 95% in terms of particle number and PM1-10, respectively;
whereas in the larger school gym (ACH=1.7 h-1) the corresponding reductions were 70% and 84%. For manual airing scenarios, the effect of the air purifiers on outdoor-generated sub-micron particles is reduced; in particular, for low ACH values (i.e. ACH=1.7 h-1), the reduction is quite negligible (6%).
VII
TABLE OF CONTENTS
ABSTRACT ... III List of Figures ... IX List of Tables ... XIII
1 Introduction ... 16
1.1 Air quality ... 16
1.2 Human exposure to particulate matter ... 17
2 Objectives ... 25
3 The influence of lifestyle on airborne particle surface area doses received by different Western populations ... 27
3.1 Methodology ... 28
3.1.1 Study area ... 28
3.1.2 Study design ... 30
3.2 Results ... 35
3.2.1 Time activity pattern ... 35
3.2.2 Concentration levels of sub-micron particles in the investigated cities 37 3.2.3 Total daily dose received by population ... 40
4 Vehicle interior air quality conditions when travelling by taxi... 44
4.1 Methodology ... 45
4.2 Results ... 49
4.2.1 Physical measurements ... 49
4.2.2 Chemical measurements ... 57
4.3 Discussion ... 67
5 Lung cancer risk assessment due to traffic-generated particles exposure in urban street canyons: a numerical modelling approach ... 73
5.1 MATERIALS AND METHODS ... 74
5.1.1 ELCR model implementation ... 74
5.1.2 Literature survey for particle size distributions ... 76
5.1.3 ELCR calculation at the fleet-tailpipe ... 78
5.1.4 CFD model details... 78
5.1.5 Computational domain and boundary conditions ... 79
5.1.6 Parametric analysis ... 80
VIII
6 Particle-related exposure, dose and lung cancer risk of primary school children in
two European countries ... 87
6.1 Materials and methods ... 88
6.1.1 Study area and monitoring sites ... 88
6.1.2 Experimental apparatus and methodology ... 89
6.1.3 Data post-processing ... 92
6.1.4 Evaluation of the daily dose and excess lifetime cancer risk received by students 93 6.2 Results and discussion ... 96
6.2.1 Exposure in schools ... 96
6.2.2 Chemical characterization ... 98
6.2.3 Dose and risk received by students ... 100
7 Real-world effectiveness of commercial face masks to reduce personal PM exposure ... 103
7.1 Materials and Methods ... 104
7.2 Results ... 108
8 Effect of ventilation strategies and air purifiers on the children’ exposure to airborne particles and gaseous pollutants in school gyms ... 114
8.1 Materials and Methods ... 115
8.1.1 Site description ... 115
8.1.2 Methodology and experimental apparatus ... 115
8.2 Results ... 119
9 Conclusion ... 130
IX
L
IST OF
F
IGURES
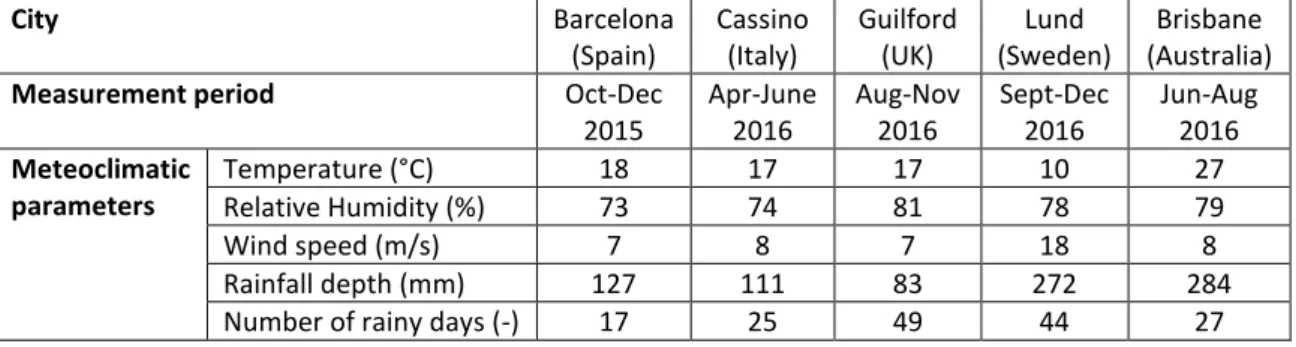
Figure 1 Box plot of particles number concentrations in the investigated cities as a
function of the microenvironments. ... 39
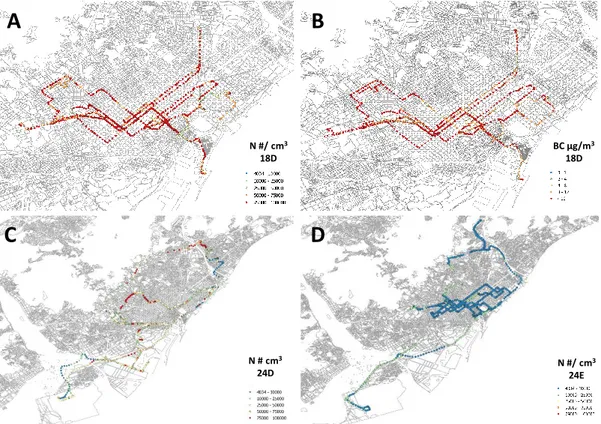
Figure 2 Median values of particle numbers (PNC, in blue, expressed in #/cm3 in
the size range of 10-700 nm) measured inside taxis compared to CO2 concentrations
(in red) for conditions of either open (CO2 = 330-440 ppm) or closed (CO2 1700-3500
ppm) windows over 6-hour daytime period. Lowest values of N, and highest values of CO2, were recorded when windows were closed. The number on the horizontal axis
refers to the date in October 2017 (all dry days without precipitation), and the letter refers to the fuel type (D = diesel; E = electric; H = hybrid; LPG = liquid petroleum gas; NG = natural gas). Five taxis (9D, 10D, 23D, 27D, 20H: not shown on this figure) recorded CO2 values between 450-600 ppm due to windows being opened
occasionally, and in one taxi (31D) the CO2 equipment malfunctioned. The inset shows
an example of how PNC and black carbon peaks can be positively correlated (diesel taxi 9th October with windows open), as demonstrated in previous publications (e.g. Krecl, et al. [182]). ... 52
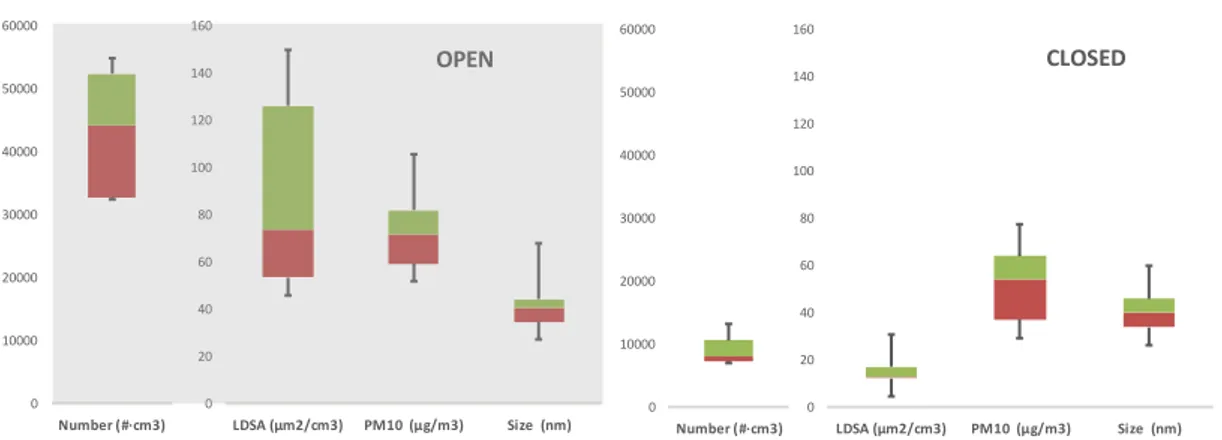
Figure 3 Box plot comparing VIAQ parameters particle number, lung deposited
surface area (LDSA), PM10 mass, and particle size inside taxis with windows open and
closed (median values over 6-hour daytime period). The coloured box defines the interquartile range, and the median is represented by the horizontal line separating the two colours. Particulate number, LDSA and mass levels are lower and less variable in the protected environment of a taxi interior with closed windows. ... 53
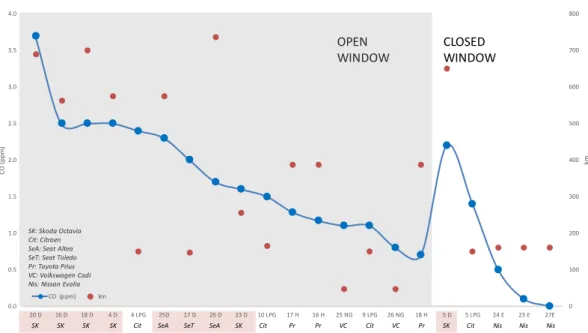
Figure 4 Median 6-hour daytime values of carbon monoxide levels in taxi interiors
with windows open (CO2 = 330-570 ppm) and closed (CO2 1700-3500 ppm). Higher
levels of CO are mostly associated with diesel taxis (pink shading), notably the high-km Skoda Octavia. Lowest CO levels were recorded in electric-powered taxis driving with windows closed. Note the difference between closed-window diesel and electric vehicles. The number on the horizontal axis refers to the date in October 2017, and the letter refers to the fuel type (D = diesel (pink background); E = electric; H = hybrid; LPG = liquid petroleum gas; NG = natural gas). All diesel cars were different (this being the most common taxi type in Barcelona), whereas for other fuel types the same car was used more than once except in the case of LPG where two different vehicles were used. ... 54
X
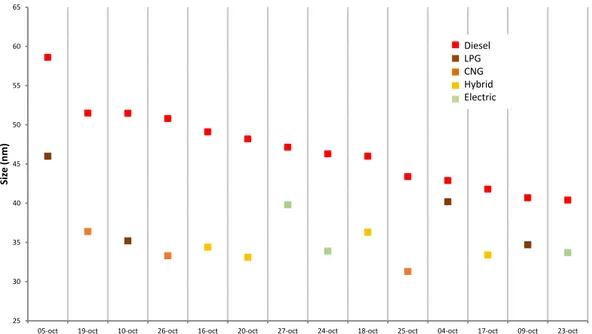
Figure 5 Median ultrafine particle sizes (nm) inside taxi pairings over 6-hour
daytime working period. Diesel taxi VIAQ consistently shows larger median particle sizes than other engine types. ... 55
Figure 6 Examples of pollutant concentrations inside taxis driving through the
Barcelona area during the 6-hour daytime monitoring period (10.00-16.00). The route taken by the open-window diesel taxi on 18th October was restricted to the city centre, especially the traffic-choked grid-plan L’Eixample area, and records generally very high levels of both UFP number (N: 6a) and black carbon (BC: 6b). In contrast the two taxis represented in Figures 6c and 6d drove with windows closed and A/C on, spending much of the time in the city centre but also making excursions out of the city to the southwest and the northeast. Levels of UFP numbers inside the closed taxis remained very low except when the windows were opened briefly (see text for discussion). ... 56
Figure 7 Comparison of median UFP number (PNC) and particle size (nm) during
the 6-hour monitoring period inside taxi 5D (Figure 6d). Generally low levels of PNC (<10000 #/cm3) were maintained during the day by keeping windows closed, with the notable exception of two pollution events in the airport area and when driving along the congested Gran Via, when PNC rise rapidly and particle size decreased. ... 57
Figure 8 Comparisons between the chemistry of PM10 measured inside taxis with
data from the Barcelona urban background air monitoring site in Palau Reial, and from the European Monitoring and Evaluation Programme (EMEP) remote site at Montsec in the Catalan Pyrenees 150 km northwest of Barcelona (https://www.idaea.csic.es/egar/montsec/). ... 60
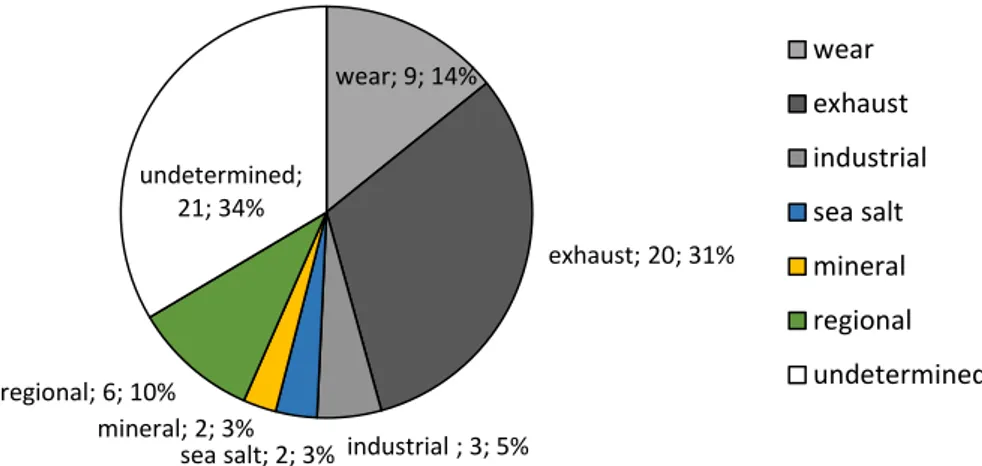
Figure 9 Average mass contributions (in µg/m3 and %) of aerosol sources in the
interior of the taxis determined by PMF. ... 60
Figure 10 Chemical profiles of the aerosol sources resolved by PMF. ... 62 Figure 11 Histograms ranking the relative abundances of VOCs measured inside
taxis. ... 66
Figure 12 Ternary plot comparing PM10 measured inside Barcelona taxis with the
compositions of PM2.5 collected from bus, subway and outdoor roadside
microenvironments (see Moreno et al., 2015). The relative enrichment in Sb is attributed to brake particle emissions. The blue star marks the composition of Barcelona urban background during the October 2018 VIAQ taxi measurement campaign. ... 71
Figure 13 Computational domain and boundary conditions used for the numerical
XI
Figure 14 Airflow fields and corresponding ELCR distribution for H/W=1 (a),
H/W=2 (b) and H/W=3 (c), for a wind speed of 1 m/s, considering people exposed to traffic emissions 24 hours per day for 70 years. ... 83
Figure 15 ELCR calculated at a breathable height of 1.5 m from the street level on
the leeward and windward sides of the street canyon as a function of wind speed (top panel) and aspect ratio H/W (bottom panel). People exposed 24 hours per day for 70 years. ... 84
Figure 16 Statistics of indoor and outdoor airborne particle concentrations
measured in the schools of Barcelona and Cassino in terms of a) number (Barcelona), b) lung-deposited surface area (Barcelona), and c) PM fraction concentrations (Barcelona and Cassino). Box-plots report 5th and 95th percentiles, 1st (Q1) and 3rd (Q3)
quartiles, mean and median value. ... 98
Figure 17 Statistics of the total particle surface area doses received by students in
classroom in Barcelona and Cassino during school time. Box-plots report 5th and 95th
percentiles, 1st (Q
1) and 3rd (Q3) quartiles, mean and median value of the δAlv+Tb.
... 102 Figure 18 Scheme of measurement set-up. ... 108
Figure 19 Examples of sampling in terms of: a) particle mass concentration related
to mask 7 at 52 L·min-1; b) Lung Deposited Surface Area related to mask 7 at 32 L·min
-1, c) particle number concentration related to mask 7 at 32 L·min-1; d) black carbon
concentration related to mask 7 at 32 L·min-1. In each example are shown both cases, with and without face mask (dummy head A and dummy head B). ... 109
Figure 20 Airborne particle reduction for the entire campaign for all face masks
under investigation collected for different metrics express as a boxplot showing maximum, minimum and 75th, 50th and 25th percentiles. ... 110
Figure 21 Effectiveness of face masks for the three different breathing rates for
PM2.5. ... 113
Figure 22 Different filter layers of MASK... 113 Figure 23 Example of indoor (gym) and outdoor 24-h trends of total particle
number concentrations (PNC), BC, and PM1-10 measured for one day during the one
week of monitoring campaign for the different scenarios (NV, NV+AP, MA, and MA+AP) in the school gym B. The shaded area represents the school gym time. . 122
Figure 24 Example of indoor (gym) 24-h trends of NO2 and CO2 measured for one
day during the one week of monitoring campaign for the different scenarios (NV, NV+AP, MA, and MA+AP) in the school gym B. The shaded area represents the school gym time. ... 123
XII
Figure 25 Box-plots of airborne particle concentration levels (PNC, BC, PM1-10)
measured during the school gym time for the whole experimental campaign performed in the two school gyms at indoor (gym) and outdoor monitoring sites for the different scenarios (NV, NV+AP, MA, and MA+AP). ... 125
Figure 26 Box-plots of CO2 and NO2 measured during the school gym time for the
whole experimental campaign performed in the two school gyms at indoor (gym) monitoring site for the different scenarios (NV, NV+AP, MA, and MA+AP). ... 126
L
IST OF
T
ABLES
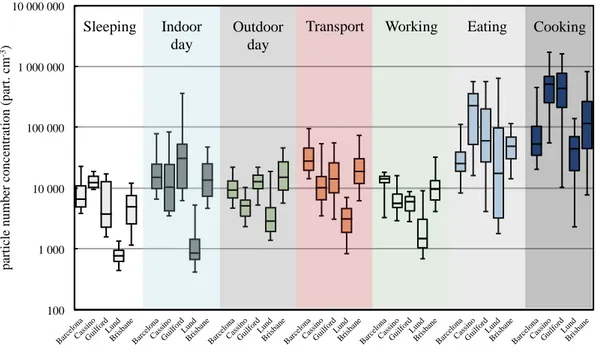
Table 1 Data of the main meteoclimatic parameters during the experimental
campaigns for the five cities investigated, as reported by the US National Weather Service's National Centers for Environmental Prediction. Temperature, relative humidity, and wind speed data are reported as median values. ... 30
Table 2 Classification of the activities performed by the citizens in seven main
microenvironments. ... 33
Table 3 Time activity pattern data (daily time spent, in minutes, for each main
microenvironment) of the typical population investigated, as function of age and gender, as obtained from the national statistics institutes and/or research studies. Time activity data are reported as mean ± standard deviation for Italian, Spanish, Swedish and Australian people, whereas minimum and maximum values were considered for U.K. people. ... 37
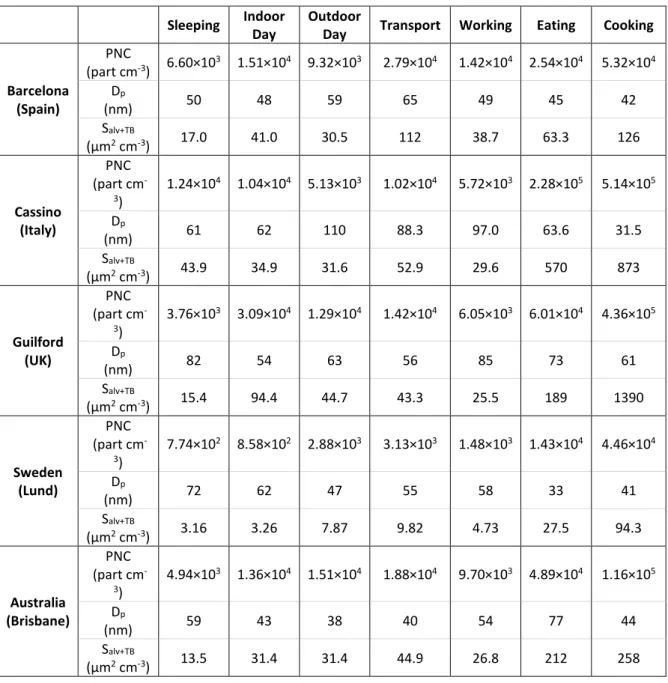
Table 4 Median values of particle number concentration, particle average size and
lung deposited surface area dose calculated for the populations under investigation as a function of the microenvironment. ... 40
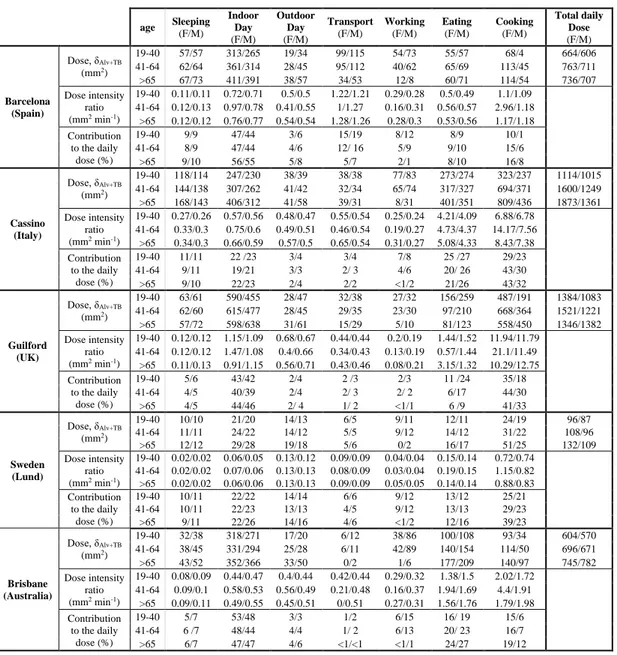
Table 5 Dose, dose intensity and contribution to the daily dose as function of the
population, age, gender (female/male, F/M) and microenvironment. Data represent the most probable values as obtained from the Monte Carlo simulation. ... 43
Table 6 List of vehicles that participated in the Barcelona Taxi Air Quality
Monitoring Campaign. For hybrid, CNG and electric the same taxi was used for repeated experiments. ... 46
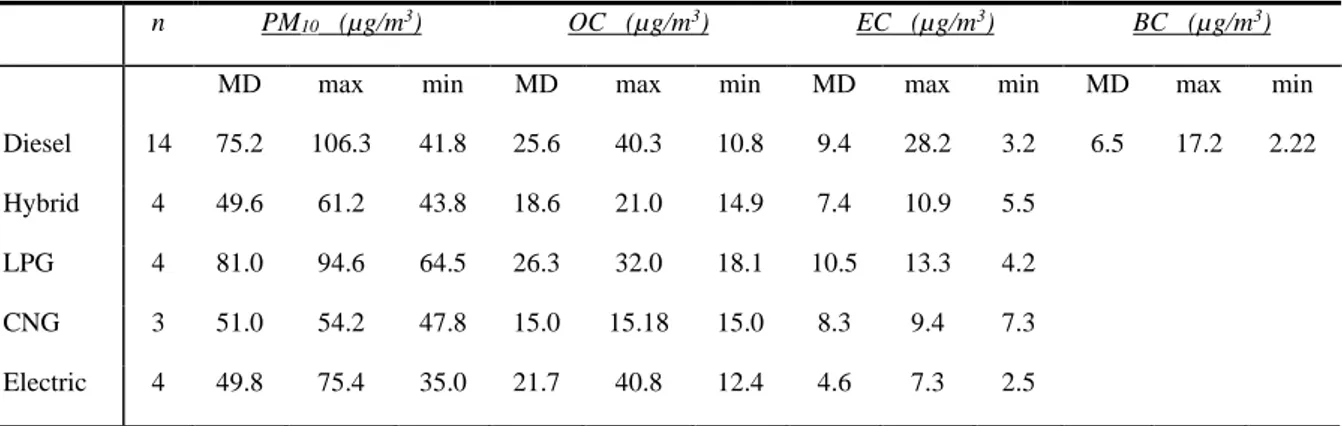
Table 7 Median (MD), maximum (max) and minimum (min) values for selected
parameters measured at different fuel-type taxis. n: number of taxis. LPG: liquid petroleum gas, CNG: compressed natural gas. ... 50
Table 8 Average values for chemical analysis of PM10 sampled from taxi interiors.
In addition to all taxis (28 analyses) there are 5 subgroups depending on whether windows were kept open or closed, and on how the vehicle was powered. ... 59
Table 9 Concentrations of VOCs inside the studied taxi cars. LPG: liquefied
petroleum gas; CNG: compressed natural gas. ND: not detected value. LOD: limit of detection ... 64
XIV
Table 10 Inhalation cancer slope factor (SF) for the considered IARC Group 1
carcinogenic compounds, as provided by Office of Environmental Health Hazard Assessment.[217] ... 75
Table 11. Emission factors of the considered emitted pollutants (literature
data[218])... 75
Table 12. Particle physical characteristics emitted from the different typologies of
vehicles considered (LDV: light duty vehicles, HDV: heavy duty vehicles), together with the main vehicle/engine characteristics (DPF: diesel particulate filter, EGR: exhaust gas recirculation, DOC: diesel oxidation catalyst, CDPF: catalyzed diesel particulate filter). ... 78
Table 13. Mass fractions of emitted carcinogenic compounds on PM10 (expressed
as mg/mg) and corresponding SF of the mixture (SFm). Data of SF for each compound
obtained from Office of Environmental Health Hazard Assessment [217]. ... 82
Table 14 ELCR values calculated on the leeward and windward sides of the street
canyon at a breathable height of 1.5 m, for people exposed 24 hours per day for 70 years. Reference simulation case in bold. ... 85
Table 15. ELCR values calculated on the leeward and windward sides of the street
canyon at a breathable height of 1.5 m, for people exposed 15 minutes per day for 20 years. Reference simulation case in bold. ... 85
Table 16 Scheme of the instrumentation used at the different sampling sites during
the experimental campaigns performed in Barcelona and Cassino. ... 92
Table 17 Median As, Cd, Ni and BaP annual concentration measured at the outdoor
and indoor sampling sites of the schools investigated. ... 99
Table 18 Median mass fractions of carcinogenic compounds on PM (expressed as
ppm) measured at the outdoor and indoor sampling sites of the schools investigated and corresponding SF of the mixture (SFm). Mass fractions were referred to PM2.5 and
PM10 for samples collected in Barcelona and Cassino, respectively. ... 100
Table 19 Median ELCR values of the primary school students in Barcelona and
Cassino for the five-year primary school period (ELCR5 years) and contribution of the different metrics (surface area, SAlv+TB, and PM10). ... 102
Table 20 Face mask models, characteristics and filtration typology (based on info
found on producers’ websites march 2018), different filter layers information was obtained in laboratory. ... 106
Table 21 Details on experimental campaign ... 107
Table 22 Measured values (average ± standard deviation) of PM2.5 (µg· m-3), PNC
XV
each breathing rate BR (L·min-1 ) for both situations without and with face masks and face masks effectiveness E (%). CA and CB are concentration range measured in
dummy heads A and B respectively for the related metrics. ... 112
Table 23 Indoor/outdoor (I/O) median concentration ratios measured for all
scenarios under investigation (NV, NV+AP, MA, MA+AP) in terms of particle number concentration (PNC), BC, and PM1-10 and for both school gyms under
investigation. ... 128
Table 24 Difference of total removal rate amongst NV+AP and NV scenarios
((AER+k)NV+AP – (AER+k)NV, h-1) in terms of particle number (PNC, PNC<40, PNC 40-130, PNC>130) and mass concentration (PM1-10, PM1-2.5, and PM2.5-10) for both the
investigated school gyms. Values reported represents the differences amongst the median ((AER+k)NV+AP and ((AER+k)NV values. ... 129
CHAPTER 1. INTRODUCTION
1 I
NTRODUCTION
1.1 Air quality
Human beings need a regular and continuous supply of air, and every day human adult breathes:
- In rest condition around 13 l/min;
- During moderate activity around 29 l/min; - During high-intensity activity around 53 l/min.
Therefore, given its obvious importance to human existence, it is imperative that air remains unpolluted [1]. This requires the control of the environmental air quality and where necessary, the enforcement of emission limitations for air pollutants. Since the antiquity, humans started to recognize some correlation between poor air quality and human disease, but only in the twenty century, the adverse health effect of air pollution entered the world consciousness. This problem started to be present in the public opinion in 1930 when emissions of sulfur dioxide (SO2) mixed with dense fog in the
Meuse Valley in Belgium lead to 60 people died [2]. Another episode where people have been could notice the relation between air pollution and human health was in London, in 1952, wherefrom December to February 12000 people died after exposure to dense smog containing SO2 and smoke particulate [3]. The first major regulatory
effort aimed at both studying and setting limits on emission and air pollution was in America in 1970 with the Clean Air Act (CAA). On this occasion, the CAA defined the National Ambient Air Quality Standards that set limits on six primary pollutants found in the air: Carbon Monoxide “CO”, Lead “Pb”, Nitrogen Dioxide “NO2”, Ozone
“O3”, Sulfur Dioxide “SO2” and Particulate Matter “PM” [4].
Inhalation and consequent absorption of airborne particles and chemicals may have direct consequences for human health. Nevertheless, adverse health effect can also be indirectly influenced by the deposition of air pollutants in environmental media and
17
uptake by plants and animals. This lead to entering the food chain or being present in drinking water of the chemicals and thereby constituting additional sources of human exposure. Recognizing the need for humans to unpolluted air the WHO published the first "air quality guidelines for Europe" in 1987 [5]. To this reason in recent decades, major efforts have been made to reduce air pollution, declined significantly the emission of the main air pollutants. For example, the reduction of SO2 was about 50%
in the period 1980-1995 [6, 7], and this reduction is reflected by declining concentrations in ambient air in urban areas. Instead of the trend concentration of others pollutants, as PM or NO2, less clear and it is envisaged that these pollutants still
constitute a risk to human health [8, 9].
1.2 Human exposure to particulate matter
People can be exposed to a high concentration of airborne particles both in indoors and outdoors. Many studies highlighted the link between inhalation (and consequent deposition) of airborne particles in human respiratory tracts and health effects, such as respiratory diseases and inflammation [10, 11], cardiovascular diseases [12], diabetes [13], higher systolic blood pressure and pulse pressure [14], and decreased cognitive function in older men [15]. Moreover, the International Agency for Research on Cancer (IARC) has recently classified the particular matter (PM) as carcinogenic to humans (group 1) on the basis of the evidence presented by studies that showed a significant correlation between lung cancer and the exposure to PM [16, 17].
PM is a complex mixture of small solid particles and liquid droplets that are suspended in the air and vary in size, shape, surface area, chemical composition, solubility and origin. Particles with aerodynamic diameter <2.5µm are often considered more harmful than larger-sized particles because it can penetrate in the deeper parts of human’s respiratory track like bronchi and Alveoli [18]. Main contributors to PM in urban areas are mainly emissions from combustion processes, industries and power generation plants, but also by atmospheric photochemical reactions and conversion processes [19]. Ultrafine particles (UFPs) are defined as those having diameters <0.1 µm. Typically, a higher concentration of UFPs is recorded close to the emission sources [20] and can decrease rapidly as the distance from the emission source
CHAPTER 1. INTRODUCTION
18
increases [21-24]. Their ability to penetrate in the deepest areas of the human respiratory tract can cause various adverse effects, possibly release in the bloodstream toxic and potentially carcinogenic substances [25, 26]. Particle Number Concentration (PNC) and Surface Area (SA) have been identified as more appropriate metrics for UFP-related health effects [27-29] and the biological response may be more related to the SA of the particle deposited in the lungs than the other metrics [30, 31]. Another component of fine particles is Black Carbon (BC): a primary PM component that is emitted from incomplete combustion as small sphere in a range size from 1 to 50 nm, and aggregates to particles of larger size, from 0.1 to 1µm [32]. BC can be considered a better indicator of harmful particulate substance caused by combustion sources than PM10 and PM2.5 [33]. A number of studies indicated that traffic-related policy
measures should focus on the reduction of BC concentration [33-35]. In a moderately polluted urban area, BC concentration values are in the range of a few µg·m-3, while in a heavily polluted area can reach up to tens of µg·m-3 under unfavorable meteorological conditions. Many studies have revealed a link between exposure to BC and increasing adverse health effects in cardiovascular diseases such as cardiac and ventricular arrhythmias, lowered heart rate variability, changes in blood pressure and increase of cardiovascular mortality [36-39] or negative effects on the respiratory system [40]. In addition, recent studies on spatial and temporal evolution of BC concentration in urban areas, report the significance of BC contribution in UFPs concentrations [35, 41-43], but also that in high insolation urban areas nucleation of secondary particles highly influence the PNC [44]. The harmful potential of airborne particles stems from their ability to penetrate, and deposit in the deepest areas of human respiratory tract, causing irritation, inflammation, and possibly translocate to the blood system, carrying with them carcinogenic and toxic compounds [45], and depositing in secondary organs [46] including brain tissues [15]. Even though the scientific community has not reached a definitive conclusion whether morphology, size or chemical composition of the particles are the key factor in affecting human health, the focus of scientific studies has shifted from super-micron particles (whose contribution is expressed in terms of mass concentrations of particles smaller than 10 and 2.5 μm, i.e. PM10 and PM2.5) [47, 48] to sub-micron (PM1) and UFP whose
19
contribution is better related to PNC [49, 50] and SA concentration [29] than mass concentration. In fact, numerous toxicity-based studies have shown that surface area is a more appropriate metric for UFP-related health effects [27, 51] and that the biological response depends more on the SA of the particles deposited in the lungs than on other exposure metrics [30, 31]. This could be due to their large surface area and the related high probability to carry and transmit toxic compounds [52, 53]. In order to evaluate the health effect of the exposure to airborne particles, a dose-response relationship is needed [54]. To this purpose the daily dose of airborne particles received by people, along with the toxicity of such particles, is a key parameter to be evaluated and provided to medical experts [27, 55, 56]. Moreover, the airborne particle daily dose is the main input data for a human health risk model [57]. Airborne particle doses received by population can be evaluated based on exposure measurements. Nonetheless, even though the scientific community is moving from particle mass-based to PNC and SA-mass-based metrics, the current legislation is still limited to outdoor concentration of PM10 and PM2.5; further, such measurements are limited to a number
of fixed outdoor sampling points (FSPs) located in specific regions of interest in the urban area [58, 59]. The number of FSP is a function of the population density, without links to climate nor the community lifestyle, and therefore is not properly representing the actual exposure of citizens to PM [60]. Moreover, PM10 and PM2.5 measurements
at FSPs cannot be considered proxies for exposure to sub-micron and UFP since they present different dynamics (e.g. dilution, deposition) and sources (e.g. sub-micron particles are mainly generated by combustion processes whereas super-micron particles are mostly emitted by mechanical processes, [23, 24, 61, 62]).
Traffic is considered one of the main source of air pollutants in cities, and with urban inhabitants already accounting for a majority of the total global population (https://data.worldbank.org/indicator/SP.URB.TOTL.IN.ZS, UN Population Division) the effects of breathing vehicular gas and particle emissions have grown to become one of our most challenging environmental health problems (e.g. [63, 64]. Traffic-related air pollutants (TRAPs) source from both exhaust and non-exhaust (such as brakes and tyre wear [65]) emissions and their distribution is typically highly variable in time and space (e.g; [61, 62]. There are consequently notable differences
CHAPTER 1. INTRODUCTION
20
in the exposure of individual city commuters to TRAPs during their travel through the city. For the traveler outdoors the most important of these factors is proximity to the sources of traffic emissions, whereas for the commuter inside a road vehicle exposure to TRAPs will depend primarily on air exchange rates (e.g. [66-68]). In Moreno, et al. [69] authors compared pollutant exposure when travelling by different public transport options (bus, tram, subway) in Barcelona to improve the understanding of how real-time air pollutant concentrations regularly inhaled by urban commuters vary depending on how they choose to travel.
Commonly, one of the most critical urban configurations in the cities in which the air quality get worse is the so-called street canyon, which is a typical urban configuration of a street flanked by buildings on both sides. In a street canyon, air exchange provided by natural ventilation may become weak with consequent formation of high particle concentration zones. For these reasons, urban microenvironments may increase human exposure to high particle concentrations, and significantly contribute to the increase of the daily dose[70] likely leading to pulmonary and cardiovascular diseases, as well as to lung cancer cases[71-73].
There are several studies in scientific literature addressing the evaluation of air quality in urban street canyons by means of numerical simulations and dedicated experimental campaigns. Numerical simulations of pollutant dispersion inside street canyons of different typologies were carried out by Kikumoto and Ooka [74] and Hertwig, et al. [75], finding that the canyon geometry strongly influence the ventilation efficiency and then the pollutant dispersion. Similar results were found in Scungio, et al. [76], where the fluid flow patterns and the dispersion of UFPs inside street canyons of different aspect ratios (H/W, height of building, H and width of the street, W) with different turbulence modelling techniques were calculated[76, 77].
Mediterranean cities are recognized to be densely populated and trafficked suffering from higher levels of PM2.5 than those of Northern Europe [78, 79]. Thus,
citizens in these cities live generally close to main roads and are exposed to high exhaust and non-exhaust vehicle emissions. Such high density of urbanization also causes short distance from schools to major roads leading to non-negligible near-road pollution exposure at schools of children as evidenced by the international UPTECH
21
(Ultrafine Particle from Traffic Emission on Children Health; [80] and BREATHE (BRain dEvelopment and Air polluTion ultrafine particles in scHool childrEn; [81-83] projects. Indeed, children are the most vulnerable population in terms of air pollution exposure [84, 85] due to their higher inhalation rates resulting in larger specific doses than adults [86-89]. Therefore the long exposure time in schools (children spend from 175 to 220 days and from 5 to 8 hours at school [90] could significantly affect the overall dose received by students attending schools located near highly-trafficked urban roads. Indeed, high indoor particle concentrations may result from the significant outdoor-to-indoor infiltration of sub-micron particles (with indoor/outdoor ratios roughly varying in the 0.6-0.9 range), which depends on the levels of outdoor pollutants, physical barriers of the building, type of ventilation and particle physic-chemical properties and size [66, 91-103].
Since schools represent a crucial environment in terms of air quality assessment a number of studies have been carried out by the scientific community to measure and evaluate the Indoor Air Quality (IAQ) in schools [104, 105]. For many years, most of these papers proposed a simplified evaluation of the IAQ just considering the CO2
concentrations and thermal comfort as main parameters; nonetheless their negative effects can be merely restricted to students’ vigilance and cognitive performances [106-109]. Moreover, European standards, providing guidelines on ventilation rates, still adopt the CO2 concentration as main design parameter [110] since it is
unanimously considered as a good proxy of the IAQ [111, 112]. This approach is not adequate from a scientific point of view since the CO2 behavior (i.e. sources,
dynamics, removal) cannot be considered representative of all the different pollutants typically present in schools [113, 114]. Indeed, the IAQ in schools is influenced by several pollutants, including both gaseous species and airborne particles. Some of the gaseous pollutants are indoor-generated (e.g. radon, VOCs), thus, their behavior can be roughly treated as the CO2 one; whereas, other gases are outdoor-generated as they
are typically related to vehicular traffic (e.g. NO2) then penetrating the building
envelope on the basis of the airtightness and ventilation system of the buildings [91]. Particularly in the context of urban areas of developed countries, the different metrics of the airborne particles affect the school air quality in different manners: super-micron
CHAPTER 1. INTRODUCTION
22
particles (better described in terms of PM10, i.e. mass concentration of particles smaller
than 10 µm) can be treated as an indoor-generated pollutant due to the high emission indoor (e.g. resuspension phenomena), whereas sub-micron particles (better described in terms of PNC and BC concentrations) may be mostly driven by outdoor-generated pollutants as they represent the aerosol metrics characteristics of secondary atmospheric PM formation and tailpipe traffic emissions [113-115]. These pollutants, unlike CO2, can cause serious health effects such as respiratory and cardiovascular
problems as well as lung cancer [11, 31, 116-120], thus, their concentration should be monitored and reduced. As an example, outdoor-generated pollutants may results in high concentration in schools when they are located near to highly trafficked roads [83, 121] due to the high outdoor-to-indoor penetration. Such high exposures can lead to not negligible sub-micron particle doses received by the children in schools and, consequently, to risks and effects higher than acceptable levels [105].
The penetration of outdoor-generated pollutants is strongly affected by the ventilation system adopted in the schools. Indeed, schools worldwide are typically naturally-ventilated buildings, thus, on the basis of the perceived indoor air quality, people working in classrooms adopt random airing strategies that easily reduce the indoor-generated pollutants but lead to simultaneous increase of the outdoor-indoor-generated ones [115]. In order to guarantee a simultaneous reduction of all the pollutants (both produced indoors and outdoors) ventilation retrofit should be adopted by installing mechanical ventilation systems able, at the same time, to increase the air exchange rate of environment and to filter the fresh air [122]. Nonetheless, ventilation retrofit represents an expensive solution, therefore, it should be supported (on national basis) by the regulatory authorities through policies and incentives: to date, such incentives mainly supported energy saving solutions (e.g. renewable energy, building insulation), whereas the improvement of the air quality was less frequently adopted [123].
A possible easy-to-use solution to reduce pollutant concentrations in indoor environments is adopting air purifiers, i.e. systems made up of fans (or pumps) pulling the indoor air through a series of filters that remove airborne particles and gases and then circulating the purified air back into the indoor environment [124-130]. Air purifier can work according to different operating principles and present different
23
filtration methods, nonetheless, those characterized by the highest performances (able to trap sub-micron particles and UFP) include high-efficiency particulate air (HEPA) filters which permanently remove airborne particles from the sucked air. Several household appliance producers recently launched on the market their own air purifiers characterized by different filtration systems, flow rates, control strategies (e.g. remote control, sensor-based control, etc.), geometry, size, design. The producers typically characterize the effectiveness of their own purifiers through in-house tests carried out in ad-hoc test-chambers then providing rough indication regarding the maximum suggested floor area/volume of the micro-environment where the air purifier can be used. Even if the recommendations provided by the producers result approximate and inhomogeneous (for example the air purifier flow rate values spanning from about 1.5-fold to >10-1.5-fold the room volume to be purified), represent a key information since, to date, no standards are available to choose the characteristics of the air purifier to be installed as a function of the indoor micro-environment.
In order to reduce the level of urban air pollution, a common strategy is to encourage public to use sustainable public transport and also active transport such as cycling or walking. However, cyclists and pedestrians may be exposed to higher concentrations of air pollutants due to their proximity to vehicle emissions. Moreover, cyclists exhibit higher breathing rate (cyclist ≈40 L·min-1) compared to car drivers
(≈12 L·min-1) or bus passengers (≈13 L·min-1) [131], other study found a mean
(standard deviation) value of real-word breathing rate for cyclist equal to 59.1(13.7) L·min-1 and 46.2 (10.6) L·min-1 for man and woman respectively [132]. For this reason, the use of personal Respiratory Protectors (RP) is becoming more and more common in recent years. Respiratory protectors as face masks can be summarized in two macro categories, for occupational settings (professional face masks) and for non-occupational settings (commercial face masks). In many countries, in non-occupational settings, people have to use RP in order to safeguard their health. In addition, these professional facemasks have to meet national and international standards (e.g. EN 149:2001, EN 140:1998 in Europe). The use of RP in non-occupational setting is not supported by legal enforcement, so commercial face masks do not have to respect such
CHAPTER 1. INTRODUCTION
24
standards as professional ones but they reflect market laws following trends of fashion rather than human health.
2 O
BJECTIVES
The aims of this thesis are to evaluate the influence of the lifestyle on the exposure to ultrafine particles (by means a “direct exposure assessment approach”) and the estimation of daily doses in terms of particles SA received by people, taking into account different characteristics of the populations; as gender, age and origin. Moreover, based on the data of received dose and data on chemical characterization a risk assessment as a consequence of the exposure to airborne particles was obtained by means an excess lung cancer risk (ELCR) model for two crucial environments (i) school environment for children that are attending 5-years primary school, and (ii) in a common urban configuration usually called street canyons. Both environments represent a critical and crucial environment for different reasons; (i) school environments, as said above, for their vulnerable population (the children), and (ii) transport environments for their high concentrations of airborne particles which people could be exposed. In addition, an evaluation of the efficiency of some possible solutions to reduce the ELCR by means reducing the received dose of the people were taken into account. The solutions taken into account are (i) a personal protection by means personal RPs as facemasks, usually used in outdoor environments, and (ii) a collective protection by means air purifiers and/or ventilation strategies, usually applied in indoor environments.
To achieve the above-mentioned objectives, six experimental campaigns have been developed and performed in which the following aspects have been investigated and evaluated:
− The evaluation of the influence of the lifestyle in airborne exposure, characterizing and comparing the sub-micron particle daily dose, in terms of surface area received by the population living in five different cities in western countries;
26
− The evaluation of the air quality inside vehicles (VIAQ) mostly used to move through the city, taking into account parameter as BC, PM, PNC, LDSA, CO, CO2 and VOCs;
− Estimation of the lung cancer risk of people exposed to traffic-generated particles inside street canyon;
− Evaluation of IAQ and estimation of ELCR in different primary schools located in two European cities, Barcelona and Cassino;
− Evaluation of airborne particle exposure reduction by means personal RPs as facemasks in outdoor environments and ventilation strategies including air purifiers in indoor one.
3 T
HE INFLUENCE OF LIFESTYLE ON
AIRBORNE PARTICLE SURFACE AREA
DOSES RECEIVED BY DIFFERENT
W
ESTERN POPULATIONS
A better representativeness of the overall human exposure to sub-micron and ultrafine particles can be obtained through personal monitoring able to quantify the exposure in indoor micro-environments too. Such an approach is very demanding from a technical-economic point of view since a large sample (in terms of people involved in the experiments) is needed to represent the exposure of an entire population: indeed, the different lifestyles of the people result in exposures to different pollutant sources, in many different microenvironments (both outdoor and indoor), where they live, spend time or pass through during the day [133-135]. Thus, exposure data are essential to evaluate the dose of airborne particles received by population, but information on the type of activity is also needed to estimate the inhalation and consequent deposition of particles in the different regions of the lungs [136], as well as time activity pattern data (i.e. time spent in each microenvironments). As an example, in previous studies [137] the tracheobronchial and alveolar doses received by Italian and Australian populations were estimated on the basis of an “indirect exposure assessment approach”, i.e. characterizing the exposure to airborne particles through fixed monitors (not personal monitoring) placed in each microenvironments where people reside during the typical day [138], and evaluating the deposition fraction of such particles as a function of their size through the deposition model proposed by the International Commission on Radiological Protection [136]. That study demonstrated a significant difference between the two populations in terms of daily dose, highlighting the effect of both lifestyle and air quality of the local microenvironments.
CHAPTER 3. The influence of lifestyle on airborne particle surface area doses received by different Western populations
28
Previous studies opened up the question about the main parameters affecting the airborne particle doses received by the populations. They also pointed out to the need for further efforts to fill the gap in knowledge about the effect of lifestyle (e.g. culture) and geographical location (e.g. climate, outdoor concentration) in this respect.
To this end, the aim of the present study is to characterize and compare the sub-micron particle daily dose, in terms of surface area, received by population living in five different cities in Western countries: Barcelona (Spain), Cassino (Italy), Guilford (United Kingdom), Lund (Sweden) and Brisbane (Australia). These cities/populations were selected in order to highlight the possible effect of local pollution concentration and population lifestyles; indeed, some of these cities were previously characterized in term of background particle concentrations. The study was limited to non-smoking population (smoking population should be analyzed separately due to the large dose they typically receive, [139]) and non-industrial working environments.
The study was performed with a “direct exposure assessment approach” measuring the exposure to airborne particle concentrations through personal “portable” monitors capable of measuring the exposure at a personal scale [133, 140]. To this end, several volunteers were selected amongst the five populations to perform personal monitoring and obtain the exposure representative of the population living therein. Exposure data were combined in a Monte Carlo method along with statistics on time activity patterns of the citizens to obtain the statistically most probable dose received by such five populations.
3.1 Methodology
3.1.1 Study area
Measurements were carried out in Barcelona (Spain), Cassino (Italy), Guilford (United Kingdom), Lund (Sweden) and Brisbane (Australia). Barcelona (inhabitants: 1.6 million; city area: 101 km2), located on the northeast coast of the Iberian Peninsula (41°23′N 2°11′E), is characterized by a subtropical-Mediterranean climate with warm summers and mild winters. Climate and position contribute to typical low airborne particle concentrations [69, 141] in spite of its numerous pollutant sources, e.g. industrial activities, road transport lines, and high vehicle density (5800 cars/km2).
29
Cassino (inhabitants: 36000; city area: 83 km²) is located in Central Italy (41°29′30″N 13°50′00″E) in the Liri Valley. Climate and topography of the area contribute to frequent temperature inversion phenomena in winter resulting in high pollutant concentrations [60, 133]. Lund (inhabitants: 82000; city area: 26 km²) is situated in the southern part of Sweden (55°42′14″N 13°11′42″E) 15 km north from the coast of Baltic sea. Oceanic climate and typically low pollutant concentrations characterize the city [141, 142]. Guildford (inhabitants: 137000) is located in the Surrey County, 43 km southwest of London (51°14′N 0°34′W) and about 50 km north of the ocean (English Channel). The climate is classified as oceanic, and the pollutant concentrations in Surrey County area are generally low [141, 143]. Brisbane (inhabitants: 2.3 million; city area: 15826 km²), located 20 km west of the east coast of Australia (27°28′03.54″S 153°01′39.59″E), is the capital of the Australian State of Queensland. Its climate, classified as humid subtropical, and among other factors, the spread of the city and its low population density contribute to low pollutant concentrations in the city [137, 144]. In Table 1 information on meteoclimatic parameters during the experimental campaigns, obtained by the Meteorological Data Archives of the US National Weather Service's National Centers for Environmental Prediction (http://ready.arl.noaa.gov/archives.php), is reported for the five cities investigated. From the inspection of the data it can be concluded that a higher reduction of the exposure in outdoor environments (due to both ventilation and rain) is expected in Lund and Brisbane when compared to Cassino and Barcelona.
CHAPTER 3. The influence of lifestyle on airborne particle surface area doses received by different Western populations
30
Table 1 Data of the main meteoclimatic parameters during the experimental campaigns for the five
cities investigated, as reported by the US National Weather Service's National Centers for Environmental Prediction. Temperature, relative humidity, and wind speed data are reported as median values. City Barcelona (Spain) Cassino (Italy) Guilford (UK) Lund (Sweden) Brisbane (Australia)
Measurement period Oct-Dec
2015 Apr-June 2016 Aug-Nov 2016 Sept-Dec 2016 Jun-Aug 2016 Meteoclimatic parameters Temperature (°C) 18 17 17 10 27 Relative Humidity (%) 73 74 81 78 79 Wind speed (m/s) 7 8 7 18 8 Rainfall depth (mm) 127 111 83 272 284
Number of rainy days (-) 17 25 49 44 27
Information on climate and location of the cities investigated is of importance since they do affect the outdoor particle concentration levels and the resulting contribution to the population daily dose. Still, a great contribution to the daily dose is expected to be due to indoor microenvironments where significant particle sources [145-147] and low building ventilation [92, 115, 148] contribute to high exposures and doses in people living/residing therein [70].
3.1.2 Study design
In order to estimate the daily dose of sub-micron airborne particles, expressed in terms of particle surface area received by the populations living in the five cities under investigation, the following procedure was applied:
a) identification of the typical time activity pattern characteristic to citizens living in each of the five cities,
b) measurements of the concentrations of Lung Deposited particle Surface Area (LDSA) to which citizens are exposed in different microenvironments,
c) estimation of the daily dose received by the typical population living in the five cities through a Monte Carlo method capable of combining both time activity pattern and exposure data.
Once again, it was a direct method, which was applied here to evaluate the dose received by population, by performing measurements at a personal scale (“direct exposure assessment approach”).
31
3.1.2.1 Time activity pattern of the population
The typical time activity patterns characteristic to citizens living in the five cities were obtain from national human activity pattern surveys performed by National Statistics Institutes and/or research studies taking into account people living both in urban areas and country sites [149-154].
3.1.2.2 Measurement of the exposure to particle surface area concentration
In order to evaluate the most probable value of SA dose received by the populations considered in the present study, LDSA concentration levels (sum of alveolar- and tracheobronchial-deposited contributions) were measured during different experimental campaigns performed in the five cities, through personal monitors. The exposure to airborne particles in each microenvironment of the five cities was obtained by performing mobile measurements of particle number concentrations (PNC), average particle sizes and LDSA concentrations through direct measurements carried out with hand-held diffusion charger particle counters (a NanoTracer Philips and a DiscMini Testo). Exposure characterization was carried out in different periods summarized in Table 1: from October to December 2015 in Barcelona, from April to June 2016 in Cassino, from June to August 2016 in Brisbane, from August to November 2016 in Guilford, and from September to December 2016 in Lund.
The authors point out that, since a 1-year experimental campaign for each site would have been not workable for practical reasons, roughly three-four months for each site were considered: in particular, a period of the year representative of the average exposure was chosen for each site then avoiding extreme/critical meteorological situations likely leading to reduced ventilation of indoor environments or temperature inversion phenomena in outdoors. In order to obtain a significant amount of data for each microenvironment, 75 non-smoking volunteers (15 for each city) were selected. The volunteers, both males and females aged from 25 to 55 years old, lived and worked (non-industrial jobs) in the urban area of the city. 15 volunteers for each city were considered in order to have an adequate representativeness of the exposure level in each microenvironment/activity. As an example, different measurements in similar microenvironments allow to include effects of cooking practices (such as the type of
CHAPTER 3. The influence of lifestyle on airborne particle surface area doses received by different Western populations
32
food, cooking and stove [155-158]) and transport microenvironment (different transport modes, i.e. metro, train, car [69, 159]) on the exposure levels. Personal, belt-mounted particle counters were worn by the volunteers for 3 days, then each volunteer performed continuous measurements for 3 days. When volunteers were at home/office
(e.g. working, studying, sleeping, etc.) the instrument was left on a close desk. Moreover, the volunteers were asked to fill an activity diary to take note about place, time, and kind of activity in order to relate the particle exposure values to the activity and to the specific microenvironments.
On the basis of PNC and average particle size (Dp) measured through the Nanotracer
(and corrected by calibration factors, please see “Instrumentation and quality assurance” section), the alveolar- and tracheobronchial-deposited particle SA concentration (SAlv and STB, respectively) were calculated by means of the
semi-empirical correlation (1) for a reference worker (dosimetry model developed by the International Commission on Radiological Protection [136]) then allowing to determine the overall LDSA concentration:
𝑳𝑫𝑺𝑨 = 𝑺𝑨𝒍𝒗+ 𝑺𝑻𝑩= (𝟒. 𝟕 ∙ 𝟏𝟎−𝟓+ 𝟎. 𝟗𝟓 ∙ 𝟏𝟎−𝟓) ∙ 𝑷𝑵𝑪 ∙ 𝑫𝒑 (1)
As regards DiscMini measurements, the lung deposited surface area concentrations provided by the instrument was used since the accuracy of the DiscMini was recognized to be better for the lung deposited surface area than for PNC [160].
In order to obtain a statistical analysis of the concentration levels for each microenvironment a preliminary normality test (Shapiro-Wilk test) was performed to check the statistical distribution of data. Since the data did not meet a Gaussian distribution, a non-parametric test and a further post-hoc test (Kruskal-Wallis test; [161]) was considered in the analysis; further details are reported in Rizza, et al. [60].
3.1.2.3 Daily dose of the population
Doses of submicron particles were calculated on the basis of the data concerning the typical exposure to lung deposited particle surface area concentrations and time activity patterns. In particular, the total surface area dose (δSA) for each population was
obtained as reported in Buonanno, et al. [137]:
33
where IRactivity (m3 h-1) is the inhalation rate (which depends on age and activity [137]),
and Tj is time spent on each activity (as a function of the age and gender) reported in
the abovementioned statistical surveys for each population (please see “Time activity pattern of the population” section). The authors point out that the information on time activity patterns obtained from the activity diary were not used to calculate the dose since they were specific of the volunteers under investigation. Once again, time activity diary was just used to relate the particle exposure values to the microenvironments. The activities performed by the population, obtained on the basis of the typical time activity patterns, were grouped in seven main microenvironments as reported in Table 2 [137].
Table 2 Classification of the activities performed by the citizens in seven main microenvironments.
Microenvironment Activities
Transportation Trip and use of time not specified, round-trip to work
Working Non-industrial workplaces, Profitable work, Main and secondary job, Working-connected activities, Studying, School, Institute or
University, Voluntary job and meetings, Voluntary work in an organization
Eating Eating and drinking (including home and restaurant)
Cooking Cooking
Outdoor day Gardening and animal care, Construction and restoration, Sport and outdoor activities, Physical workout, Productive exercise, Sports-connected activities
Indoor day Personal care, Other personal care, Studying not specified, Studying in the free time, Activities for home and family not specified, Housework, Clothes care and folding, Purchasing goods and services, Home maintenance, Baby care, Helping adult family members, Helping other family members, Active Activities, Social Activities and entertainment, Social life, Entertainment and culture, Inactivity, Hobbies and computer science, Art and hobbies, Computing, Playing, Media, Reading, Watching TV, DVD or videos, Listening to the radio or recording
Indoor evening and night Sleeping
Data of particle concentrations and time activity pattern were combined through a Monte Carlo method to obtain the probability distribution function of the daily dose of each population then allowing to recognize the most probable daily dose. To this end, mean and standard deviation values of time spent in each activity were used for Italian, Spanish, Swedish and Australian people, whereas minimum and maximum values were considered for U.K. people (such range is due to the fact that both Irish
CHAPTER 3. The influence of lifestyle on airborne particle surface area doses received by different Western populations
34
and English time activity patterns were available). Moreover, since the of particle SA exposure data were not Gaussian, probability distribution function was calculated from the measured data, considering 10 equally-spaced concentration ranges. Finally, fixed values of inhalation rate, specific of each activity were applied [137]).
In order to compare the dose in different microenvironments, the dose intensity ratio, i.e. the ratio between the daily dose fraction and the daily time fraction characteristics of each activity, was also evaluated [133].
3.1.2.4 Instrumentation and quality assurance
PNC and average particle sizes were measured trough two diffusion charger particle counters:
i) an Aerasense NanoTracer XP (Oxility, partner of Royal Philips Electronics), which measures PNC and the average particle size in the range 10-300 nm, with 10 seconds sampling time when used in “Advanced Mode”. The NanoTracer was used in the experimental analyses performed in Barcelona, Lund and Brisbane. ii) a DiscMini (Testo) measuring PNC and the average particle size in the range
10-700 nm with 1 second sampling time. The DiscMini was used in the experimental analyses performed in Cassino and Guilford.
The operating principles of these instruments is based on the diffusion charging technique. In particular, the sampled aerosol is charged in a positive unipolar diffusion charger imparting an average known charge on the particles, that is approximately proportional to the particle diameter of the aerosol. The number of charges, and thus the number of particles, is then detected by an electrometer [162-164]. Since over 99% of total PNC in urban environments are contributed by the particles below 300 nm in diameter [165, 166], both instruments were able to measure total PNC despite their different upper sampling cut-off point for particle diameters.
3.1.2.5 Instrument intercomparison
The devices were calibrated before and after the experimental campaigns. To this end, both a CPC (model 3775, TSI Inc.) and SMPS system (model 3936, TSI Inc.) were used to compare the NanoTracer and DiscMini in terms of number concentration and particle size, respectively. The SMPS consisted of an Electrostatic Classifier (model
35
3080, TSI Inc.), a Differential Mobility Analyzer (model DMA3081, TSI Inc.) and a CPC 3775. The SMPS 3936 was used, with aerosol/sheath flow ratio of 0.3/3.0 L min
-1, thus measuring particle number distributions in the range 14-700 nm. Calibrations
were performed at the European Accredited Laboratory of Industrial Measurements (LaMI) of the University of Cassino and Southern Lazio (Italy) located in a 150 m3 room, with an ordinary mechanical ventilation system guaranteeing constant thermo-hygrometric conditions (20±2 °C and 50±5% RH). Moreover, the DiscMini was also compared in terms of LDSA concentrations to the SMPS through the methodology reported in [167]. Comparisons were performed for two different aerosols: aged indoor aerosol and fresh emitted aerosol produced by incense burning. Tests were performed during 2 h co-located measurements of the diffusion charger monitor (Nanotracer or DiscMini), CPC 3775 and SMPS 3936. To this end CPC sampling time was 1-s, while SMPS scans were 135-s. SMPS measurements were corrected for multiple charge and diffusion losses. The average correction factors in terms of PNC, obtained by averaging the two aerosols investigated before and after the experimental campaign, were applied as correction factors for the entire campaigns: correction factors equal to 1.08 and 1.03 in terms of PNC were estimated for NanoTracer and DiscMini, respectively, whereas a correction of 0.98 in terms of LDSA concentration was applied for DiscMini. Moreover, the CPC and SMPS were also calibrated in the European Accredited Laboratory at the University of Cassino and Southern Lazio by comparison with a TSI 3068B Aerosol Electrometer, using NaCl particles generated through a Submicrometer Aerosol Generator (TSI 3940) [168].
3.2 Results
3.2.1 Time activity pattern
In Table 3 data on time activity patterns of the populations under investigation, obtained from the national statistics institutes and/or research studies, as a function of the age, are reported. The data clearly demonstrate that, whatever the population and the gender, people spend the largest time fraction in indoors: from 88% for the Swedish population to 95% for Australian population. Cooking and eating, recognized as the most significant activities in terms of exposure [169], present jointly a contribution
CHAPTER 3. The influence of lifestyle on airborne particle surface area doses received by different Western populations
36
ranging from 13% to 26%. On average, the Swedish people spent less time than other population in cooking and eating activities, whereas Spanish citizens devote the highest time fraction to these activities. Apart from the Swedish population, the contribution of cooking and eating activities increases as a function of age. Cooking activities by themselves account for a maximum contribution equal to 6% with higher exposure time values for females than males. A further microenvironment recognized as critical in terms of people exposure [77, 170] is the transport, however the exposure time in such microenvironments is limited, since its daily time contribution range from <1% (Australian citizens older than 65) to about 6% (for Spanish people younger than 65). Whatever the age, the Australian population spends a smaller fraction of time in the transport microenvironment. Further, in general, the time spent in transport decreases as the age increases for all the populations under investigation. Sleeping and resting activities, as expected, account for a third of the day: in particular, time fraction averaged across all the age groups, ranges from roughly 30% (Italian and Australian) to roughly 37% (Spanish, UK and Swedish). ‘Other indoor day’ activities, averaged across all the age groups, account for about 30% of the time, except for the Australian population, which spends 45% of their day in such activities. Finally, ‘other outdoor’ activities, averaged across all the age groups, engage for about 4-8% of the day.