Rumen microbiome in dairy calves fed copper
and grape-pomace dietary supplementations:
Composition and predicted functional profile
Filippo BiscariniID1,2☯, Fiorentina Palazzo3☯, Federica Castellani3, Giulia Masetti2,4, Lisa Grotta3, Angelo Cichelli5, Giuseppe MartinoID3*1 Institute for Biology and Biotechnology in Agriculture (IBBA), CNR, Milano, Italy, 2 School of Medicine, Cardiff University, Cardiff, United Kingdom, 3 Faculty of Bioscience and Technology for Food, Agriculture and Environment, Universitàdi Teramo, Teramo, Italy, 4 Bioinformatics Unit, PTP Science Park, Lodi, Italy, 5 Department of Medical and Oral Sciences and Biotechnologies, Universitàdegli Studi “Gabriele d’Annunzio”, Chieti, Italy
☯These authors contributed equally to this work. *[email protected]
Abstract
The rumen microbiome is fundamental for the productivity and health of dairy cattle and diet is known to influence the rumen microbiota composition. In this study, grape-pomace, a nat-ural source of polyphenols, and copper sulfate were provided as feed supplementation in 15 Holstein-Friesian calves, including 5 controls. After 75 days of supplementation, genomic DNA was extracted from the rumen liquor and prepared for 16S rRNA-gene sequencing to characterize the composition of the rumen microbiota. From this, the rumen metagenome was predicted to obtain the associated gene functions and metabolic pathways in a cost-effective manner. Results showed that feed supplementations did alter the rumen micro-biome of calves. Copper and grape-pomace increased the diversity of the rumen microbiota: the Shannon’s and Fisher’s alpha indices were significantly different across groups (p-val-ues 0.045 and 0.039), and Bray-Curtis distances could separate grape-pomace calves from the other two groups. Differentially abundant taxa were identified: in particular, an uncultured
Bacteroidales UCG-001 genus and OTUs from genus Sarcina were the most differentially
abundant in pomace-supplemented calves compared to controls (p-values 0.003 and 0.0002, respectively). Enriched taxonomies such as Ruminiclostridium and Eubacterium sp., whose functions are related to degradation of the grape- pomace constituents (e.g. fla-vonoids or xyloglucan) have been described (p-values 0.027/0.028 and 0.040/0.022 in Pom-ace vs Copper and Controls, respectively). The most abundant predicted metagenomic genes belonged to the arginine and proline metabolism and the two- component (sensor/ responder) regulatory system, which were increased in the supplemented groups. Interest-ingly, the lipopolysaccharide biosynthetic pathway was decreased in the two supplemented groups, possibly as a result of antimicrobial effects. Methanogenic taxa also responded to the feed supplementation, and methane metabolism in the rumen was the second most dif-ferent pathway (up-regulated by feed supplementations) between experimental groups.
a1111111111 a1111111111 a1111111111 a1111111111 a1111111111 OPEN ACCESS
Citation: Biscarini F, Palazzo F, Castellani F, Masetti G, Grotta L, Cichelli A, et al. (2018) Rumen microbiome in dairy calves fed copper and grape-pomace dietary supplementations: Composition and predicted functional profile. PLoS ONE 13(11): e0205670.https://doi.org/10.1371/journal. pone.0205670
Editor: Juan J Loor, University of Illinois, UNITED STATES
Received: May 2, 2018 Accepted: September 29, 2018 Published: November 29, 2018
Copyright:© 2018 Biscarini et al. This is an open access article distributed under the terms of the Creative Commons Attribution License, which permits unrestricted use, distribution, and reproduction in any medium, provided the original author and source are credited.
Data Availability Statement: All data have been uploaded on the EBI repository (https://www.ebi. ac.uk/) for 16S rRNA-gene sequencing data: the study ID is study PRJEB28136 (ERP110307)". Funding: This work is part of the project VINCARN (“Miglioramento delle carni bovine, suine e avicole attraverso l’utilizzo di sottoprodotti della filiera enologica per fini mangimistici”) supported by a grant from the Rural Development Plan 2007 – 2013 – MISURA 1.2.4 - Regione Abruzzo – Italy
Introduction
The rumen microbiota is a preeminent microbial community in the gastrointestinal tract of ruminants. This finely regulated ecosystem is what makes it possible for ruminants to digest fibrous plant material (inedible for other livestock), use it as source of energy and other metab-olites, and transform it into high-quality food. In dairy cattle, the rumen microbiome plays a
key role in milk production [1], well-being and health of the animals [2,3]. The development
of culture-independent high-throughput next-generation sequencing techniques provids a
breakthrough in the characterization and analysis of microbiomes [4], with the rumen
micro-biome being no exception [5]. In particular, 16S rRNA gene sequencing [6] is a powerful
tech-nique to identify and quantify (in relative terms) the taxonomic composition of the rumen
microbial population [7]. From metataxonomics results, the associated metagenome and
related metabolic functions can be predicted, based on relative abundances and using a
data-base of microbial genes functional annotations [8,9]. The variability of the rumen microbiota
across animals and over time has been investigated in a number of studies e.g. [10–13]. The
diet is known to alter the composition of the rumen microbiota [14,15]. Specific feed
supple-ments have been the object of experimental trials on the rumen microbiome: these include
canola [16], probiotic bacteria [17], organic acids [18,19]. Mostly, feed supplementations had
the objective of counteracting the effects of the high-energy diets typical of dairy cows on the rumen pH, the composition of the rumen microbiota, and the health of the animals. Grape-pomace is the solid residue from grape processing for wine production. It has high content of
tannins and polyphenols e.g. [20,21], which are known to exert an antioxidant activity and
were previously shown to reduce rumen methane emissions in late-lactation dairy cows
milk-fat yield [22]. Coppers is an essential trace element in the diet of livestock, and was shown to
alter the gastrointestinal microbial composition of lactating cows [23]. It is therefore of interest
to further investigate the role of these two feed supplements on the rumen microbiome com-position and function.
In this study, we supplemented the daily ration of Holstein calves with either copper or grape-pomace. A metataxonomic approach was adopted, based on the sequencing of the 16S ribosomal RNA gene. The rumen microbiome of calves has been characterized, and differ-ences arising as a consequence of dietary supplementations (copper, pomace) explored. Fur-thermore, from the quantification of taxonomic relative abundances, the rumen metagenome has been reconstructed, and its functional profile predicted. In this paper, we adhered to the
terminology for microbiome research proposed by Marchesi and Ravel [24]: microbiota is the
collection of microorganisms in the rumen, metataxonomics their characterization through 16S rRNA gene sequencing, and microbiome is the combination of the microbiota, their genes, functions and surrounding habitat. This is the first work to specifically look at the effect of copper and grape-pomace feed supplementation on the rumen microbiota composition and function, and one of the few reports so far on predictive microbiome profiling in cattle. Grape-pomace is a byproduct of wine processing, and its use to feed livestock illustrates a potential application of circular economy to the agri-food industry.
Materials and methods
Animals and experimental treatments
The research work presented here was carried out within the framework of the project
VINCARN (“Miglioramento delle carni bovine, suine e avicole attraverso l’utilizzo di sottopro-dotti della filiera enologica per fini mangimistici”) approved by “Direzione Politiche Agricole e di Sviluppo Rurale” (Directorate of Agriculture) of Regione Abruzzo on 13/08/2014
DH26/40 (Project manager Prof. Giuseppe Martino). The authors are grateful to the company “Mario Maesa,” Casoli (CH), Italy, for the kind cooperation. The work of FB and G. Masetti was supported by the EU- FP7 project INDIGO, in the framework of People Marie Sklodowska-Curie Actions, Marie Curie Industry-Academia Partnerships and Pathways (grant agreement number: 612116).
Competing interests: The authors have declared that no competing interests exist.
(determination DH26/40, n. Prot. RA 218995). This research used animals and data from com-mercial farms which were handled following the national legislation on animal welfare (DL n. 126, 07/07/2011, EC Directive 2008/119/EC), and then slaughtered complying with the EU Regulation 1099/2009 on the protection of animals at the time of killing.
Fifteen Holstein-Friesian male calves were used in this study. All calves came from the same dairy herd in central Italy (Casoli, CH, Abruzzo), and were included in the experiment at the same time, when they were approximately 7 months old. The average starting weight of the
calves was 263± 21kg (259 ± 26, 268 ± 17 and 257 ± 21 in the control, grape-pomace and
cop-per groups respectively). Before the supplementation excop-periment, all calves received a standard basal diet, which consisted of mainly alfalfa haylage plus a custom-formulated concentrate
(detailed composition inS1 Table) that was offered to the animalsad libitum. From the
begin-ning of the experiment through its completion (75 days), calves received a standard finishing
diet (detailed composition inS2 Table) plus: i) nothing (control group); ii) a 10% DM (Dry
Matter) red grape-pomace supplementation (pomace-group); iii) 3g/100 L of copper supple-mentation as cupric sulphate in drinking water (copper-group). Details from the feedstuff
analysis of the custom-formulated concentrate and finishing diet are reported inS1andS2
Tables. The three groups had equal size, consisting of five calves each. After 75 days of dietary
supplementation, calves were slaughtered, at average age 259± 2 days (approximately 8.5
months) and average weight 345± 26 kg, 350 ± 22 kg and 332± 20 kg in the control, pomace
and copper groups. The rumen liquor was sampled upon slaughtering in the premises of the abattoir. Following Niu et al. (2016), 500 mL of rumen samples (consisting in a mixture of liq-uid and solid fractions) from the dorsal, central and ventral region of the rumen of each animal were collected, pooled and filtered through four layers of cheesecloth, and then collected in 50 mL tubes and stored at -20 Celsius degrees until DNA extraction. Rumen liquor was sampled within 60-90 minutes from slaughtering. The handling of the animals was carried out follow-ing EU and national legislation on animal welfare (EU directive 2008/119/EC; DL n. 126, 07/ 07/2011; EU Regulation 1099/2009).
DNA extraction and 16S rRNA-gene sequencing
Frozen rumen fluid samples were thawed at room temperature. Five ml of rumen fluid were
centrifuged at 15,000× g and the supernatant was removed. The DNA was extracted from
pel-lets as previously described [25]. Briefly, bacterial cells were lysed by bead-beating in the
pres-ence of 4% (w/v) sodium dodecyl sulfate (SDS), 500 mMNaCl, and 50 mMEDTA. Impurities
were removed by precipitation with ammonium acetate, and the nucleic acids were recovered by precipitation with isopropanol. Metagenomic DNA was then purified via sequential diges-tions with RNase and proteinase K, followed by the use of QIAamp DNA Stool MiniKit col-umns (Qiagen). The integrity and the concentration of gDNA were verified using a 2200 TapeStation Genomic Screen Tape device (Agilent, Santa Clara, CA, USA) and Qubit (Life Technologies). Libraries for metataxonomics were prepared according to the Illumina 16S-metagenomic library-prep-guide using v3 Reagents kit and the NexteraXT indices kit (Illu-mina, San Diego). Briefly, genomic DNA was normalized to 5 ng/μL, and 2.5 μL were used for
library preparation using primers for the V3-V4 regions of the 16S rRNA-gene [6]. Libraries
size and quality were evaluated with the Agilent TapeStation 2200 and quantified on Qubit
(Life Technologies), and were diluted to 10 pMin hybridization buffer (HT1) for the cluster
generation on the Miseq. In order to reduce unbalanced and biased base compositions, 10% of PhiX control library was spiked into the amplicon pool. Libraries were sequenced on the Miseq using a 2x300 paired-end sequencing module (Illumina, San Diego). Sequencing was
Bioinformatics processing
Demultiplexed paired-end reads from 16S rRNA-gene sequencing were first checked for
qual-ity using FastQC [26] for an initial assessment. Forward and reverse paired-end reads were
joined into single reads using the C++ program SeqPrep [27]. After joining, reads were filtered
for quality based on: i) maximum three consecutive low-quality base calls (Phred < 19) allowed; ii) fraction of consecutive high-quality base calls (Phred > 19) in a read over total read length � 0.75; iii) no “N”-labeled bases (missing/uncalled) allowed. Reads that did not match all the above criteria were filtered out. All remaining reads were combined in a single FASTA file for the identification and quantification of OTUs (operational taxonomic units). Reads were aligned against the SILVA closed reference sequence collection release 123, with 97%
clus-ter identity [28,29], applying the Cd-hit clustering algorithm [30]. A pre-defined taxonomy
map of reference sequences to taxonomies was then used for taxonomic identification along the main taxa ranks down to the genus level (domain, phylum, class, order, family, genus). By counting the abundance of each OTU, the OTU table was created and then grouped at each phylogenetic level. OTUs with total counts lower than 15 in fewer than 2 samples were filtered out. All of the above steps, except the FastQC reads quality check, were performed with the
QIIME open-source bioinformatics pipeline for microbiome analysis [31]. The command lines
and parameters used to process 16S rRNA-gene sequence data are detailed inS1 Appendix.
Alpha and beta diversity indices
The rumen microbial diversity was assessed within- (alpha diversity) and across- (beta diver-sity) samples. All indices (alpha and beta diverdiver-sity) were estimated from the complete OTU table (at the OTU level), filtered for OTUs with more than 15 total counts distributed in at least two samples. Besides the number of observed OTUs directly counted from the OTU table, within-sample microbial richness, diversity and evenness were estimated using the fol-lowing indices: Chao1 and ACE (Abundance-based coverage Estimator) for richness,
Shan-non, Simpson and Fisher’s alpha for diversity [32–37], Simpson E and Pielou’s J (Shannon’s
evenness) for evenness [38]. The across-sample rumen microbiota diversity was quantified by
calculating Bray-Curtis dissimilarities [39]. Prior to the calculation of the Bray-Curtis
dissimi-larities, OTU counts were normalized for uneven sequencing depth by cumulative sum scaling
(CSS, [40]. Among groups (copper, grape-pomace, control) and pairwise Bray-Curtis
dissimi-larities were evaluated non-parametrically using the permutational analysis of variance
approach (999 permutations; [41]). Details on the calculation of the mentioned alpha- and
beta-diversity indices are reported inS2 Appendix.
Metagenome prediction and functional profiling
From the taxonomic composition of the rumen microbiota it is possible to predict its functional profile, using a database of precomputed reference genomic profiles. An approach based on nearest neighbor identification with a minimum sequence similarity was used to link 16S
rRNA-gene sequences and functional annotations of prokaryotic genomes [8], as implemented in the
Tax4FunR package [42] coupled with the SILVA reference sequence collection. From the
pre-dicted metagenome gene ontologies and metabolic pathways were obtained based on the Kyoto
Encylopedia of Genes and Genomes (KEGG) reference database of genome annotations [43].
Software
Reads from 16S rRNA-gene sequencing were processed with the QIIME pipeline [31], used
estimated using ownPython (https://github.com/filippob/Rare-OTUs-ACE.git) andR (https:// github.com/filippob/sampleBasedRarefaction) scripts. The prediction of the metagenome from metataxonomy and the functional profiling of the rumen microbiome were carried out
using the Tax4FunR package [42]. Plots were generated using the ggplot2R package [44].
Additional data handling was performed with the R environment for statistical computing
[45].
Results
Sequencing metrics, rarefaction and taxonomy description
Sequencing the V3-V4 regions of the bacterial 16S rRNA gene produced a total of 8 393 698 reads (joined R1-R2 paired-end reads). After quality filtering, 2 772 892 sequences were removed, leaving 5 620 806 sequences for subsequent analyses (67% average retention rate,
maximum 70%, minimum 60%).S3 Tablereports reports the number of sequences before and
after quality filtering using two quality thresholds: Phred > 3 (the default in the Qiime pipe-line) and Phred > 19 (the threshold recommended by the Qiime manual and that was used in this work). A major difference in the number of sequences removed based on the quality score can be seen: 187 174 vs 2 772 892. However, the number of sequences retained after OTU pick-ing (and successive filter on number of counts) is rather similar (4 141 362 vs 4 058 283): this indicates the robustness of the closed-reference OTU picking approach. On average, there were 475 652 (±236 180) sequences per sample in the control group, 339 125 (±169 147) in the copper-receiving group and 309383 (±159 021) in the pomace group. The initial number of OTUs identified was 13 257; after pruning out OTUs with less than 15 counts in at least 2 sam-ples, 3 691 distinct OTUs were left. To check whether sequencing depth and sample size were adequate to characterize the composition of the rumen microbiota, sequence-based and sam-ple-based rarefaction curves were generated from the OTU table before pruning (13257
OTUs). Sequence-based rarefaction curves were obtained from the QIIME pipeline [31]; the
sample-based rarefaction curve was produced with ad hoc R functions (see:https://github.
com/filippob/sampleBasedRarefaction). The observed number of OTUs detected was plotted as a function of the number of reads (up to 100 000) in each sample, and of the number of
sam-ples (Fig 1). Both curves tend to plateau asymptotically towards a maximum, indicating that
sequencing depth and the number of samples were adequate to characterize the rumen micro-biota in the present study. Deeper sequencing or the addition of any other samples would likely not increase significantly the number of new OTUs potentially discovered.
OTUs were grouped taxonomically from the phylum to genus level (phylum, class, order, family, genus). The 3691 OTUs with more than 15 counts across samples clustered into 19
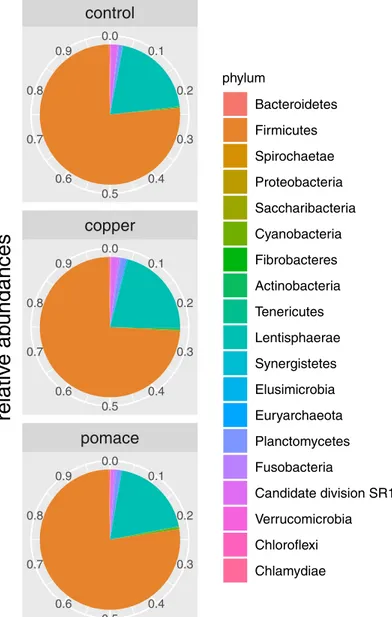
phyla, 39 classes, 60 orders, 94 families and 302 genera (seeTable 1). The Bacteroidetes and
Firmicutes phyla were the most abundant, representing respectively 75.7% (76.2%, 73.8%, 77.1%) and 20.0% (19.9%, 20.9%, 19.1%) of the total rumen microbiota (between brackets the proportions in the control, copper and grape-pomace groups). They were followed, at large
distance, bySpirochaetes (1.27%: 1.50%/1.59%/0.73%), Proteobacteria (1.14%: 0.89%/1.39%/
1.12%) and the phylum Saccharibacteria (0.42%: 0.23%/0.51%/0.52%). At deeper taxonomic levels, the rumen microbiota seemed to be dominated by few taxa: the orders Bacteroidales (75.3%: 75.9%/73.3%/76.7%) and Clostridiales (15.9%: 16.7%/15.9%/15.3%), the families Pre-votellaceae (43.4%: 44.6%/39.8%/45.8%) and Rikenellaceae (14.4%: 9.45%/15.4%/18.4%), the genera Prevotella (44.6%: 44.6%/39.8%/45.8%) and Rikenellaceae RC9 gut group (13.7%:
8.90%/14.5%/17.6%).Fig 2shows the pie chart of relative abundances of phyla in the three
groups. Differences between groups in their rumen taxonomic composition (based on
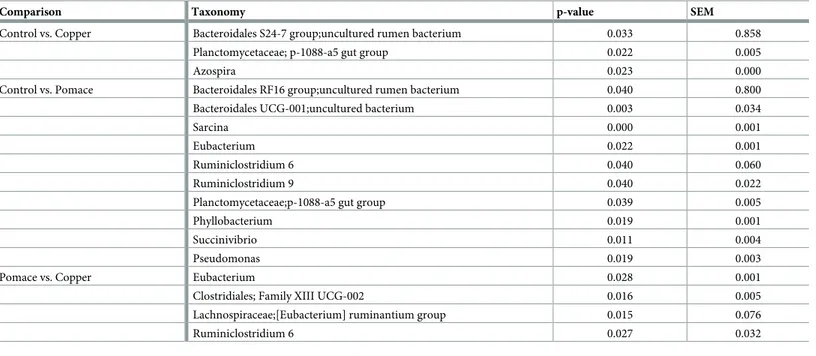
with differences between groups in terms of relative abundances). Copper supplementation resulted in three differentially abundant taxa compared to controls, which comprised counts
of theBacteroidales S24-7 group (p-value = 0.03), Planctomycetaceae p-1088-a5 gut group
(p-value = 0.022) andAzospira (p-value = 0.023). Out of ten genera differentially abundant,
counts ofBacteroidales UCG-001 uncultured bacterium (p-value = 0.003) and of Sarcina
(p-value = 0.000) were the most differentially abundant in the grape-pomace supplemented rumen compared to controls. Both supplementations shown a difference in the abundance of thePlanctomycetaceae p-1088-a5 gut group counts compared to controls (p-value = 0.022 and
Fig 1. Rarefaction curves. Sequence-based (left) and sample-based (right) rarefaction curves for the sampled rumen microbiotas. Number of detected OTUs on the y-axis; number of sequences (left) and of samples (right) on the x-axis.
https://doi.org/10.1371/journal.pone.0205670.g001
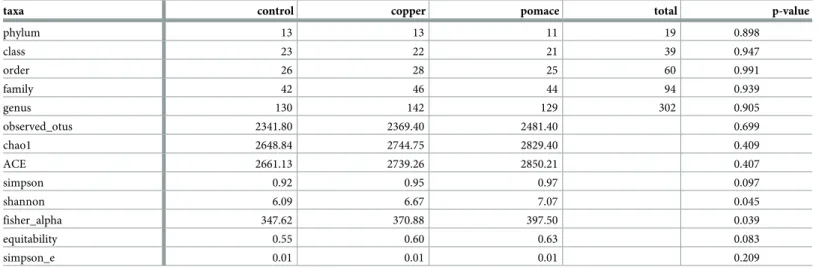
Table 1. Summary of identified taxonomies and estimated alpha diversity indices in the rumen microbiota of dairy calves from three experimental groups. P-values for among-group differences from analysis of variance.
taxa control copper pomace total p-value
phylum 13 13 11 19 0.898 class 23 22 21 39 0.947 order 26 28 25 60 0.991 family 42 46 44 94 0.939 genus 130 142 129 302 0.905 observed_otus 2341.80 2369.40 2481.40 0.699 chao1 2648.84 2744.75 2829.40 0.409 ACE 2661.13 2739.26 2850.21 0.407 simpson 0.92 0.95 0.97 0.097 shannon 6.09 6.67 7.07 0.045 fisher_alpha 347.62 370.88 397.50 0.039 equitability 0.55 0.60 0.63 0.083 simpson_e 0.01 0.01 0.01 0.209
Results based on the 3691 distinct OTUs retrieved from the SILVA reference database release 123. ACE: Abundance-based Coverage Estimator; Equitability: Shannon evenness; Simpson_e: Simpson evenness.�: p-values < 0.1 and��: p-values < 0.05.
p-value = 0.039, respectively). Four genera, all belonging to the phylum Firmicutes, were dif-ferentially abundant between grape-pomace and copper supplementations.
Diversity indices
The estimated alpha diversity indices for describing the richness, diversity and evenness of the
rumen microbiota in the three experimental groups are reported inTable 1. The richness
esti-mators Chao1 and ACE did not show differences among groups, as well as the average number of observed OTUs, and the evenness estimator Simpson_e. A mildly significant difference was observed in the equitability index as a measure of evenness of the microbial communities (p-value < 0.10). On the contrary, the diversity indices Shannon (p-(p-value < 0.05) and Fisher’s
alpha (p − value < 0.05) showed a significant difference among groups. The rumen microbiota
of grape pomace-fed calves had higher diversity compared to copper-fed calves (intermediate
Fig 2. Relative abundances. Pie-chart of relative abundances for the phyla identified in the 15 calves rumen samples, grouped by dietary supplementation.
Table 2. Comparison of CSS-normalized OTU counts among groups, at the genus taxonomic level.
Comparison Taxonomy p-value SEM
Control vs. Copper Bacteroidales S24-7 group;uncultured rumen bacterium 0.033 0.858
Planctomycetaceae; p-1088-a5 gut group 0.022 0.005
Azospira 0.023 0.000
Control vs. Pomace Bacteroidales RF16 group;uncultured rumen bacterium 0.040 0.800
Bacteroidales UCG-001;uncultured bacterium 0.003 0.034
Sarcina 0.000 0.001
Eubacterium 0.022 0.001
Ruminiclostridium 6 0.040 0.060
Ruminiclostridium 9 0.040 0.022
Planctomycetaceae;p-1088-a5 gut group 0.039 0.005
Phyllobacterium 0.019 0.001
Succinivibrio 0.011 0.004
Pseudomonas 0.019 0.003
Pomace vs. Copper Eubacterium 0.028 0.001
Clostridiales; Family XIII UCG-002 0.016 0.005
Lachnospiraceae;[Eubacterium] ruminantium group 0.015 0.076
Ruminiclostridium 6 0.027 0.032
CSS: cumulative sum-scaling; SEM: standard error of the mean
ffiffiffiffiffiffiffiffiffiffiffiffiffi s2 1 n1þ s2 2 n2 q � � https://doi.org/10.1371/journal.pone.0205670.t002
Fig 3. Bar-chart of the 14 genera with significant differential abundance in pairwise comparisons. Genera relative abundances in each group –control, copper, pomace– are reported, and the complete taxonomy of each genus is described.
alpha diversity) and controls. The Bray-Curtis dissimilarity index was estimated from OTU counts to measure diversity across samples (beta diversity). The first two dimensions from the
non-metric multidimensional scaling of the Bray-Curtis dissimilarity matrix (Fig 4) reveals a
slightly significant different distance between the three groups (p-value = 0.053, from 999 per-mutations of the analysis of variance). In particular, a significant difference of the ruminal bac-terial communities organization has been observed between supplementations (p-value = 0.035), but not between each supplementations and control (p-value > 0.05).
Predictive functional profiling of the rumen microbiota
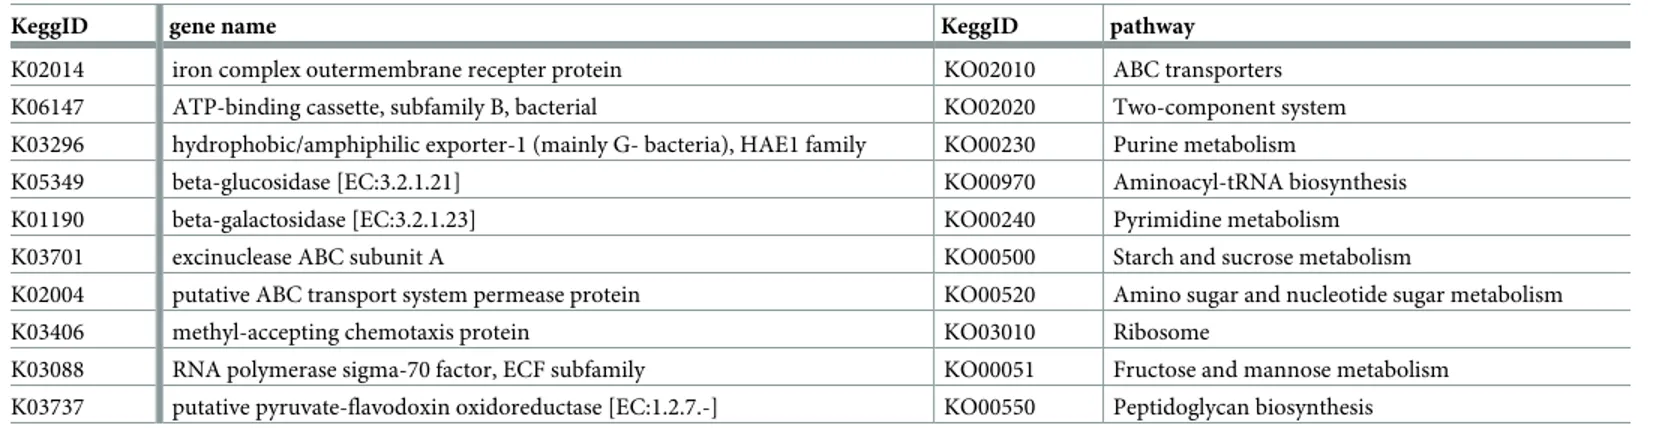
From the predicted metagenome, 6449 ortholog genes, involved in 280 metabolic pathways were retrieved. The most abundant genes were the iron-complex outer-membrane receptor protein, the bacterial ATP-binding cassette (ABC transporter), and the
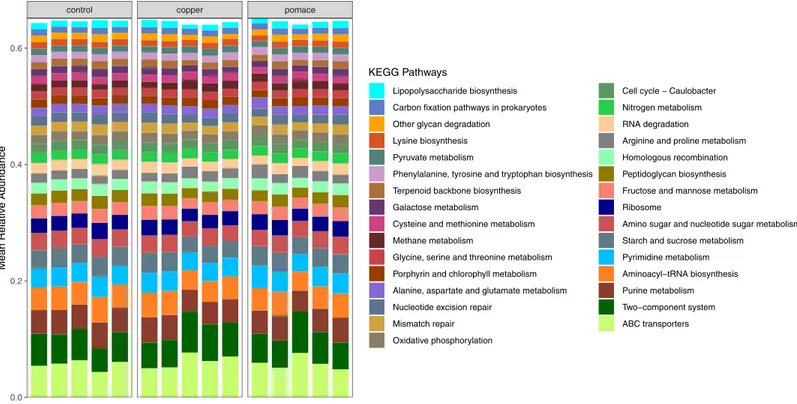
hydrophobic/amphi-philic exporter-1 (Table 3).Fig 5reports the most represented (average relative abundance
>1% across samples) metabolic pathways for each calf; pathways are ordered by decreasing
relative abundance (from bottom to top). The top three pathways include ABC transporters (across-membrane cellular transportation of substrates), the two-component (sensor/
responder) regulatory system, and purine metabolism. For each metabolic pathway and ortho-log gene, the coefficient of variation of relative abundance across groups (control, copper,
Fig 4. First two dimensions from the (non-metric) multi-dimensional scaling of the Bray-Curtis dissimilarity matrix. Samples were grouped by experimental unit. PERMANOVA amongst all groups p = 0.053 (using 999 permutations); pairwise PERMANOVA: copper-pomace p = 0.035; copper-control and pomace-control p-value > 0.05.
https://doi.org/10.1371/journal.pone.0205670.g004
Table 3. Top 10 (most abundant) genes and pathways from metagenome prediction in the 15 calves samples.
KeggID gene name KeggID pathway
K02014 iron complex outermembrane recepter protein KO02010 ABC transporters K06147 ATP-binding cassette, subfamily B, bacterial KO02020 Two-component system K03296 hydrophobic/amphiphilic exporter-1 (mainly G- bacteria), HAE1 family KO00230 Purine metabolism
K05349 beta-glucosidase [EC:3.2.1.21] KO00970 Aminoacyl-tRNA biosynthesis
K01190 beta-galactosidase [EC:3.2.1.23] KO00240 Pyrimidine metabolism
K03701 excinuclease ABC subunit A KO00500 Starch and sucrose metabolism
K02004 putative ABC transport system permease protein KO00520 Amino sugar and nucleotide sugar metabolism
K03406 methyl-accepting chemotaxis protein KO03010 Ribosome
K03088 RNA polymerase sigma-70 factor, ECF subfamily KO00051 Fructose and mannose metabolism K03737 putative pyruvate-flavodoxin oxidoreductase [EC:1.2.7.-] KO00550 Peptidoglycan biosynthesis https://doi.org/10.1371/journal.pone.0205670.t003
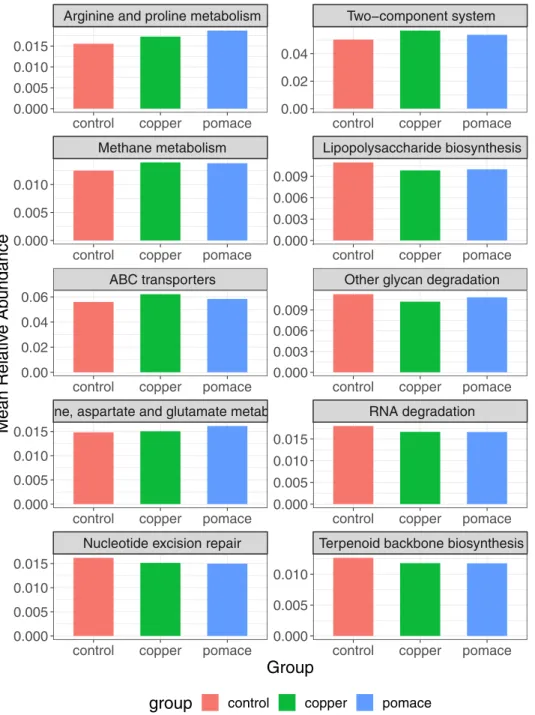
pomace) was calculated. The metabolic pathways and genes with the largest (top 10) and
small-est (bottom 10) variation among groups are listed inFig 6: the most variable genes and
path-ways include, respectively: the methyl-accepting chemotaxis protein, the putative ABC transport system permease protein and the dipeptidyl-peptidase 4; arginine and proline metabolism, the two-component (sensor/responder) regulatory system, and methane metabolism.
Discussion
The characterization of the rumen microbiota and its functional profile from 15 calves fed different dietary supplementations has been presented here. The sequencing of the V3-V4 vari-able regions of the rRNA gene (16S subunit) appeared to be adequate as shown by the
asymp-totic plateauing of both sequence- and sample-based rarefaction curves (Fig 1). The sensitivity
analysis of sequence quality filtering (comparisons of Phred quality score thresholds: Phred > 3 vs Phred > 19) indicated an overall robustness of results from the closed-reference OTU picking approach; however, a stricter quality filtering (Phred > 19) is likely to remove most poor quality sequences and, consequently, most spurious OTUs.
Overall, the prevailing bacterial phyla were Bacteroidetes and Firmicutes, distantly followed by Spirochaetes and Proteobacteria: this is a common finding from the cattle rumen
micro-biota as reviewed by Morgavi et al. [2] and reported in more recent research results [19,46]; it
is also in line with the age development of rumen microbial communities in calves, which fea-ture decreasing Proteobacteria and simultaneously increasing Bacteroidetes and Firmicutes
from birth to weaning [11]. The most abundant genera,Prevotella spp and Rikenellaceae RC9
gut group spp varied substantially across samples (coefficient of variation 40.5% and 96.6%
Fig 5. KEGG metabolic pathways identified from the predicted metagenome for each sample (calf). Only pathways with average relative abundance > 1% across samples were included.
respectively), though no significant difference between groups were observed (p-value > 0.60 in both cases).
Effect of feed supplementation
The main objective of the experiment was to investigate differences in the rumen microbiota arising as a consequence of different dietary supplementations: the addition of either the mineral micro-element copper or grape-pomace to the feed ration was compared to unsupple-mented control animals. Previous works have looked at the effect of different feed
supplemen-tations on the rumen microbiome in dairy cattle. Golder et al. [16] found that the addition of
canola meal to the ration clearly differentiated the rumen microbiota from that of control
ani-mals. De Nardi et al. [19] found higher microbial richness and diversity (Fisher’s alpha index)
when supplementing the ration with dicarboxylic acids or polyphenols. In goats, rhubarb (Rheum officinale) root meal supplementation was reported to increase the richness of the
rumen microbiota (Chao1 index, [47]). Here, we found that microbial richness in the rumen
was barely affected by supplementations (slightly more richness with grape-pomace, no effect of copper); on the other hand, microbial diversity (Shannon and Fisher’s alpha indices) clearly increased with copper and, mainly, grape-pomace supplementation. Between-sample distances based on the rumen microbiota composition revealed that the grape-pomace group appeared to be relatively clearly separated from the control and copper groups, which conversely over-lapped substantially. Moate and collaborators reported a rumen microbiota shift in dried
Fig 6. Differential ortholog genes and metabolic pathways. Most (top, red) and least (bottom, blue) different (measured as across-group coefficient of variation) ortholog genes (left) and metabolic pathways (right) among the three experimental groups.
grape marc or ensiled grape marc supplemented cows compared to control diet, with no
differ-ences reported between the type of supplementation [22]. However, they did not report
taxo-nomic differences from such supplementations trial, as they used the terminal restriction fragment (T-RF) length polymorphism for characterizing bacterial and archaeal (amongst
other) community structures [48].
When looking at specific taxa (Table 1), unclassified genera from theBacteroidales S24-7
andRF16 groups were enriched in the microbiota of copper and grape-pomace supplemented
calves, respectively. De Nardi et al. [19] found an enrichment of the order Bacteroidales in the
rumen of polyphenol-supplemented dairy heifers. Recently, Popova and colleagues [49]
observed a reduction in unclassifiedBacteroidales S24-7 genera in the rumen of young
Charo-lais bulls receiving a linseed plus nitrate supplementation. OTUs from genus
Ruminiclostri-dium 6 and Eubacterium were more abundant in the rumen of grape-pomace supplemented
calves compared to copper supplementation and controls.Ruminiclostridium cellulyticum has
the ability to degrade branched plant polysaccharide such as xyloglucan [50], which actually is
present in the grape-pomace cell wall [51]. Resulting oligosaccharides were shown to be
imported in the cytoplasm through the ATP-binding cassette (ABC) transporter, to be further
sequentially degraded into a final product of glucose and glucose-1-phosphate [50].
Eubacte-rium sp. Were shown to degrade flavonoids in human and rat feces [52]. Kasparkova et al. [53] reported a negative correlation between ruminal Eubacteriaceae counts and levels of the isofla-vone-extract daidzein, following the administration of isoflavone-rich feed in lactating cows.
The Firmicutes:Bacteroidetes ratio in the gut microbiota is known to play a role in
adipo-genesis: Jami et al [1] observed a strong positive correlation between this ratio and milk-fat
yield. In studies on obesity in mice and humans, it has been related to higher blood and tissue
fat [54,55]. The role of adipogenesis in the autoimmune Graves’ orbitopathy has been
estab-lished [56], and the relationship between the gut microbiome and fat metabolism in this
dis-ease is object of current research (EU “Indigo” project:www.indigo-iapp.eu/). In the present
study, the Firmicutes to Bacteroidetes ratio was 0.28 in controls, 0.31 in copper-supplemented calves, and 0.25 in grape-pomace-supplemented calves. The difference is small, but appears to point to a possible reduction in the ratio between Firmicutes and Bacteroidetes induced by the supplementation with grape-pomace.
From the metagenome prediction, the majority of genes belonged to membrane transport, carbohydrate metabolism and replication and repair functions. Similar results were obtained
from a previous report on the functional analysis of the rumen microbiota in dairy cattle [46].
Across experimental groups, the most differentially abundant genes and pathways -with a coef-ficient of variation � 9% were: the methyl-accepting chemotaxis protein involved in bacterial motility; the enzyme dipeptidyl-peptidase 4 involved in protein digestion and absorption; the ABC membrane transport system permease protein, member of a superfamily of transmem-brane proteins present in all extant phyla, from prokaryotes to mammals; and the arginine and proline metabolism (higher in the grape-pomace group, followed by the copper and control
groups, seeFig 7). The two-component system -a signal transduction systems that enables
bac-teria to sense, respond, and adapt to changes in their environment- was more abundant in the copper-supplemented group. Interestingly, the long-chain acyl-CoA synthetase gene, which plays a role in the lipid metabolism, and the lipopolysaccharide biosynthesis metabolic path-way were found to be under-represented in the copper and grape-pomace groups: this finding is consistent with the lower Firmicutes:Bacteroidetes ratio, and may contribute to explain why the latter is associated with the down-regulation of the fat metabolism. Additionally, a reduc-tion in the lipopolysaccharide (LPS) biosynthetic pathway may be related to a reduced growth
of possible pathogenic bacteria for humans (e.g.Salmonella, Escherichia coli), as a consequence
reduction in Enterobacteriaceae (includingSalmonella, Shigella, E.coli) after grape-pomace
supplementation has been described in lamb fecal samples [57].
Overall, grape-pomace supplementation appeared to induce a larger effect than copper sup-plementation on the rumen microbiome, in terms of both alpha- and beta-diversity indices, number of differentially abundant taxa, and functional profile.
Methods for functional profiling of the microbiome
The possibility of predicting the metagenome and associated functional annotations from 16S rRNA gene sequencing data is a major breakthrough in the analysis of microbial
Fig 7. Most variable metabolic pathways among experimental groups. Relative abundances on the y-axis.
communities. Deep shotgun metagenomics sequencing is the current golden standard to
pre-cisely characterize communities’ metagenomes [58], especially to detect rare organisms and
genes; however, this approach is often prohibitively expensive, and sometimes challenging to analyse: therefore, metagenome prediction offer a valid cost-effective alternative for the
func-tional profiling of microbiotas. Aßhauer and Meinicke [8] proposed a method to predict
functional profiles from 16S rRNA data, and implemented it into the R package “Tax4Fun”
[42]. This method and its implementation are based on the SILVA rRNA reference database
[28]. In parallel, an alternative method -named PICRUSt (Phylogenetic Investigation of
Communities by Reconstruction of Unobserved States)- for the predictive functional profil-ing of microbial communities from 16S rRNA marker gene data has been developed and
implemented in a Python package [9]. PICRUSt is based on the Greengenes 16S rRNA
sequence database [59].
Such a technique has been recently applied also in the description of the functional role of
the rumen and cecal microbiota of Charolais bulls, which were found to be highly similar [49].
In this work, the approach based on Tax4Fun and SILVA was used to predict the metagenome from metataxonomy, and results have been presented. Alongside, data were re-analysed also using PICRUSt plus the Greengenes database, and results from the two pipelines were com-pared. From the Tax4Fun-SILVA pipeline 6449 unique KEGG items (ortholog genes and path-ways) were retrieved; from PiCrust-Greengenes the number of retrieved unique items was 6909. Across the two sets of results, 5983 items were in common (92.8% relative to the Tax4-Fun-SILVA pipeline), indicating that the two approaches yielded very similar results. This gives robustness to the presented functional profiles of the rumen microbiota in calves, and contributes to increase confidence in the gene functional analysis based on metagenome prediction.
Methanogenic taxa
Dietary treatments are known to exert an effect on rumen methane production and to alter the
composition of the rumen microbiota (see Negussie et al. [60] for a review—S1 Table). Many
methanogens are known to belong to the Archaea domain [61]. We found a small proportion
of Archaeal taxonomies described from the V3-V4 primers, and calculated the Pearson corre-lation between rumen bacteria and Archaea counts in the three experimental groups. This correlation was positive in the control (0.648) and copper (0.672) groups (the more the bacte-ria, the more the archaea), but negative in the grape-pomace group (-0.231: the larger the bac-teria counts, the fewer the archaea). Specific methanogenic taxa (taken from a review by Tapio
et al. [62]) like those belonging to the phylum Euryarchaeota, which included methanogens
genera such asMethanomicrococcus and Methanosphaera, have been identified and quantified
(Table 4). Results were somewhat ambiguous: although the minimum count was mostly observed in the grape-pomace (11 out of 18 times) and, secondarily, the copper (9 out of 18 times) groups, sometimes the control group had the minimum methanogens counts (3 out 18 times). It should be emphasized, though, that Archaea were scarcely represented in the sequenced reads, accounting for only 64 out of the 13258 detected OTUs, and we resorted to the unfiltered OTU table to present these results; this was probably due to the choice of the V3-V4 primers used, not specifically designed to target Archaea. In no case was the difference among groups statistically significant. Methane metabolism was the second most different metabolic pathway across experimental groups (coefficient of variation * 6%): this pathway was overrepresented in the grape-pomace and copper groups, relative to controls. Summariz-ing, feed supplementations, especially grape-pomace, appear to have an influence on
Table 4. Counts of methanogen ic taxa in the gut microb iota: Compar ison between experimen tal groups. domain phylum class order family genus species control rame vinacce tot p-value Archaea Euryarchaeota Methanobacteri a Methanobacteri ales Methanobacteriaceae Methanobrevibacter uncultured archaeon 183 53 263 499 0.00 Archaea Euryarchaeota Methanobacteri a Methanobacteri ales Methanobacteriaceae Methanobrevibacter uncultured Methanobrevibacter sp. 73 10 36 119 0.27 Archaea Euryarchaeota Methanobacteri a Methanobacteri ales Methanobacteriaceae Methanobrevibacter uncultured methanogenic archaeon 1 3 4 8 0.36 Archaea Euryarchaeota Methanobacteri a Methanobacteri ales Methanobacteriaceae Methanobrevibacter uncultured rumen methanogen 35 58 9 102 0.15 Archaea Euryarchaeota Methanobacteri a Methanobacteri ales Methanobacteriaceae Methanosphaera uncultured archaeon 8 5 0 13 0.44 Archaea Euryarchaeota Methanomicrobi a Methanosarci nales Methanosaetaceae Methanosaeta uncultured archaeon 2 1 0 3 0.36 Archaea Euryarchaeota Methanomicrobi a Methanosarci nales Methanosarcinaceae Methanimicrococcus unidentified methanogen ARC45 0 2 0 2 0.40 Archaea Euryarchaeota Thermoplasmata Thermoplasm atales Thermoplasmatales Incertae Sedis Candidatus Methanomethylophilu s Methanoculleus sp. CAG:1088 2 0 0 2 0.40 Archaea Euryarchaeota Thermoplasmata Thermoplasm atales Thermoplasmatales Incertae Sedis Candidatus Methanomethylophilu s uncultured archaeon 4 0 1 5 0.14 Archaea Euryarchaeota Thermoplasmata Thermoplasm atales Thermoplasmatales Incertae Sedis Candidatus Methanomethylophilu s uncultured methanogenic archaeon 2 0 2 4 0.62 Bacteria Bacteroidetes Bacteroidia Bacteroidales Prevotellaceae Prevotella 1 Prevotella ruminicola 275 15 161 451 0.35 Bacteria Firmicutes Clostridia Clostridiales Ruminococcaceae Faecalibacterium bacterium ic1379 1 0 1 2 0.62 Bacteria Firmicutes Clostridia Clostridiales Ruminococcaceae Faecalibacterium Faecalibacterium cf. prausnitzii KLE1255 1 0 1 2 0.62 Bacteria Firmicutes Clostridia Clostridiales Ruminococcaceae Faecalibacterium Faecalibacterium prausnitzii 1 1 0 2 0.62 Bacteria Firmicutes Clostridia Clostridiales Ruminococcaceae Faecalibacterium human gut metagenome 0 1 0 1 0.40 Bacteria Firmicutes Clostridia Clostridiales Ruminococcaceae Faecalibacterium Trichuris trichiura (human whipworm) 11 17 7 35 0.24 Bacteria Firmicutes Clostridia Clostridiales Ruminococcaceae Faecalibacterium uncultured bacterium 4933 4242 4018 13193 0.58 Bacteria Firmicutes Clostridia Clostridiales Ruminococcaceae Faecalibacterium uncultured bacterium adhufec365 1 0 0 1 0.40 Bacteria Firmicutes Clostridia Clostridiales Ruminococcaceae Faecalibacterium uncultured Faecalibacterium sp. 5 7 1 13 0.15 Bacteria Firmicutes Clostridia Clostridiales Ruminococcaceae Faecalibacterium uncultured low G+C Gram-positive bacterium 0 0 1 1 0.40 Bacteria Firmicutes Clostridia Clostridiales Ruminococcaceae Faecalibacterium uncultured organism 116 83 96 295 0.45 Bacteria Firmicutes Clostridia Clostridiales Ruminococcaceae Faecalibacterium uncultured rumen bacterium 4 13 1 18 0.53 Methanogen ic taxa were obtained from a review by Tapio et al. [ 62 ]; counts were 810 obtained from the unfiltered OTU table. https://doi.o rg/10.1371/j ournal.pone .0205670.t004
in which direction, since mixed results were obtained from different analyses (Archaea-bacte-ria correlations, specific methanogenic taxa, pathway analysis).
Conclusions
The sequencing of the 16S rRNA marker gene constitutes an extraordinary advancement in the genetic analysis of microbial communities. Coupling metataxonomics with metagenome prediction gives insights into the genes and metabolic pathways associated with a microbiome, and is a very powerful technique for the functional profiling of microbial communities. Here, it was applied to the profiling of the rumen microbiome in dairy calves fed differentially sup-plemented diets. Copper and grape-pomace feed supplementations appeared to alter the rumen microbiome, both in terms of species diversity and gene functions. Results were in line with previous findings in both ruminal, human and murine microbiota. The addition of grape-pomace, in particular, seemed to modify the rumen microbial population, with an apparent effect also on methanogenic bacteria and methane metabolism in the rumen. It needs be emphasized though, that Archaea and methanogenic taxa were not specifically targeted by the sequencing approach employed in this study, and results should therefore be considered as indicative.
Overall, although from a small-scale experiment, the results presented here offer an inter-esting characterization of the rumen microbiota in dairy calves and the effects that copper and grape-pomace feed supplementation may exert. Grape-pomace, in particular, is a common byproduct from wine processing, and knowledge of its effects on the rumen microbiome will be helpful in assessing its potential as feedstuff for livestock. Using local industrial byproducts as animal feed constitutes a nice example of circular economy applied to the agri-food indus-try. Further experiments are however needed to confirm the neutral-to-positive effects of grape-pomace on the bovine rumen microbiome.
Supporting information
S1 Table. Custom-formulated concentrate. Ingredients and nutrient composition of the cus-tom-formulated concentrate, which was fed to all calves prior to the feed supplementation experiment.
(PDF)
S2 Table. Finishing diets. Ingredients and nutrient composition of the finishing diets fed to the three experimental groups (control, grape pomace and copper supplementation). (PDF)
S3 Table. Sequencing metrics. Number of 16S rRNA gene sequences retained after successive steps of the bioinformatics processing and filtering: comparison between two quality filtering thresholds (Phred>3, default in the Qiime pipeline; Phred>19, threshold used in this study). (PDF)
S1 Appendix. Metataxonomics pipeline command lines. Specific command lines used in the Qiime bioinformatics pipeline to process 16S rRNA-gene sequencing data.
(PDF)
S2 Appendix. Alpha- and beta-diversity indices. Break out of the calculations involved in the estimation of the alpha- and beta-diversity indices used in this study.
Acknowledgments
This work is part of the project VINCARN “Miglioramento delle carni bovine, suine e avicole attraverso l’utilizzo di sottoprodotti della filiera enologica per fini mangimistici” supported by a grant from the Rural Development Plan 2007–2013—MISURA 1.2.4—Regione Abruzzo— Italy (Project manager Prof. Giuseppe Martino). The authors are grateful to the company “Mario Maesa”, Casoli (CH), Italy, for the kind cooperation. The work of FB and G. Masetti was supported by the EU- FP7 project INDIGO, in the framework of People Marie Skło-dowska-Curie Actions, Marie Curie Industry-Academia Partnerships and Pathways (grant agreement number: 612116).
Author Contributions
Conceptualization: Lisa Grotta, Angelo Cichelli, Giuseppe Martino. Data curation: Filippo Biscarini, Fiorentina Palazzo, Lisa Grotta. Formal analysis: Filippo Biscarini, Giulia Masetti.
Funding acquisition: Giuseppe Martino.
Investigation: Federica Castellani, Giuseppe Martino.
Methodology: Filippo Biscarini, Fiorentina Palazzo, Giulia Masetti. Project administration: Angelo Cichelli, Giuseppe Martino.
Resources: Fiorentina Palazzo, Federica Castellani, Lisa Grotta, Giuseppe Martino. Software: Filippo Biscarini.
Supervision: Giuseppe Martino.
Writing – original draft: Filippo Biscarini, Fiorentina Palazzo.
Writing – review & editing: Filippo Biscarini, Fiorentina Palazzo, Federica Castellani, Giulia Masetti, Angelo Cichelli, Giuseppe Martino.
References
1. Jami E, White BA, Mizrahi I. Potential role of the bovine rumen microbiome in modulating milk composi-tion and feed efficiency. PLoS ONE. 2014; 9(1):e85423.https://doi.org/10.1371/journal.pone.0085423
PMID:24465556
2. Morgavi DP, Kelly WJ, Janssen PH, Attwood GT. Rumen microbial (meta)genomics and its application to ruminant production. animal. 2013; 7(s1):184–201.https://doi.org/10.1017/S1751731112000419
PMID:23031271
3. Khafipour E, Li S, Plaizier JC, Krause DO. Rumen microbiome composition determined using two nutritional models of subacute ruminal acidosis. Applied and environmental microbiology. 2009; 75(22):7115–24.https://doi.org/10.1128/AEM.00739-09PMID:19783747
4. Morgan XC, Huttenhower C, Butler R, Choudhuri J, Chuang H. Chapter 12: Human Microbiome Analy-sis. PLoS Computational Biology. 2012; 8(12):e1002808.https://doi.org/10.1371/journal.pcbi.1002808
PMID:23300406
5. Chaucheyras-Durand F, Ossa F. Review: The rumen microbiome: Composition, abundance, diversity, and new investigative tools. Professional Animal Scientist. 2014; 30(1):1–12.https://doi.org/10.15232/ S1080-7446(15)30076-0
6. Klindworth A, Pruesse E, Schweer T, Peplies J, Quast C, Horn M, et al. Evaluation of general 16S ribo-somal RNA gene PCR primers for classical and next-generation sequencing-based diversity studies. Nucleic Acids Research. 2013; 41(1):e1.https://doi.org/10.1093/nar/gks808PMID:22933715
7. Joshua C McCann TAW, Loor JJ. High-throughput Methods Redefine the Rumen Microbiome and Its Relationship with Nutrition and Metabolism. Bioinformatics and Biology Insights. 2014;(8):109–125.
8. Aßhauer KP, Meinicke P. On the estimation of metabolic profiles in metagenomics; 2013. Available from:http://drops.dagstuhl.de/opus/volltexte/2013/4238/.
9. Langille MGI, Zaneveld J, Caporaso JG, McDonald D, Knights D, Reyes JA, et al. Predictive functional profiling of microbial communities using 16S rRNA marker gene sequences. Nature Biotechnology. 2013; 31(9):814–821.https://doi.org/10.1038/nbt.2676PMID:23975157
10. Jami E, Mizrahi I. Composition and similarity of bovine rumen microbiota across individual animals. PloS one. 2012;.https://doi.org/10.1371/journal.pone.0033306
11. Jami E, Israel A, Kotser A, Mizrahi I. Exploring the bovine rumen bacterial community from birth to adult-hood. The ISME journal. 2013; 7(6):1069–79.https://doi.org/10.1038/ismej.2013.2PMID:23426008
12. Kim M, Yu Z. Variations in 16S rRNA-based microbiome profiling between pyrosequencing runs and between pyrosequencing facilities. Journal of Microbiology. 2014; 52(5):355–365.https://doi.org/10. 1007/s12275-014-3443-3
13. Lima FS, Oikonomou G, Lima SF, Bicalho MLS, Ganda EK, de Oliveira Filho JC, et al. Prepartum and postpartum rumen fluid microbiomes: Characterization and correlation with production traits in dairy cows. Applied and Environmental Microbiology. 2015; 81(4):1327–1337.https://doi.org/10.1128/AEM. 03138-14PMID:25501481
14. Petri RM, Schwaiger T, Penner GB, Beauchemin KA, Forster RJ, McKinnon JJ, et al. Characterization of the Core Rumen Microbiome in Cattle during Transition from Forage to Concentrate as Well as during and after an Acidotic Challenge. PLoS ONE. 2013; 8(12):e83424.https://doi.org/10.1371/journal.pone. 0083424PMID:24391765
15. Thoetkiattikul H, Mhuantong W, Laothanachareon T, Tangphatsornruang S, Pattarajinda V, Eurwilai-chitr L, et al. Comparative analysis of microbial profiles in cow rumen fed with different dietary fiber by tagged 16S rRNA gene pyrosequencing. Current Microbiology. 2013; 67(2):130–137.https://doi.org/10. 1007/s00284-013-0336-3PMID:23471692
16. Golder HM, Denman SE, McSweeney C, Wales WJ, Auldist MJ, Wright MM, et al. Effects of partial mixed rations and supplement amounts on milk production and composition, ruminal fermentation, bac-terial communities, and ruminal acidosis. Journal of dairy science. 2014; 97(9):5763–5785.https://doi. org/10.3168/jds.2014-8049PMID:24997657
17. Long M, Feng WJ, Li P, Zhang Y, He RX, Yu LH, et al. Effects of the acid-tolerant engineered bacterial strain Megasphaera elsdenii H6F32 on ruminal pH and the lactic acid concentration of simulated rumen acidosis in vitro. Research in Veterinary Science. 2014; 96(1):28–29.https://doi.org/10.1016/j.rvsc. 2013.11.013PMID:24360648
18. Nisbet DJ, Callaway TR, Edrington TS, Anderson RC, Krueger N. Effects of the Dicarboxylic Acids Malate and Fumarate on E. coli O157:H7 and Salmonella enterica Typhimurium Populations in Pure Culture and in Mixed Ruminal Microorganism Fermentations. Current Microbiology. 2009; 58(5):488– 492.https://doi.org/10.1007/s00284-008-9351-1PMID:19194750
19. De Nardi R, Marchesini G, Li S, Khafipour E, Plaizier KJC, Gianesella M, et al. Metagenomic analysis of rumen microbial population in dairy heifers fed a high grain diet supplemented with dicarboxylic acids or polyphenols. BMC veterinary research. 2016; 12(1):29.https://doi.org/10.1186/s12917-016-0653-4
PMID:26896166
20. Spanghero M, Salem AZM, Robinson PH. Chemical composition, including secondary metabolites, and rumen fermentability of seeds and pulp of Californian (USA) and Italian grape pomaces. Animal Feed Science and Technology. 2009; 152(3-4):243–255.https://doi.org/10.1016/j.anifeedsci.2009.04.015
21. Lu Y, Yeap Foo L. The polyphenol constituents of grape pomace. Food Chemistry. 1999; 65(1):1–8.
https://doi.org/10.1016/S0308-8146(98)00245-3
22. Moate PJ, Williams SRO, Torok VA, Hannah MC, Ribaux BE, Tavendale MH, et al. Grape marc reduces methane emissions when fed to dairy cows. Journal of Dairy Science. 2014; 97(8):5073–5087.https:// doi.org/10.3168/jds.2013-7588PMID:24952778
23. Faulkner MJ, Wenner BA, Solden LM, Weiss WP. Source of supplemental dietary copper, zinc, and manganese affects fecal microbial relative abundance in lactating dairy cows. Journal of Dairy Science. 2017; 100(2):1037–1044.https://doi.org/10.3168/jds.2016-11680PMID:27988129
24. Marchesi JR, Ravel J. The vocabulary of microbiome research: a proposal. Microbiome. 2015; 3(1):31.
https://doi.org/10.1186/s40168-015-0094-5PMID:26229597
25. Yu Z, Morrison M. Improved extraction of PCR-quality community DNA from digesta and fecal samples. BioTechniques. 2004; 36(5):808–812.https://doi.org/10.2144/04365ST04PMID:15152600
26. Andrews S. FastQC: a quality control tool for high throughput sequence data. Babraham Bioinformatics. 2010;.
27. John JA. SeqPrep v1.1—Tool for stripping adaptors and/or merging paired reads with overlap into sin-gle reads; 2011. Available from:https://github.com/jstjohn/SeqPrep.
28. Quast C, Pruesse E, Yilmaz P, Gerken J, Schweer T, Yarza P, Peplies J and Glo¨ckner FO. The SILVA ribosomal RNA gene database project: improved data processing and web-based tools. Nucleic acids. 2013; 41(D1):590–596.https://doi.org/10.1093/nar/gks1219
29. Yilmaz P, Parfrey LW, Yarza P, Gerken J, Pruesse E, Quast C, Schweer T, Peplies J, Ludwig W and Glo¨ckner FO. The SILVA and “all-species living tree project (LTP)” taxonomic frameworks. Nucleic acids. 2014; 42(D1):643–648.https://doi.org/10.1093/nar/gkt1209
30. Li W, Godzik A. Cd-hit: a fast program for clustering and comparing large sets of protein or nucleotide sequences. Bioinformatics. 2006; 22(13):1658–1659.https://doi.org/10.1093/bioinformatics/btl158
PMID:16731699
31. Caporaso J, Kuczynski J, Stombaugh J, Bittinger K, Caporaso JG, Kuczynski J, Stombaugh J, Bittinger K, Bushman FD, Costello EK, Fierer N, Peña AG, Goodrich JK, Gordon JI, Huttley GA. QIIME allows analysis of high-throughput community sequencing data. Nature. 2010; 7:335–336.
32. Chao A. Nonparametric Estimation of the Number of Classes in a Population Author. Scanadinavian Journal of Statistics. 1984; 11(4):265–270.
33. Chao A, Lee SM. Estimating the Number of Classes via Sample Coverage. Journal of the American Sta-tistical Association. 1992; 87(417):210.https://doi.org/10.1080/01621459.1992.10475194
34. Chao A, Ma MC, Yang MCK. Stopping rule and estimation for recapture debugging with unequal detec-tion rates. Biometrika. 1993; 80(1):193–201.https://doi.org/10.1093/biomet/80.1.193
35. Shannon C. A Mathematical Theory of Communication. The Bell System Technical Journal. 1948; p. 379–427.https://doi.org/10.1002/j.1538-7305.1948.tb01338.x
36. Simpson EH. Measurement of diversity. Nature. 1949; 163:688.https://doi.org/10.1038/163688a0
37. Fisher RA, Corbet AS, Williams CB. The Relation Between the Number of Species and the Number of Individuals in a Random Sample of an Animal Population. The Journal of Animal Ecology. 1943; 12 (1):42–58.https://doi.org/10.2307/1411
38. Smith B, Wilson JB. A Consumer’s Guide to Evenness Indices. Oikos. 1996; 76(1):70.https://doi.org/ 10.2307/3545749
39. Bray JR, Curtis JT. An ordination of the upland forest communities of Southern Wisconsin. Ecol Mono-graphs. 1957; 27(4):325–349.https://doi.org/10.2307/1942268
40. Paulson JN, Stine OC, Bravo HC, Pop M. Differential abundance analysis for microbial marker-gene surveys. Nature methods. 2013; 10(12):1200–2.https://doi.org/10.1038/nmeth.2658PMID:24076764
41. Anderson M. A new method for non-parametric multivariate analysis of variance. Austral Ecology. 2001; 26(1):32–46.https://doi.org/10.1111/j.1442-9993.2001.01070.pp.x
42. Aßhauer KP, Wemheuer B, Daniel R, Meinicke P, A L, B M, et al. Tax4Fun: predicting functional profiles from metagenomic 16S rRNA data: Fig. 1. Bioinformatics. 2015; 31(17):2882–2884.https://doi.org/10. 1093/bioinformatics/btv287PMID:25957349
43. Kanehisa M, Sato Y, Kawashima M, Furumichi M, Tanabe M. KEGG as a reference resource for gene and protein annotation. Nucleic Acids Research. 2016; 44(D1):D457–D462.https://doi.org/10.1093/ nar/gkv1070PMID:26476454
44. Wickham H. ggplot2 Elegant Graphics for Data Analysis. vol. 35; 2009. Available from:https://scholar. google.it/scholar?q=H.+Wickham.+ggplot2{%}3A+Elegant+Graphics+for+Data+Analysis.+Springer-Verlag+New+York{%}2C+2009.{&}btnG={&}hl=it{&}as{_}sdt=0{%}2C5http://had.co.nz/ggplot2/book. 45. Team R. A language and environment for statistical computing. R Foundation for statistical computing,
2015; Vienna, Austria. 2016;.
46. Mao S, Zhang M, Liu J, Zhu W. Characterising the bacterial microbiota across the gastrointestinal tracts of dairy cattle: membership and potential function. Scientific reports. 2015; 5(April):16116.https://doi. org/10.1038/srep16116PMID:26527325
47. Wang Z, Elekwachi C, Jiao J, Wang M, Tang S, Zhou C, et al. Changes in metabolically active bacterial community during rumen development, and their alteration by rhubarb root powder revealed by 16s rRNA amplicon sequencing. Frontiers in Microbiology. 2017; 8(FEB):159.https://doi.org/10.3389/fmicb. 2017.00159PMID:28223972
48. Torok VA, Ophel-Keller K, Loo M, Hughes RJ. Application of methods for identifying broiler chicken gut bacterial species linked with increased energy metabolism. Applied and Environmental Microbiology. 2008; 74(3):783–791.https://doi.org/10.1128/AEM.01384-07PMID:18065621
49. Popova M, McGovern E, McCabe MS, Martin C, Doreau M, Arbre M, et al. The structural and functional capacity of ruminal and cecal microbiota in growing cattle was unaffected by dietary supplementation of linseed oil and nitrate. Frontiers in Microbiology. 2017; 8(MAY):937.https://doi.org/10.3389/fmicb.2017. 00937PMID:28596764
50. Ravachol J, De Philip P, Borne R, Mansuelle P, Mate´ MJ, Perret S, et al. Mechanisms involved in xylo-glucan catabolism by the cellulosome-producing bacterium Ruminiclostridium cellulolyticum. Scientific Reports. 2016; 6:22770.https://doi.org/10.1038/srep22770PMID:26946939
51. Gao Y, Fangel JU, Willats WGT, Vivier MA, Moore JP. Dissecting the polysaccharide-rich grape cell wall matrix using recombinant pectinases during winemaking. Carbohydrate Polymers. 2016; 152:510– 519.https://doi.org/10.1016/j.carbpol.2016.05.115PMID:27516299
52. Blaut M, Schoefer L, Braune A. Transformation of flavonoids by intestinal microorganisms. In: Interna-tional Journal for Vitamin and Nutrition Research. vol. 73. Verlag Hans Huber; 2003. p. 79–87. Avail-able from:http://econtent.hogrefe.com/doi/abs/10.1024/0300-9831.73.2.79.
53. Kasparovska J, Pecinkova M, Dadakova K, Krizova L, Hadrova S, Lexa M, et al. Effects of isoflavone-enriched feed on the rumen microbiota in dairy cows. PLoS ONE. 2016; 11(4):e0154642.https://doi. org/10.1371/journal.pone.0154642PMID:27124615
54. Ley R, Turnbaugh P, Klein S, Gordon J. Microbial ecology: human gut microbes associated with obe-sity. Nature. 2006;.https://doi.org/10.1038/4441022a
55. Turnbaugh PJ, Ley RE, Mahowald Ma, Magrini V, Mardis ER, Gordon JI. An obesity-associated gut microbiome with increased capacity for energy harvest. Nature. 2006; 444(7122):1027–31.https://doi. org/10.1038/nature05414PMID:17183312
56. Draman M, Ludgate M. Thyroid eye disease-an update. Expert Review of Ophthalmology. 2016; 11(4):273–284.https://doi.org/10.1080/17469899.2016.1202113
57. Kafantaris I, Kotsampasi B, Christodoulou V, Kokka E, Kouka P, Terzopoulou Z, et al. Grape pomace improves antioxidant capacity and faecal microflora of lambs. Journal of Animal Physiology and Animal Nutrition. 2017; 101(5):e108–e121.https://doi.org/10.1111/jpn.12569PMID:27753147
58. Knight R, Jansson J, Field D, Fierer N, Desai N, Fuhrman JA, et al. Unlocking the potential of metage-nomics through replicated experimental design. Nature Biotechnology. 2012; 30(6):513–520.https:// doi.org/10.1038/nbt.2235PMID:22678395
59. McDonald D, Price MN, Goodrich J, Nawrocki EP, DeSantis TZ, Probst A, et al. An improved Green-genes taxonomy with explicit ranks for ecological and evolutionary analyses of bacteria and archaea. The ISME journal. 2012; 6(3):610–8.https://doi.org/10.1038/ismej.2011.139PMID:22134646
60. Negussie E, de Haas Y, Dehareng F, Dewhurst RJ, Dijkstra J, Gengler N, et al. Invited review: Large-scale indirect measurements for enteric methane emissions in dairy cattle: A review of proxies and their potential for use in management and breeding decisions. Journal of Dairy Science. 2017; 100(4):2433– 2453.https://doi.org/10.3168/jds.2016-12030PMID:28161178
61. Janssen PH, Kirs M, Janssen PH, Kirs M. Structure of the Archaeal Community of the Rumen MINIRE-VIEW. Applied and environmental microbiology. 2008; 74(12).https://doi.org/10.1128/AEM.02812-07
PMID:18424540
62. Tapio I, Snelling TJ, Strozzi F, Wallace RJ. The ruminal microbiome associated with methane emissions from ruminant livestock. Journal of Animal Science and Biotechnology. 2017; 8(7):2–11.