AN ASSESSMENT OF THE EFFECTS OF ALCOHOL CONSUMPTION AND PREVENTION POLICIES ON TRAFFIC FATALITY RATES IN THE EU
ENLARGED. SHOULD BE ALCOHOL LIMITS ZERO?
1. INTRODUCTION
The European region is well known for its traditional heavy consumption of alcohol, especially in Central and Eastern countries (Popova et al., 2007), which attracts academic attention to the health implications of its abuse. A large part of research has focused on the association between alcohol consumption and driving (Driving Under the Influence, DUI) (Skog, 2001a, 2001b; Taylor et al.; 2010; Taylor & Rehm, 2012), and the influence of alcohol consumption on individual’s risk perception regarding to traffic accidents (Elias & Shiftan, 2012).
The harmful consequences of alcohol consumption represent a global health problem, but every European country applies national laws and policies to control DUI within a concrete framework that determines alcohol consumption patterns and leads to different degrees of effectiveness (Bloomfield et al., 2003; Skog, 2001a). As Ruhm (1996) suggests, characteristics such as driver behavior and cultural drinking tolerance could explain this heterogeneity. Furthermore, Britton et al. (2003) point to differences in alcohol consumption levels that could explain the variability in alcohol-associated mortality in part.
In this context, whereas previous studies focus on the individual case study of one specific country, we investigate the impact of alcohol consumption and drinking patterns on traffic mortality rates for a panel of EU countries during the 1999-2012 period, controlled by moderator variables relating to economic activity, mobility patterns, demography and geographical situation, and road safety strategies. Our goal is to assess the effectiveness of different national alcohol control strategies, (based on consumption limits laws for DUI, economic mechanisms of deterrence according to alcohol prices, minimum age requirement for alcohol consumption), applied by each EU member. All this, taking into account the complete EU enlargement process with the accession of Baltic and Eastern countries, characterized by higher levels of alcohol drinking (see e.g. Popova et al., 2007), but that are known as ‘zero-tolerance countries’ due to their stricter control alcohol laws.
The opportunity of our study is justified because, following Hughes et al. (2011), although a number of European studies have recently been conducted on this topic, further research is needed as drinking behaviors, price contexts and actions to control alcohol may change over time and may significantly differ from one country to the next; and all of this may affect road safety performance. All EU members have developed drink-driving control policies (for example, a Blood Alcohol Content –BAC- limits, minimum legal age for alcohol purchase and consumption; enforcement), but there is a lack of harmonization among them and political, geographical, cultural, and economic factors may affect both alcohol consumption and health impacts. Furthermore, Vukina & Nestić (2015) find evidence that enforcement of restrictions on alcohol use in several European countries seem to be inefficient to diminish accidents and traffic violations.
One of the examples to illustrate the big difference in rules between States is related to national policies towards BAC limits that ranges from zero in countries as Sweden, to 0.8 g/L in others as the United Kingdom, while majority of countries applied the 0.5 g/L rate in line with the European Commission (EC) Recommendation adopted in 2003.
This recommendation has been reinforced by the 4th European Road Safety Programme (ERSAP) titled “Towards a European road safety area: policy orientations on road safety 2011-2020”, where the EC places an emphasis on stronger enforcement of drinking-driving and stresses the requirement of preventative measures as the installation of alcohol interlock devices in vehicles, mandatory, for example, for professional transport.
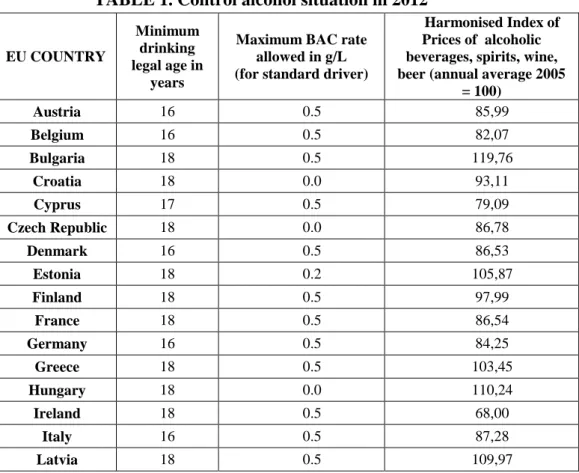
A comparison of countries in respect to the current legal BAC limit and other control alcohol actions in force in the 28 EU member States, considered in this paper, is presented in Table 1. BAC rates applied vary considerably as we have commented previously, while MDLA laws are predominantly in the range 16 (Central countries) to 18 (the majority of the States). The tendency for the lower BAC can be observed in the so called Eastern EU countries. A zero-tolerance approach mandatory for all road users has been already in force in the Czech Republic, Hungary, Romania and Slovakia for decades. While United Kingdom and Malta, still have a BAC limit at 0.8g/L, higher than the EC recommendation of 0.5 g/L. Nevertheless, according to the SafetyNet project, that analyzes the alcohol related fatalities in EU(see Podda, 2012 and Rocakova-Filemon & Eksler, 2008), States with zero BAC limit has in average of alcohol related fatalities, while other Scandinavian countries with a 0.2 g/L BAC rate, present the highest alcohol related fatalities.
TABLE 1. Control alcohol situation in 2012
EU COUNTRY
Minimum drinking legal age in
years
Maximum BAC rate
allowed in g/L (for standard driver)
Harmonised Index of Prices of alcoholic beverages, spirits, wine, beer (annual average 2005
= 100) Austria 16 0.5 85,99 Belgium 16 0.5 82,07 Bulgaria 18 0.5 119,76 Croatia 18 0.0 93,11 Cyprus 17 0.5 79,09 Czech Republic 18 0.0 86,78 Denmark 16 0.5 86,53 Estonia 18 0.2 105,87 Finland 18 0.5 97,99 France 18 0.5 86,54 Germany 16 0.5 84,25 Greece 18 0.5 103,45 Hungary 18 0.0 110,24 Ireland 18 0.5 68,00 Italy 16 0.5 87,28 Latvia 18 0.5 109,97
Lithuania 18 0.5 97,69 Luxembourg 16 0.5 86,31 Malta 17 0.8 78,72 Netherlands 16 0.5 80,34 Poland 18 0.2 83,43 Portugal 16 0.5 86,95 Romania 18 0.0 93,82 Slovakia 18 0.0 88,69 Slovenia 18 0.5 100,92 Spain 18 0.5 87,05 Sweden 18 0.2 78,60 United Kingdom 18 0.8 93,45
Following Rocakova-Filemon & Eksler (2008), note that the lower limit has been mainly implemented in the post communistic EU countries, while the countries with higher limit are mainly situated in western part of the continent. The motivation for implementing these different limits in each country seems to depend not only on accidents rates but also on social-economic, the historical context and cultural aspects of concrete countries.
Bearing in mind this context, we aim to answer these research questions: At an aggregated-level across EU countries, how does alcohol consumption behavior affect road safety? Is this finding influenced by gender and population age groups? What is the effectiveness of alcohol policy strategies in terms of road safety effects considering the EU enlargement process? Are there differential socio-cultural, geographical or economic factors that determine the effectiveness of these measures? Is effective to have a strict limit – zero of BAC? Do stricter control strategies lead to better results?
In summary, we believe that by answering these questions we can contribute some recommendations to improve the management of alcohol control policy from a safety approach.
The paper has the following structure: after this introduction, a review of the recent literature is presented in Section 2; the empirical framework is provided in Section 3; Section 4 discusses the results; and the conclusions in Section 5 are followed by references.
2. RECENT RESEARCH
Recent literature into alcohol consumption and drinking habits has focused on three fields. First, factors that influence consumption patterns (systematic review in Hughes et al., 2011), for example, geographic-cultural aspects (Bloomfield et al., 2003; Room et al., 2012). Second, individual characteristics, for example, gender (Mäkelä et al., 2006; Wilsnack et al., 2000); age (Engels et al., 2000; McCarthy, 2005; Watling & Armstrong, 2015; Wells, & Macdonald, 1999); beverage preferences (Dey et al., 2013). Third, effectiveness of public and police interventions (see Chang et al., 2013; Cook et al., 2014; Warner & Forward, 2016), for example, minimum legal age for purchasing or
consumption (Loeb, 1987; Plunk et al., 2013; Subbaraman & Kerr, 2013); prices and taxation of alcoholic beverages (Chaloupka et al., 2002; Lhachimi et al., 2012).
Researchers such as Rehm et al. (1996), Rehm et al. (2001), have reported the adverse health consequences of drinking patterns in general. Regarding to this, the relationship between alcohol consumption and road traffic accidents (RTA) has raised attention in recent years, although according to the meta-analysis performed by Taylor et al. (2010) a high heterogeneity between studies can be found due to different outcome measures of alcohol-related crash involvement used by them. In general, worldwide studies concur in demonstrating the existence of a J-shaped curve, in the sense that the risk of having an accident increases exponentially with an increase in alcohol consumption (Elliot et al., 2009; Keall et al., 2004; Knott et al., 2015; Ogeil et al., 2016; Pereira et al., 2011; Zador et al., 2000). Furthermore, this risk of crashing under the effects of alcohol seems to be particularly stressed for younger drivers, in the United States (Brady & Li, 2014), Canada (Callaghan et al. 2016), Australia (Begg et al., 2016) and European countries (Legrand et al., 2014; Skog, 2001b), due to their driving inexperience and natural predisposition to risk taking and crash involvement. Similarly, previous recent studies have found that the role of alcohol in traffic injury mortality also varies in different gender groups, with effects on male mortality much higher than on female mortality (Alcañiz et al., 2016; Scott-Parker et al., 2014; Skog, 2003; Tay, 2005).
There is wide recent evidence analyzing the effectiveness of preventive interventions from DUI and exploring a variety of issues (see, for example, the comprehensive analysis made by Treno et al., 2014). Some researchers have studied alcohol-related laws and policies such as Blood Alcohol Content (BAC) limits, that are the most widespread strategies according to WHO (2009). They have evidenced reductions in alcohol-related RTA when BAC is firstly introduced (Mann et al., 2001), although when BAC limits are lowered, the magnitude of estimated effects may vary considerably. BAC limits that are lowered from 0.10 g/L to 0.8 g/L, seem to reduce road traffic injuries and fatalities, although the degree of the impact varies (see e.g. Fell & Voas, 2006 and Wagenaar et al., 2007 for the US case); lowering from 0.8 g/L to 0.5 g/L or less, helps reduce traffic injuries and fatalities, although in certain contexts and less that in the earlier case (see e.g. Albalate, 2008 for the EU or Blais et al., 2015 for Canada); even the so-called zero-tolerance laws can help reduce alcohol-related injuries and deaths when are linked to other measures as administrative license revocations (Eisenberg, 2003).
Moreover, evidence shows that effects of introducing or reducing BAC levels may be reinforced when are combined with law enforcement behavioral, for example by random breath testing (Fell & Voas, 2003); with provision of information by mass media campaigns (Elder et al., 2004) or public educational programmes (Martineau et al., 2013). Apart from the BAC laws, scholars have recently explored other regulations such as the Minimum Legal Drinking Age. Authors such as Albalate (2008), Voas et al. (2003) or Shults et al. (2002) show that there is evidence that MLDA laws, particularly those that increase the MLDA at age 20-21, are effective in preventing alcohol-related RTA, for the US case, although in Australia, e.g., this positive impact does not seem to be so clear following Lindo et al. (2016).
Other measures based on economic deterrence mechanisms such as public policies affecting the price of alcoholic beverages (through taxes), seem to have significant effects on alcohol-related RTA and fatal and injury associated as part of a comprehensive action to reduce alcohol-impaired driving (Chaloupka et al., 2002; Saar, 2015; Wagenaar et al., 2015).
In short, most of the literature that explores both the influence of drinking patterns on road safety and the effectiveness of alcohol policies, considers the US or another individual country as Australia (due to the recent regulatory changes undertaken in both countries) as case study, and the results are not often controlled by any other variables.
Concerning to our case study, EU countries, there are several studies on the impact of lowering BAC limits to 0.5 g/L or less (0.2 g/L), however are related to a single country (e.g. Mathijssen, 2005 for the Netherlands; Bernhoft & Behrensdorff, 2003 for Denmark; Norstrom & Laurell, 1997 for Sweden), or are not based on robust methodologies but on a simple before-after analysis (Bartl & Esberger, 2000). So this, we believe that possibly Albalate (2008) provides the most recent and relevant study on the effects of the transition of BAC legal limits from 0.8 g/L to the 0.5 g/L BAC limit. For the period 1991-2003 and taking into account a number of variables that could affect the results (such as economic growth, road infrastructure, level of enforcement, or other simultaneous road safety policies), this author found that the transition of EU15 countries to the BAC limit of 0.5, significantly improved fatality rates per capita and per km driven (not for the whole population), although with differential effectiveness according to gender or age.
Nevertheless, the sample analyzed by this author was related to EU-15 countries and the period analyzed did not extend beyond year 2003; whereby, this author did not consider the later EU enlargement process towards Baltic and Eastern countries (with the accession of Cyprus, Czech Republic, Estonia, Hungary, Latvia, Lithuania, Malta, Poland, Slovakia and Slovenia, in 2004; of Bulgaria and Romania in 2007; and finally, Croatia in 2013).
In this sense, our current study contributes to the prior literature in several aspects. First, to our knowledge this is the first evaluation of alcohol control policies (not only BAC) to date for a panel data of EU28 countries that does consider the main enlargement process of adhesion to EU. Second, this wide panel introduces a set of explanatory variables and major policies interventions that enables us to examine the aspects that affect the relation between alcohol consumption and traffic fatalities rates in the EU, considering several economic deterrence factors not previously tested for the EU case, such as alcohol prices. Third, we think one of the main strengths of our paper is that we analyze the geographical influence of this association taking into account those member States that recently joined EU and that are well known as ‘zero-tolerance’ countries; which leads us to provide the first evidence of how this control alcohol policy can affect road safety at aggregate EU level.
3. EMPIRICAL ANALYSIS
We build an original panel for EU28 country data from 1999 to 2012. The unit of observation is the country-year pair. However, data for alcohol related variables are not
available for some countries (Bulgaria, Croatia, Cyprus, Latvia, Lithuania, Malta and Romania). Consequently, our sample study is including the following countries that joined EU in the XXI century: Czech Republic, Estonia, Hungary, Poland, Slovenia and Slovakia. All of them with high levels of alcohol consumption and BAC legal limits lower than 0.5 g/L, except Slovenia.
This must be taken into account when interpreting the results, as the results for the control variables could differ from those for complete data for all EU28 countries. The final sample comprises 294 observations.
Our model takes this form for country i during period t:
Yit = α + βkXit + γkZit + λkWit + ν’Yeart + εit (1)
Yit is the log of the total per capita fatality rate1 (within 30 days of the accident, as per the Vienna Convention definition), Xit contains the vector of the country’s economic, geographical and demographic attributes, Zit refers to variables related to alcohol consumption and alcohol related policies, and Wit are variables related to other road safety policies. We also include dummies for years to control for the common trend in all the countries in the dataset and εit is a mean-zero random error.
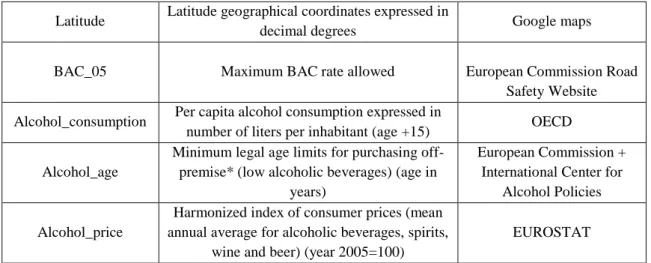
Tables 2 and 3 provide information and descriptive statistics of all the variables used.
TABLE 2. Variables
Variables Description and units Source
Fatalities per capita
Number of traffic fatalities per billion
passengers-km CARE database
Motorization Number of registered passenger cars per
thousand inhabitants UNECE, EUROSTAT
GDP per capita
Per capita gross domestic product in International Comparable Prices (expressed in
US$ at 2005 prices and PPP)
EUROSTAT
Motorway density Number of kms of motorways / km
2 of the
country UNECE, EUROSTAT
Vehicles-km driven Number of passenger-cars-km expressed as
1000 million km and weighted by national population
EU Directorate General for mobility and transport
Young
Percentage of population between 15 and 24
years old EUROSTAT
Speed limits Maximum speed limits allowed in national
highways/motorways expressed in km/h
European Commission Road Safety Website
Male Proportion of male population expressed in %
of males over total population EUROSTAT
Longitude Longitude geographical coordinates expressed
in decimal degrees Google maps
1It would be very useful to use data of alcohol-related fatalities. Unfortunately, data available in UNECE is
just until 2009 and with missing values for many countries. Thus, our sample would be too small to perform a robust econometric analysis.
Latitude Latitude geographical coordinates expressed in
decimal degrees Google maps
BAC_05 Maximum BAC rate allowed European Commission Road
Safety Website
Alcohol_consumption Per capita alcohol consumption expressed in
number of liters per inhabitant (age +15) OECD
Alcohol_age
Minimum legal age limits for purchasing off-premise* (low alcoholic beverages) (age in
years)
European Commission + International Center for
Alcohol Policies Alcohol_price
Harmonized index of consumer prices (mean annual average for alcoholic beverages, spirits,
wine and beer) (year 2005=100)
EUROSTAT * Off-premise retail sale refers to the selling of alcoholic beverages for consumption elsewhere and not on the site of sale (for example, in state monopoly stores, wine shops, supermarkets, and petrol stations or kiosks, depending on country regulations).
TABLE 3. Descriptive statistics of the variables
Variables Mean Standard Deviation
Minimum value
Maximum value
Fatalities per capita 102.53 45.26 21 253
Motorization 431.29 111.55 134 686 GDP per capita 25319.24 11610.64 6737 74128 Motorway density 1.72 1.73 0 6.35 Vehicles-km driven 35.47 294.11 2.18 4248.17 Young 13.22 1.65 10 17.2 Point system 0.97 0.87 0 2 Speed limits 121.5 13.51 80 130 Longitude 13.92 10.82 -9.00 33.53 Latitude 48.45 6.92 34.84 61.75 BAC_05 0.71 0.45 0 1 Alcohol_consumption 10.83 1.86 6.1 14.8 Alcohol_age 17.35 0.89 16 18 Alcohol_price 78.44 10.02 43.4 119.76
The relationship between a country’s economic development and road traffic fatalities may be non-linear (Anbarci et al., 2006; Kopits & Cropper, 2005; Law et al., 2011; Nishitateno & Burke, 2014). Indeed, fatality rates may increase with economic development in very poor countries, due to increased exposure to RTA. However, the relationship between economic development and traffic fatality rates may become flat or even invert after reaching a certain wealth threshold. We test the hypothesis concerning non-linearity between GDP and traffic fatalities by including the GDP and the square of the GDP as explanatory variables. Following the systematic review provided by de Goeij et al. (2015), we think that this GDP variable can also address the relationship between economic activity and alcohol consumption and, specifically, alcohol-related health problems, such as traffic accidents.
We also consider the number of passenger cars per capita (motorization) although the expected sign of the coefficient associated with this variable is not clear a priori. Higher levels of motorization may imply higher exposure to RTAs. However, countries with
higher levels of motorization may have better infrastructure and vehicles, more advanced policies and more beneficial social attitudes towards road safety (Kopits & Cropper, 2005; Law et al., 2011).
We also take into account the influence of the quality of the transport infrastructure by including a variable for motorway density. In this regard, we may expect a negative relationship between the quality of transport infrastructure and road traffic fatality rates, as found in Albalate & Bel (2012) and Jamroz (2012).
Furthermore, we consider the intensity of traffic on the roads by including a variable for the number of passengers-kilometer weighted by country population. The expected relationship between the intensity of traffic and fatalities is not clear a priori. While the overall volume of driving is an indication of the population’s exposure to road accident risks (Orsi et al. 2012), such a relationship could be dependent upon congestion levels (Li et al., 2012).
Geographical variables relating to the country’s longitude and latitude are also included in the empirical analysis as, according to previous researchers such as Rehm et al. (2003) and Room et al. (2012), there are several cultural drinking patterns linked to geographical aspects.
We also consider a variable for the percentage of the population aged 15-24 years. In this regard, we may expect that risk exposure is higher for the younger population because younger road users usually take more risks (Langford et al., 2006). Thus, our expectation is that this variable should be positive.
As for variables for road safety policies, an explanatory variable is included to examine the effects of any driving license point system that takes the value of one if a penalty driving license system is applied, two if a demerit driving license system is applied, and zero if no point system is applied. We expect a negative sign in the coefficient associated with this variable (following Castillo-Manzano & Castro-Nuño, 2012). Another traffic policy variable is the maximum speed limit allowed on motorways. According to previous studies (Elvik, 2012), we expect a positive sign in the associated coefficient, as the consequence of a higher speed limit may be a higher number of traffic fatalities.
The variables of main interest in our analysis are those related to alcohol consumption and alcohol-related variables. We expect a positive sign in the coefficient associated with our alcohol consumption variable, as higher consumption levels may lead to more accidents.
Following previous studies (Albalate, 2008; Castillo-Manzano et al., 2013, 2014; Eisenberg, 2003), we include a variable for the maximum BAC limit allowed.
We also include additional variables for alcohol-related policies that have received less attention in the literature than BAC rates: that is, a variable that captures the legal age limits for purchasing off-premise alcoholic beverages, and a variable for the price of alcohol. We expect a negative effect on road safety outcomes for both of these variables. Regarding the minimum legal age limit, O’Malley & Wagenaar (1991) and Subbraman & Kerr (2013) provide evidence that lowering the minimum age limit would increase drinking rates and their harmful consequences. With respect to the price of alcohol, Chaloupka et al. (2002) reviewed the impact of the price of alcohol on drinking and abuse-related outcomes, and supported the conclusion provided by Lhachimi et al. (2012) for
11 EU countries, that a price rise would lead to significant reductions in alcohol consumption and health impacts.
We expect a negative sign in the coefficient associated with these variables, namely Alcohol_price and Alcohol_age, when we consider certain age groups, since they may reduce the consumption of alcohol and may reduce the likelihood of risky attitudes by young drivers as, according to Wells & MacDonald (1999), there is a significant link between consumption patterns and RTA among the younger population.
A geographical pattern is found by Engels et al. (2000) with two drinking behaviors: young people from Mediterranean countries characterized as “innovative” and young people from Northern countries with “rebel” behaviors.
Finally, we also consider different patterns related with gender. According to Wilsnack et al. (2000), gender differences associated with alcohol consumption may be emphasized by certain social gender roles connected with alcohol abuse by men exceeding that of women (Mäkelä et al. 2006) and with drunken drivers more likely to be men, especially in European countries, as stated by Legrand et al. (2014). To account for gender differences, we run two additional regressions in which the dependent variable is the traffic fatality rate for men and women, respectively.
4. ESTIMATES AND RESULTS
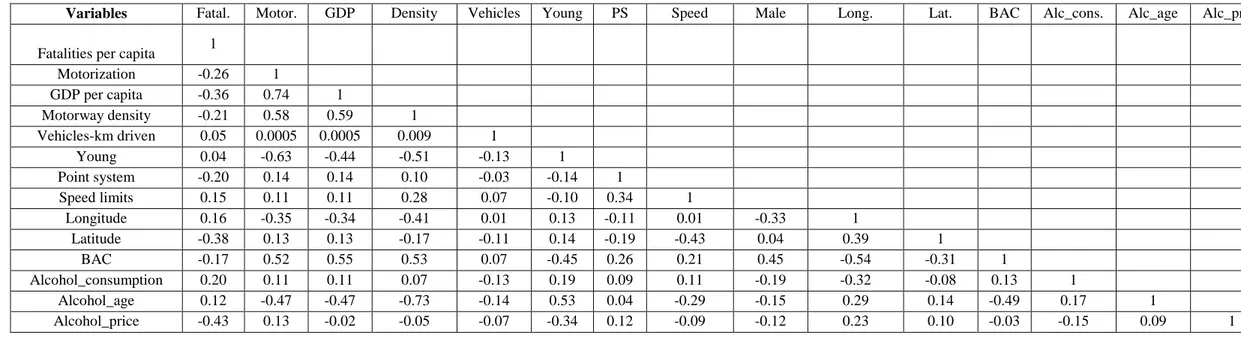
Table 4 shows the correlation matrix of the variables used. Some variables are highly correlated and may cause a multi-collinearity issue that can increase estimates of the parameter variance distorting its statistical significance or even, in the most severe cases, producing parameter estimates of implausible magnitude. In this regard, there is a high correlation between GDP and motorization, while motorway density and the geographical variables are highly correlated with several variables.
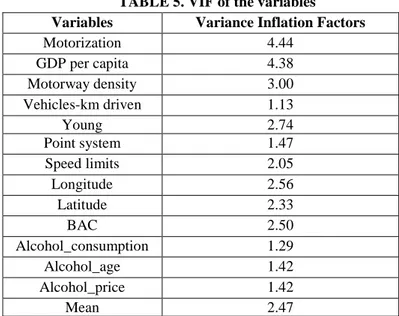
The Variance Inflation Factor (VIF) is a widely used measure to examine the degree of multi-collinearity between explanatory variables. Several rules of thumb associated with VIF have been considered as a sign of severe multi-collinearity. The usual rule of thumb considered in the econometric textbooks is 10 although practitioners may ultimately use lower threshold values, with 5 a being common value. Table 5 shows that the VIF are lower than 5 for all variables. However, we report additional regressions excluding one or several of the variables (motorization, motorway density, geographical variables) that may distort the statistical significance of the alcohol related variables.
Estimates may present problems of heteroscedasticity and temporal autocorrelation in the error term. Indeed, the Wooldridge test for autocorrelation in panel data shows that there may be a problem of serial autocorrelation, while the Breusch-Pagan/Cook-Weisberg test indicates that we may have a problem of heteroscedasticity as well.
Taking these test results into account, we performed the estimation using the negative binomial method given that the dependent variable should be considered as a count variable (Anbarci et al., 2006). Note that standard errors are robust to heterocedasticity and we also assume an AR(1) process in the error term.
TABLE 4. Correlation matrix
Variables Fatal. Motor. GDP Density Vehicles Young PS Speed Male Long. Lat. BAC Alc_cons. Alc_age Alc_price
Fatalities per capita 1
Motorization -0.26 1 GDP per capita -0.36 0.74 1 Motorway density -0.21 0.58 0.59 1 Vehicles-km driven 0.05 0.0005 0.0005 0.009 1 Young 0.04 -0.63 -0.44 -0.51 -0.13 1 Point system -0.20 0.14 0.14 0.10 -0.03 -0.14 1 Speed limits 0.15 0.11 0.11 0.28 0.07 -0.10 0.34 1 Longitude 0.16 -0.35 -0.34 -0.41 0.01 0.13 -0.11 0.01 -0.33 1 Latitude -0.38 0.13 0.13 -0.17 -0.11 0.14 -0.19 -0.43 0.04 0.39 1 BAC -0.17 0.52 0.55 0.53 0.07 -0.45 0.26 0.21 0.45 -0.54 -0.31 1 Alcohol_consumption 0.20 0.11 0.11 0.07 -0.13 0.19 0.09 0.11 -0.19 -0.32 -0.08 0.13 1 Alcohol_age 0.12 -0.47 -0.47 -0.73 -0.14 0.53 0.04 -0.29 -0.15 0.29 0.14 -0.49 0.17 1 Alcohol_price -0.43 0.13 -0.02 -0.05 -0.07 -0.34 0.12 -0.09 -0.12 0.23 0.10 -0.03 -0.15 0.09 1
11
TABLE 5. VIF of the variables Variables Variance Inflation Factors
Motorization 4.44 GDP per capita 4.38 Motorway density 3.00 Vehicles-km driven 1.13 Young 2.74 Point system 1.47 Speed limits 2.05 Longitude 2.56 Latitude 2.33 BAC 2.50 Alcohol_consumption 1.29 Alcohol_age 1.42 Alcohol_price 1.42 Mean 2.47
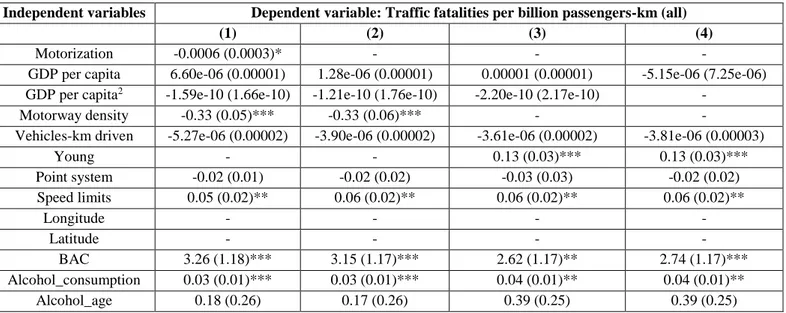
Table 6 contains the determinants of the traffic fatalities equation including all variables, while Table 7 shows the regressions that exclude some explanatory variables that may impose a multicollinearity problem.
The sign of the GDP variables suggests the non-linear relationship between traffic fatality rates and economic development. However, the influence of the GDP variables seems to be modest in the context of our data because they are not statistically significant.
We also find that a higher level of motorization leads to lower traffic fatalities. Interestingly, this result does not hold when the dependent variable is the traffic fatalities rate for women. Furthermore, the coefficient associated with motorway density is negative and statistically significant which confirms that the quality of transport infrastructure has a significant effect on road safety, as found in Jamroz (2012).
Another result of our analysis is that the vehicles-kilometer driven variable is not statistically significant. In the line of Li et al. (2012), more traffic on the roads implies higher exposure to accidents, but this effect may be partially compensated for by lower speeds (and therefore less severe accidents) due to congestion.
Results for the geographical variables suggest that traffic fatalities are higher in Eastern countries. This finding is surprising, taking into account that, as we have stressed in previous pages, these countries are known as the ‘zero-tolerance’ countries within EU, due to stricter BAC limits laws implemented. Factors such as their higher levels of alcohol consumption and relatively lower alcohol prices due to the lowest tax rates (see Popova et al., 2007, Rocakova-Filemon & Eksler, 2008; Solov’ev, 2016), and, mainly, a lack of an appropriate enforcement-sanctioning system of drink-driving legislation (as Podda, 2102 evidences), may help to explain this finding. In this sense, we believe that the case of Czech Republic particularly illustrates this point, because, as this author explains, this country was a pioneer implementing a zero BAC limit in 1953, while however, systematic breath testing was not introduced until January 2010.
12
TABLE 6. Estimates with different dependent variables (negative binomial with an AR-1 distribution)
Independent variables
Dependent variable: Traffic fatalities per billion
passengers-km (all)
Dependent variable: Traffic fatalities per billion passengers-km
(male)
Dependent variable: Traffic fatalities per billion
passengers-km (female)
Motorization -0.0009 (0.0005)* -0.0010 (0.0004)** -0.0003(0.007)
GDP per capita 0.000013 (0.00002) 0.00002 (0.00002) 0.00002 (0.00003)
GDP per capita2 -2.20e-10 (2.41e-10) -2.48e-10 (2.42e-10) -4.98e-10 (4.40e-10)
Motorway density -0.27 (0.08)*** -0.25 (0.08)*** -0.30 (0.12)***
Vehicles-km driven -6.31e-06 (0.00003) -4.20e-06 (0.00002) -0.00001 (0.00004)
Young 0.08 (0.03)** 0.08 (0.03)** 0.07 (0.05) Point system -0.02 (0.02) -0.02 (0.02) -0.03 (0.04) Speed limits 0.06 (0.03)* 0.06 (0.03)* 0.07 (0.03)* Longitude -0.05 (0.02)** -0.04 (0.02)* -0.05 (0.02)** Latitude 0.03 (0.04) 0.02 (0.04) 0.04 (0.04) BAC 1.78 (1.31) 1.58 (1.32) 1.56 (1.38) Alcohol_consumption 0.04 (0.01)*** 0.05 (0.01)*** 0.01 (0.02) Alcohol_age 0.11 (0.27) 0.15 (0.27) 0.07 (0.2) Alcohol_price -0.008 (0.003)*** -0.008 (0.003)*** -0.01 (0.005)*** Intercept -7.65 (8.33) -8.89 (8.46) -9.79 (8.97)
Test joint sign 72.07*** 82.99*** 42.03***
Breusch-Pagan/Cook-Weisberg test for heteroscedasticity (Ho: Constant variance) 155.80*** 110.11*** 79.91*** Wooldridge test – autocorrelation (Ho: First-order autocorrelation) 370.87*** 166.16*** 196.62*** Number of observations 294 267 267
Note 1: Standard errors in brackets.
Note 2: Statistical significance at 1 per cent (***), 5 per cent (**), 10 per cent (*).
TABLE 7. Estimates with different explanatory variables (negative binomial with an AR-1 distribution)
Independent variables Dependent variable: Traffic fatalities per billion passengers-km (all)
(1) (2) (3) (4)
Motorization -0.0006 (0.0003)* - - -
GDP per capita 6.60e-06 (0.00001) 1.28e-06 (0.00001) 0.00001 (0.00001) -5.15e-06 (7.25e-06)
GDP per capita2 -1.59e-10 (1.66e-10) -1.21e-10 (1.76e-10) -2.20e-10 (2.17e-10) -
Motorway density -0.33 (0.05)*** -0.33 (0.06)*** - -
Vehicles-km driven -5.27e-06 (0.00002) -3.90e-06 (0.00002) -3.61e-06 (0.00002) -3.81e-06 (0.00003)
Young - - 0.13 (0.03)*** 0.13 (0.03)*** Point system -0.02 (0.01) -0.02 (0.02) -0.03 (0.03) -0.02 (0.02) Speed limits 0.05 (0.02)** 0.06 (0.02)** 0.06 (0.02)** 0.06 (0.02)** Longitude - - - - Latitude - - - - BAC 3.26 (1.18)*** 3.15 (1.17)*** 2.62 (1.17)** 2.74 (1.17)*** Alcohol_consumption 0.03 (0.01)*** 0.03 (0.01)*** 0.04 (0.01)** 0.04 (0.01)** Alcohol_age 0.18 (0.26) 0.17 (0.26) 0.39 (0.25) 0.39 (0.25)
13
Alcohol_price -0.01 (0.002)*** -0.01 (0.002)*** -0.01 (0.003)*** -0.01 (0.004)***
Intercept -6.31 (6.90) -6.33 (6.91) -13.09 (6.83)* -12.90 (6.82)*
Test joint sign 181.63*** 144.01*** 40.48*** 40.48***
Breusch-Pagan/Cook-Weisberg test for heteroscedasticity (Ho: Constant variance) 160.46*** 133.31*** 116.21*** 11.95*** Wooldridge test – autocorrelation (Ho: First-order autocorrelation) 370.87*** 386.84*** 422.41*** 484.52*** Number of observations 294 294 294 209
Note 1: Standard errors in brackets.
Note 2: Statistical significance at 1 per cent (***), 5 per cent (**), 10 per cent (*).
Note 3: In regressions (1) and (2) the variable Young is not included because the model does not converge to any value with this variable.
The variable for the percentage of young population is positive and statistically significant which confirms that younger population are subject to higher risk exposure. Furthermore, the speed limits variable is positive and statistically significant so that traffic fatalities are lower in countries with stricter limits. Note here that this variable is not statistically significant when the dependent variable is the traffic fatality rate for women.
As for the alcohol related variables, the maximum BAC variable is always positive. However, it is only statistically significant in the regressions that exclude the geographic variables, motorization or motorway density. Note that the correlation of the BAC variable with these other variables is about 0.50. Hence, such high correlation may explain why we do not obtain a statistically significant value when we consider all explanatory variables. Overall, our results suggest that the imposition of strict BAC rates is effective in reducing traffic fatalities. This is in line of what it is found in previous studies (Dee, 2001; Eisenberg, 2003 and specifically, Albalate, 2008 for the EU).
Although this finding should be smoothed by the fact that, according to previously analyzed results regarding to Eastern members (with stricter BAC laws in force), it seems that lower BAC limits, applied exclusively without other support policies, do not necessary lead to a better road safety outcome.
In terms of elasticities, a ten percent increase in the BAC rates allowed lead to a 7 percent increase in traffic fatalities. Such values increase up to 11 percent in the regressions that exclude variables correlated with BAC rates. In contrast, we do find evidence in favor of the effectiveness of the policy related with the imposition of stricter legal age rules for purchasing.
The alcohol consumption variable is positive and statistically, supporting the well-known hypothesis that alcohol consumption is a main cause of RTA as posited by Britton et al. (2003), Rehm et al. (1996) and Skog (2001a, 2001b). In terms of elasticities, a ten percent increase in alcohol consumption lead to about 5 percent increase in the traffic fatalities rate.
Note also that interesting result is that the variable of alcohol consumption is not statistically significant when we consider the traffic fatality rate for women. This result
14
corroborates previous findings from other studies as Fitzgerald et al. (2016), related to how changes in per capita consumption in Europe are largely driven by changes in male and drinking gender differences may relate to differences in risk taking by gender.
Finally, as we had anticipated following previous studies by Chaloupka et al. (2002) and Lhachimi et al. (2012), the variable for the price of alcohol is negative and statistically significant. In terms of elasticities, a ten percent increase in the price of alcoholic beverages lead to a 7 percent reduction in traffic fatalities.
5. CONCLUSIONS
With the purpose of developing evidence that provide support to the application of alcohol control policies in EU, in the current paper we have explored the econometric association between alcohol consumption and traffic fatality rates per capita, controlled by a set of moderator variables. This is, in fact, the most in-depth empirical evaluation of the topic conducted to date both as to the number of control variables used and the number of countries taken into consideration (EU28). The wide panel of countries used and their wide ranging socio-economic, geographic circumstances, along with the large number of control variables used, allows a degree of optimism as to the possibility of extrapolating the main findings regarding the effects of alcohol and the policies to prevent alcohol abuse to areas outside the EU and even outside Europe.
The conclusions are robust irrespective of the estimation method used. They specifically show a clear relationship between alcohol consumption by the population and a higher mortality rate on the roads, and this alone would legitimize the existence of alcohol policies. This relationship may be affected by the economic, geographical, and cultural contexts. Specifically, the significance of the variable of longitude may suggest it. Furthermore, the alcohol consumption variable is not relevant when we focus the attention on women.
The second research question addressed in the current study is related to an evaluation of the effectiveness of alcohol policies to reduce accident-related mortality. Our findings show that specific control strategies that seek to limit alcohol consumption are clearly effective in reducing traffic accidents, even more effective than other more general road safety strategies, such as speed limits.
To be specific, the results of this paper would support, a rise in the price of alcohol, through higher sales taxes, for example (in view of the significance of the Alcohol_price variable). This is an interesting proposition if we bear in mind the need that certain EU members have to increase their indirect taxes on food & beverages in the current economic situation in order to comply with the public deficit requirements imposed by Brussels (see for example, Fernandes and Mota, 2011 on the differing performance concerning deficit criteria shown by certain southern and peripheral European countries). Finally, regarding safety policy, our findings agree with prior studies that support a reduction in the legal BAC limits.
15
The authors would like to express their gratitude to the Dirección General de Tráfico (Spanish Road Traffic Directorate General) for the human and financial resources that it provided for this study (grant reference: SPIP20141274).
REFERENCES
Albalate, D. 2008. Lowering blood alcohol content levels to save lives: the European experience. Journal of Policy Analysis and Management, 27, 20-39.
Albalate, D., Bel, G. 2012. Motorways, tolls, and road safety: Evidence from Europe’. SERIEs: Journal of the Spanish Economic Association 3, 457-473.
Alcañiz, M., Santolino, M., Ramon, L. 2016. Drinking patterns and drunk-driving behaviour in Catalonia, Spain: a comparative study. Transportation research part F: traffic psychology and behaviour, 42, 522-531.
Anbarci, N., Escaleras, M., Register, C., 2006.Traffic Fatalities and Public Sector Corruption. Kyklos 59, 327-344.
Bartl, G., Esberger, R. 2000. Effects of lowering the legal BAC-limit in Austria. In: Laurell & Schlyter (eds.). Alcohol, Drugs and Traffic Safety - T2000. Proceedings of the 15th International Conference on Alcohol, Drugs and Traffic Safety, Stockholm. Bernhoft, I. M., Behrensdorff, I. 2003. Effect of lowering the alcohol limit in Denmark.
Accident Analysis and Prevention, 35, 515-525.
Begg, D., Brookland, R., Connor, J. 2016. Associations of Repeated High Alcohol Use with Unsafe Driving Behaviors, Traffic Offences, and Traffic Crashes among Young Drivers: Findings from the New Zealand Drivers Study. Traffic Injury Prevention, In-press. DOI: 10.1080/15389588.2016.1224345.
Blais, E., Bellavance, F., Marcil, A., Carnis, L. 2015. Effects of introducing an administrative 0.5% Blood Alcohol Concentration limit on law enforcement patterns and alcohol-related collisions in Canada. Accident Analysis & Prevention, 82, 101-111.
Bloomfield, K., Stockwell, T., Gmel, G., Rehn, N. 2003. International comparisons of alcohol consumption. Alcohol Research and Health, 27, 95-109.
Brady, J. E., Li, G. 2014. Trends in alcohol and other drugs detected in fatally injured drivers in the United States, 1999–2010. American journal of epidemiology, 179, 692-699.
Britton, A., Nolte, E., White, I. R., Grønbæk, M., Powles, J., Cavallo, F., McPherson, K. 2003. A comparison of the alcohol-attributable mortality in four European countries. European Journal of Epidemiology, 18, 643-652.
Callaghan, R. C., Gatley, J. M., Sanches, M., Benny, C., Asbridge, M. 2016. Release from drinking-age restrictions is associated with increases in alcohol-related motor vehicle collisions among young drivers in Canada. Preventive Medicine, 91, 356-363.
Castillo-Manzano, Castro-Nuño, M. 2012. Driving licenses based on points systems: Efficient road safety strategy or latest fashion in global transport policy? A world wide meta-analysis. Transport Policy 21, 191–201.
16
Castillo-Manzano, J.I., Castro-Nuño, M., Fageda, X. 2013. Can health public expenditure reduce the tragic consequences of road traffic accidents? The EU-27 experience. European Journal of Health Economics, 15, 645-652.
Castillo-Manzano, J.I., Castro-Nuño, M., Fageda, X. 2014. Could being in the European Union save lives? An econometric analysis of the Common Road Safety Policy for the EU-27. Journal of European Public Policy 21, 211-229.
Chaloupka, F. J., Grossman, M., Saffer, H. 2002. The effects of price on alcohol consumption and alcohol-related problems. Alcohol Research and Health, 26, 22-34. Chang, L. Y., Lin, D. J., Huang, C. H., Chang, K. K. 2013. Analysis of contributory
factors for driving under the influence of alcohol: A stated choice approach. Transportation research part F: Traffic Psychology and Behaviour, 18, 11-20.
Cook, W. K., Bond, J., Greenfield, T. K. 2014. Are alcohol policies associated with alcohol consumption in low‐and middle‐income countries? Addiction, 109, 1081-1090.
Dee, T. S. 1999. State alcohol policies, teen drinking and traffic fatalities. Journal of Public Economics, 72, 289-315.
Dey, M., Gmel, G., Studer, J., Dermota, P., Mohler-Kuo, M. 2013. Beverage preferences and associated drinking patterns, consequences and other substance use behaviours. The European Journal of Public Health, 24, 496-501.
de Goeij, M. C., Suhrcke, M., Toffolutti, V., van de Mheen, D., Schoenmakers, T. M., Kunst, A. E. 2015. How economic crises affect alcohol consumption and alcohol-related health problems: A realist systematic review. Social Science and Medicine, 131, 131-146.
Eisenberg, D. 2003. Evaluating the effectiveness of policies related to drunk driving. Journal of Policy Analysis and Management 22, 249-274.
Elder, R. W., Shults, R. A., Sleet, D. A., Nichols, J. L., Thompson, R. S., Rajab, W., 2004. Task Force on Community Preventive Services. Effectiveness of mass media campaigns for reducing drinking and driving and alcohol-involved crashes: a systematic review. American Journal of Preventive Medicine, 27, 57-65.
Elias, W., Shiftan, Y. 2012. The influence of individual’s risk perception and attitudes on travel behavior. Transportation Research Part A: Policy and Practice, 46, 1241-1251. Elliott, S., Woolacott, H., Braithwaite, R. 2009. The prevalence of drugs and alcohol
found in road traffic fatalities: a comparative study of victims. Science and Justice, 49, 19-23.
Elvik, R. 2012. Speed limits, enforcement and health consequences. Annual Review of Public Health 33, 225-238.
Engels, R. C., Knibbe, R. A. 2000. Young people's alcohol consumption from a European perspective: risks and benefits. European Journal of Clinical Nutrition, 54, S52-S55. Fell, J., Voas, R. 2003. The effectiveness of reducing illegal blood alcohol concentration
BAC Limits for Driving: Evidence for Lowering the Limit to .05 BAC in Canada. Calverton, Md.: Pacific Institute for Research & Evaluation.
17
Fell, J. C., Voas, R. B. 2006. The effectiveness of reducing illegal blood alcohol concentration (BAC) limits for driving: evidence for lowering the limit to 0.05 BAC. Journal of Safety Research, 37, 233-243.
Fernandes, C. A. L., Mota, P. R. 2011. The roots of the Eurozone sovereign debt crisis: PIGS vs non-PIGS. Panoeconomicus, 58, 631-649.
Fitzgerald, N., Angus, K., Emslie, C., Shipton, D., Bauld, L. 2016. Gender differences in the impact of population-level alcohol policy interventions: evidence synthesis of systematic reviews. Addiction, 111, 1735–1747.
Hughes, K., Quigg, Z., Eckley, L., Bellis, M., Jones, L., Calafat, A., Kosir, M.. van Hasselt, N. 2011. Environmental factors in drinking venues and alcohol‐related harm: the evidence base for European intervention. Addiction, 106, 37-46.
Jamroz, K. 2012. The impact of road network structure and mobility on the national traffic fatality rate. Procedia-Social and Behavioral Sciences 54, 1370-1377.
Keall, M. D., Frith, W. J., Patterson, T. L. 2004. The influence of alcohol, age and number of passengers on the night-time risk of driver fatal injury in New Zealand. Accident Analysis & Prevention, 36, 49-61.
Knott, C. S., Coombs, N., Stamatakis, E., Biddulph, J.P. 2015. All cause mortality and the case for age specific alcohol consumption guidelines: pooled analyses of up to 10 population based cohorts. British Medical Journal, 350, h384. DOI: 10.1136/bmj.h384.
Kopits, E., Cropper, M. 2005. Traffic fatalities and economic growth. Accident Analysis and Prevention 37, 169-178.
Law, T. H., Noland, R. B., Evans, A. W. 2011. The sources of the Kuznets relationship between road fatalities and economic growth. Journal of Transport Geography, 19, 355-365.
Legrand, S.A., Gjerde, H., Isalberti, C., Van der Linden, T., Lillsunde, P., Dias, M.J., Gustafsson, S., Ceder, G., Verstraete, A.G. 2014. Prevalence of alcohol, illicit drugs and psychoactive medicines in killed drivers in four European countries, International Journal of Injury Control and Safety Promotion, 21, 17-28.
Lhachimi, S. K., Cole, K. J., Nusselder, W. J., Smit, H. A., Baili, P., Bennett, K., Pomerleau, J., McKee, M., Charlesworth, K., Kulik, M.C., Mackenbach, J.P., Boshuizen, H. 2012. Health impacts of increasing alcohol prices in the European Union: a dynamic projection. Preventive Medicine, 55, 237-243.
Li, H., Graham, D.J., Majumdar, A. 2012. The effects of congestion charging on road traffic casualties: A causal analysis using difference-in-difference estimation, Accident Analysis and Prevention 49, 366-377.
Lindo, J. M., Siminski, P., Yerokhin, O. 2016. Breaking the link between legal access to alcohol and motor vehicle accidents: Evidence from New South Wales. Health Economics, 25, 908–928. DOI: 10.1002/hec.3197.
Loeb, P. D. 1987. The determinants of automobile fatalities: with special consideration to policy variables. Journal of Transport Economics and Policy, 21, 279-287.
Mäkelä, P., Gmel, G., Grittner, U., Kuendig, H., Kuntsche, S., Bloomfield, K., Room, R. 2006. Drinking patterns and their gender differences in Europe. Alcohol and Alcoholism, 41, i8-i18.
18
Mann, R. E., Macdonald, S., Stoduto, G., Bondy, S., Jonah, B., Shaikh, A. 2001. The effects of introducing or lowering legal per se blood alcohol limits for driving: an international review. Accident Analysis and Prevention, 33, 569-583.
Martineau, F., Tyner, E., Lorenc, T., Petticrew, M., Lock, K. 2013. Population-level interventions to reduce alcohol-related harm: an overview of systematic reviews. Preventive Medicine, 57, 278-296.
Mathijssen, M. P. M. 2005. Drink driving policy and road safety in the Netherlands: a retrospective analysis. Transportation Research Part E: Logistics and Transportation Review, 41, 395-408.
McCarthy, P. 2005. Alcohol, public policy and highway crashes. Journal of Transport Economics and Policy, 39, 109-125.
Nishitateno, S., Burke, P. J. 2014. The motorcycle Kuznets curve. Journal of Transport Geography, 36, 116-123.
Norstrom, T., Laurell, H. 1997. Effects of the lowering of the legal BAC limit in Sweden. Alcohol, drugs and traffic safety, 87-94.
Ogeil, R. P., Gao, C. X., Rehm, J., Gmel, G., Lloyd, B. 2016.Temporal changes in alcohol-related mortality and morbidity in Australia. Addiction, 11, 626–634.
O'Malley, P. M., Wagenaar, A. C. 1991. Effects of minimum drinking age laws on alcohol use, related behaviors and traffic crash involvement among American youth: 1976-1987. Journal of Studies on Alcohol, 52, 478-491.
Orsi, Ch., Bertuccio, P., Morandi, A., Levi, F., Bosetti, C., La Vecchia, C. 2012. Trends in motor vehicle crash mortality in Europe, 1980-2007. Safety Science, 50, 1009-1018. Podda, F. 2012. Drink Driving: Towards Zero Tolerance, European Transport Safety Council (ETSC). Brussels. Accesible at http://etsc.eu/drink-driving-towards-zero-tolerance/.
Plunk, A. D., Cavazaos‐Rehg, P., Bierut, L. J., Grucza, R. A. 2013. The persistent effects of minimum legal drinking age laws on drinking patterns later in life. Alcoholism: Clinical and Experimental Research, 37, 463-469.
Popova, S., Rehm, J., Patra, J., Zatonski, W. 2007. Comparing alcohol consumption in central and eastern Europe to other European countries. Alcohol and Alcoholism, 42, 465-473.
Rehm, J., Ashley, M. J., Room, R., Single, E., Bondy, S., Ferrence, R., Giesbrecht, N. 1996. On the emerging paradigm of drinking patterns and their social and health consequences. Addiction, 91, 1615-1621.
Rehm, J., Greenfield, T. K., Rogers, J. D. 2001. Average volume of alcohol consumption, patterns of drinking, and all-cause mortality: results from the US National Alcohol Survey. American Journal of Epidemiology, 153, 64-71.
Rehm, J., Rehn, N., Room, R., Monteiro, M., Gmel, G., Jernigan, D., Frick, U. 2003. The global distribution of average volume of alcohol consumption and patterns of drinking. European Addiction Research, 9, 147-156.
Rocakova-Filemon, P., Eksler, V. 2008. Evaluation of the 0.0 BAC limit for drivers of road vehicles in Czech Republic. Slovakia, Hungary and Croatia, Deliverable, 4.
19
Police Enforcement Policy and Programmes on European Roads Contract No: 019744 Working Paper 41.
Room, R., Mäkelä, P., Benegal, V., Greenfield, T. K., Hettige, S., Tumwesigye, N. M., Wilsnack, R. 2012. Times to drink: cross-cultural variations in drinking in the rhythm of the week. International Journal of Public Health, 57, 107-117.
Ruhm, C. J. 1996. Alcohol policies and highway vehicle fatalities. Journal of Health Economics, 15, 435-454.
Saar, I. 2015. Do alcohol excise taxes affect traffic accidents? Evidence from Estonia. Traffic Injury Prevention, 16, 213-218.
Scott-Parker, B., Watson, B., King, M. J., Hyde, M. K. 2014. “I drove after drinking alcohol” and other risky driving behaviours reported by young novice drivers. Accident Analysis and Prevention, 70, 65-73.
Shults, R. A., Elder, R. W., Sleet, D. A., Nichols, J. L., Alao, M. O., Carande-Kulis, V. G. 2001. Reviews of evidence regarding interventions to reduce alcohol-impaired driving. American journal of preventive medicine, 21, 66-88.
Skog O. J. 2001a. Alcohol consumption and mortality rates from traffic accidents, accidental falls, and other accidents in 14 European countries. Addiction, 96, 49–58. Skog, O. J. 2001b. Alcohol consumption and overall accident mortality in 14 European
countries. Addiction, 96, 35-47.
Skog, O. J. 2003. Alcohol consumption and fatal accidents in Canada, 1950– 98. Addiction, 98, 883-893.
Solov’ev, A. M. 2016. Comparative rate of alcohol consumption in European countries. Studies on Russian Economic Development, 27, 94-100.
Subbaraman, M. S., Kerr, W. C. 2013. State panel estimates of the effects of the minimum legal drinking age on alcohol consumption for 1950 to 2002. Alcoholism: Clinical and Experimental Research, 37, E291-E296.
Tay, R. 2005. The effectiveness of enforcement and publicity campaigns on serious crashes involving young male drivers: Are drink driving and speeding similar?. Accident Analysis and Prevention, 37, 922-929.
Taylor, B., Irving, H. M., Kanteres, F., Room, R., Borges, G., Cherpitel, C., Greenfield, T., Rehm, J. 2010. The more you drink, the harder you fall: a systematic review and meta-analysis of how acute alcohol consumption and injury or collision risk increase together. Drug and Alcohol Dependence, 110, 108-116.
Taylor, B., Rehm, J. 2012. The relationship between alcohol consumption and fatal motor vehicle injury: high risk at low alcohol levels. Alcoholism: Clinical and Experimental Research, 36, 1827-1834.
Treno, A. J., Marzell, M., Gruenewald, P. J., Holder, H. 2014. A review of alcohol and other drug control policy research. Journal of studies on alcohol and drugs, 75, 98-107. Voas, R. B., Tippetts, A. S., Fell, J. C. 2003. Assessing the effectiveness of minimum legal drinking age and zero tolerance laws in the United States. Accident Analysis and Prevention, 35, 579-587.
Vukina, T., Nestić, D. 2015. Do people drive safer when accidents are more expensive: Testing for moral hazard in experience rating schemes. Transportation Research Part A: Policy and Practice, 71, 46-58.
20
Wagenaar, A. C., Maldonado-Molina, M. M., Ma, L., Tobler, A. L., Komro, K. A. 2007. Effects of legal BAC limits on fatal crash involvement: analyses of 28 states from 1976 through 2002. Journal of Safety Research, 38, 493-499.
Wagenaar, A. C., Livingston, M. D., Staras, S. S. 2015. Effects of a 2009 Illinois alcohol tax increase on fatal motor vehicle crashes. American Journal of Public Health, 105, 1880-1885.
Warner, H. W., Forward, S. 2016. The effectiveness of road safety interventions using three different messages: Emotional, factual or a combination of both messages. Transportation research part F: Traffic Psychology and Behaviour, 36, 25-34.
Watling, H., Armstrong, K. 2015. Exploring the influences of country-level factors on mature-aged women’s drink driving attitudes. Transportation Research Part F: Traffic Psychology and Behaviour, 30, 57-65.
Wells, S., Macdonald, S. 1999. The relationship between alcohol consumption patterns and car, work, sports and home accidents for different age groups. Accident Analysis and Prevention, 31, 663-665.
Wilsnack, R. W., Vogeltanz, N. D., Wilsnack, S. C., Harris, T. R. 2000. Gender differences in alcohol consumption and adverse drinking consequences: cross‐cultural patterns. Addiction, 95, 251-265.
World Health Organization (WHO). 2009. Evidence for the Effectiveness and Cost-Effectiveness of Interventions to Reduce Alcohol-Related Harm. Geneva. Switzerland. Zador, P., Krawchuk, S., Voas, R. 2000. Alcohol related relative risk of driver fatalities and driver involvement in fatal crashes in relation to driver age and gender: An update using 1996 data. Journal of Studies of Alcohol, 61, 387–395.