Knowledge, Innovation, Agglomeration and Regional
Convergence in the EU: Motivating Place-Based Regional
Intervention
Gianni Guastella
*– Universistà Cattolica, Piacenza (IT)
Francesco Timpano – Università Cattolica, Piacenza (IT)
*
Corresponding Author
Address: Via Emilia Parmense 84, 29122, Piacenza (PC), Italy. Email: [email protected]
1 Abstract
The accumulation of knowledge, human capital and agglomeration are indicated as prominent sources of externalities. Therefore, this study examines their contributions to the economic growth of regions in Europe, while accounting for non-linear and threshold effects as well as spatial dependence. The results highlight differentiated growth patterns for less and more developed regions with the effect of knowledge being considerable only in the latter group. The findings suggest that there is the potential for innovation and agglomeration in many less developed regions located in both the new member states (NMS) and the old member states (OMS). However, to reach sustained growth, structural change is necessary in these regions. We conclude that the existing gaps in the economic structure are deemed responsible for the persistence of income disparities. This reinforces the call for specific policy actions in catching-up regions, thus strengthening the arguments in favour of a place-based approach to regional policy.
JEL: R11, R15, 58.
Keywords: Agglomeration, Externalities, Regional Growth, Generalised Additive Models,
2
Introduction
After Solow’s (1956) model of growth and the conditional convergence hypothesis had dominated academic debates on regional growth and development for decades, the New Growth Theory (NGT) (Lucas, 1988; Romer, 1986) and the New Economic Geography (NEG) theory (Fujita et al., 1999; Krugman and Venables, 1996) refocused on the endogenous factors that drive regional development. The key elements of the NGT (i.e. human capital and innovation) and the NEG theory (i.e. agglomeration economies) integrate traditional Barro-type empirical models of regional growth (Barro, 1991) in which a large amount of regional growth was left unexplained by the estimated 2%
speed of convergence (Martin and Sunley, 1998).
The endogenous potential of regional development has also been the subject of focus in academic and policy debates regarding regional intervention (Barca et al., 2012). Such debates have been shaped by a set of influential reports, the most important of which include: the World Bank’s 2009 World Development Report (WDR), where traditional spatially-blinded policies are advocated; two OECD reports (OECD, 2009a, 2009b); and the Barca Report (Barca, 2009), which suggests the importance of place-based approaches to regional development. According to Barca et al. (2012), development policies have been primarily aimed at the provision of important infrastructures, regardless of their effective impact on territorial development. While such spatially-blinded policies have, in fact, promoted agglomeration and development in their respective regions; at the same time, they have caused marginalisation in more peripheral areas. Conversely, a place-based approach to regional policy is based on careful consideration of territory-specific resources and needs and focuses on the interaction between geography and institutions. Advocates of the place-based approach argue that agglomeration per se is neither necessary nor sufficient for growth (Garcilazo et al., 2010), and growth based on agglomeration is most likely unsustainable in the long run (Thissen and Van Oort, 2010). Thus, regional policy should work to exploit the endogenous potential by unveiling local externalities such as those related to local human capital and local innovation.
The reduction of economic and social disparities within the European Union (EU) was explicitly set as a goal in the European Treaty (Article 174). However, there has been widespread agreement among academics that policies aimed at reducing inequalities may hamper efficiency and ultimately, economic growth (Thissen and Van Oort, 2010). The WDR (World Bank, 2009) substantially shares this view, arguing that economic development will naturally be spatially unbalanced and that policies should not influence the relocation of firms in less developed areas, but
3 should promote integration (Gill, 2010). In fact, the aim of the EU regional policy is not that of reducing disparities by re-equilibrating production and income but that of providing place-specific answers to place-specific problems. In particular, this is achieved by removing the obstacles and creating favourable conditions for smart growth (European Commission, 2010).
In regard to this objective, the successful implementation of the EU regional policy requires careful consideration of two specific issues. First, the origins of spatial externalities and their contributions to economic development at the EU regional level need to be identified to determine the precise role of agglomeration economies in relation to other endogenous growth factors. According to the view expressed in the WDR (World Bank, 2009), agglomeration is, in fact, the primary driver of economic development, triggered by urbanisation economies in large and diversified cities and by localisation economies in small- and medium-sized specialised cities (Gill, 2010). Therefore, spatially blinded institutions and spatially connective infrastructures might help spread externalities to the benefit of all people (Deichmann et al., 2011). Second, concerning externalities not related to agglomeration, it is crucial to target regions where policy support is most needed due to structural barriers preventing and possibly impeding the genesis and propagation of such externalities.
Despite the numerous discussions involved in this policy debate, which is evidenced by the considerable number of journal articles published after the WDR, the OECD publications and the Barca Report (Buckley and Buckley, 2009; Farole et al., 2011; Harvey, 2009; Maringanti et al., 2009; Rigg et al., 2009; Rodríguez-Pose, 2010), minimal attention has been given to related empirical analyses. Therefore, this study analyses the origins of EU regional growth between 1995 and 2007 and emphasises the role of externalities mediated by agglomeration economies in addition to human capital and innovative activities. This study aims to ascertain the real contributions of agglomeration to overall regional growth by considering the varying nature of endogenous growth. For this purpose, a standard cross-regional Barro-type regression is extended by including proxy variables that are expected to indicate the contributions of agglomeration, innovation and human capital. As the primary goal is to study regional growth, the year 2007 (which marks the beginning of the financial crisis and the subsequent recession in many countries and regions) is selected as the last year of observation. Following a consolidated literature in regional growth, spatial externalities and spillovers are properly considered in the empirical model. Finally, semi-parametric estimators are employed to disentangle non-linear and threshold effects that characterise the relationship between growth on the one hand, and agglomeration, knowledge in the economy and innovation on the other hand.
4 The results can be summarised in the following three points. First, the evidence corroborates previous empirical results, indicating that regional growth in Europe is characterised by a convergence process. However, various regions converge at different speeds and toward different steady states. For example, a faster speed of convergence is generally found in less-developed regions. Second, the growth-agglomeration relationship displays an inverse U-shaped curve, which indicates that the effect of agglomeration on regional development is not always positive and, in some circumstances, agglomeration might even be undesirable. Conversely, the effect of human capital on regional growth exhibits quasi-linear effects as it becomes considerably larger after a given threshold. Third, in the case of innovation, the findings suggest that investments in regional innovative capacity translate into either beneficial growth when a region’s technological gap is high or uncertainty in regions that are already leaders in innovation.
These results have important policy implications. Beyond empirically demonstrating that agglomeration per se is neither necessary nor sufficient for regional growth, at least when accounting for other potential endogenous factors of regional growth, the evidence suggests that regional policy intervention might be crucial in helping the least-developed regions technologically catch up with other regions. In absence of such regional intervention, these regions will most likely remain marginalised by the smart development process that wealthier EU regions are already experiencing.
The remaining of the paper is structured as follows. The next section examines the theoretical and empirical literature related to externalities in regional growth. The third section describes the dataset while the fourth section discusses the empirical specifications of the model in detail and summarises the results. The final section concludes the paper and provides several policy implications.
The origins of regional growth
The Barro-type regression approach (Barro, 1991) is the reference for the empirical analysis regarding the stream of regional growth and convergence. This approach is directly derived from Solow’s (Solow, 1956) growth model in which (under the simplifying hypothesis of decreasing returns to production factors) economies will converge toward a unique steady-state per capita income level at a declining growth rate. The test for (absolute) convergence relies on a cross-regional regression of per capita income growth over a given period of time (based on the initial level of per capita income). In this case, a negative and significant coefficient related to initial income is expected. In his series of articles, Quah contended that the approach was adequate to test convergence (as evidence of convergence was also found in the case of increasing economic
5 disparities) and suggested alternative methods based on transitional analysis (1993; 1993; 1996a, 1996b, 1996c). Despite the results of several cross-sectional analyses that agreed on the estimate regarding the speed of convergence (between 1% and 3%), among the EU regions over the last several decades, the study of income distribution dynamics has pointed toward income polarisation and multimodal distribution (Magrini, 1999).
Martin and Sunley (1998) reviewed the theoretical and empirical debates on regional convergence, and discussed the extent to which the empirical models of regional development have been influenced by endogenous growth theories. Indeed, both the NGT and the NEG theory are opposed to neoclassical growth models, assuming that endogenous mechanisms of development are mediated by either knowledge spillovers (Lucas, 1988), investments in innovative activities (Aghion and Howitt, 1992) or spatial concentrations of economic activities (Krugman and Venables, 1996). In the NGT, the predicted long-term outcome is divergence or conditional convergence.1 Likewise, the predicted outcome of the NEG model is divergence in the form of core-periphery patterns. Baldwin and Forslid (2000), for instance, integrated the NEG theory in an endogenous growth model and found that the long-run equilibrium is characterised by core-periphery patterns. In European regions, such outcomes are more likely confirmed by the empirical evidence of club convergence in Quah (1996b) and by the evidence of core-periphery patterns in the spatial distributions of income and production (Le Gallo and Ertur, 2003).
The empirical literature associating regional development to endogenous growth factors is large and still expanding. In the following section, this literature will be reviewed with special focus on two aspects: 1) the different hypotheses implicit in models of endogenous regional development and 2) the empirical testing of the predicted outcomes.
Human Capital
Lucas (1988) was among the precursors of endogenous growth and most of the importance given to human capital most likely originates from his model of growth in which production is characterised by human capital accumulation and externalities are generated on the job or through learning by doing (Lucas, 1988). Increasing marginal productivity of human capital implies that no convergence can be predicted and that the opposite might be true; that is, variation in growth rates across the economies might be prolonged over time. Cross-country evidence presented in Mankiw et al.
1 An extensive discussion regarding the different implications of theoretical growth models based on the convergence
6 (1992) supports this hypothesis. More specifically, the authors proposed an augmented Solow model that included the human capital variable and derived, accordingly, a modified convergence test. Their results indicate that differences in equilibrium per capita income levels can be explained by human capital endowments.
At the regional level, similar tests were proposed. Badinger and Tondl (2003) used an empirical specification derived from a growth accounting framework and considered trade, human capital and innovation as sources of endogenous growth. The effect of human capital was found to be positive and significant and there was evidence that higher levels of human capital can facilitate technological catch-up. López-Bazo et al. (2004) extended the framework of Mankiw et al. (1992) to account for inter-regional externalities and tested the convergence hypothesis at the EU regional level. They found that both physical and human capital accumulation are responsible for externalities that significantly contribute to regional growth. Similarly, Ertur and Koch (2006) explored the role of spatial externalities in regional growth using a revised version of Mankiw et al. (1992) for an analysis of regional growth in Europe and found evidence indicating a positive correlation between human capital and growth. Moreover, Cheshire and Magrini (2000) analysed regional growth determinants by using distributional dynamics and obtained similar results, thus suggesting that differences in the endowment of human capital can explain both the static and dynamic characteristics of income disparities.
In general, empirical evidence on the relationship between human capital and regional development corroborates the hypothesis that human capital positively impacts regional development and hence, it drives regional growth. However, more recent evidence posits indications of a threshold effect on this relationship (Basile, 2008). Such evidence is consistent with theoretical growth models based on human capital such as that by Azariadis and Drazen (1990). In this framework, returns to investments in human capital turn positive only after a sufficient pool of knowledge has been accumulated. Finally, Basile (2008) concluded that the contribution of human capital to development is larger when both the region and its neighbours are well-endowed in human capital.
Research and Innovation
Formal models of endogenous growth generally focus on the contribution of knowledge in production. In the case of human capital, it is assumed that knowledge is embedded in people and translates into productivity gains through the contributions of educated workers in the production process. Obviously, not all knowledge is embedded in people. Some knowledge can be codified, formalised and even materialised through product and process innovations. At the heart of the
7 endogenous growth models, based on innovation, lies the hypothesis that new products and processes can provide firms with monopolistic power (Aghion and Howitt, 1992), which guarantees market returns and offers incentives to invest in the knowledge sector. At the aggregate level, production is characterised by increasing returns and, in the long run, income distribution will be determined by regional innovative capacities and possibly by persistent disparities due to technological gaps.
The empirical test for this hypothesis is based on an extension of the growth regression model, which includes the measure of innovation. Fagerberg and Verspagen (1996), the first to propose a test of this hypothesis based on EU regional data, measured innovative capacity by means of R&D-related indicators. They concluded that technological gaps indeed explained the persistence of disparities in per capita GDP. Adopting a similar empirical specification, Fagerberg et al. (1997) reached the same conclusion, however based on a different sample of regions. More recently, Rodríguez-Pose and Crescenzi (2008) studied the issue using data covering all regions in the EU25, and found evidence of a positive relationship between regional growth and innovation. Sterlacchini (2008), based on EU15 regional data, examined the contributions of both human capital and innovation and concluded that the effect of human capital was constantly positive; whereas, a positive effect of innovation only showed in more developed regions. Moreover, evidence from a spatial descriptive analysis (Verspagen, 2010) posited a hierarchy in territorial innovation that resembles the spatial distribution of regional productivity.
In general, empirical evidence asserts the positive effect of innovation on growth at the territorial level (as predicted by the theory); however, scale effects need to be taken into account when considering the contributions of innovations on local development. On one hand, knowledge itself is an input for knowledge production (Dosi, 1988). Regions with a more substantial knowledge base and more experience in innovative activities have greater opportunities to innovate, which eventually translate into higher rates of growth. On the other hand, when considering innovation by imitation, a certain absorptive capacity is indeed necessary to successfully replicate another’s innovations as well as benefit from knowledge externalities (Cohen and Levinthal, 1989). Accordingly, investments in innovation, at the regional aggregate level, are deemed necessary and also represent a pre-condition for prosperous knowledge diffusion (Fagerberg et al., 1997). Deep technological gaps also slow and sometimes impede knowledge spillovers between regions. Furthermore, threshold effects have been identified in a number of empirical studies (Crescenzi, 2005; Fagerberg and Verspagen, 1996; Sterlacchini, 2008). Alexiadis and Tomkins (2010) proposed a theoretical growth model in which the regional absorptive capacity was negatively related to the
8 technological gap. After testing the hypothesis over the sample of regions in the EU27, they found evidence in support of this hypothesis.
Agglomeration
While the NGT literature does not show much concern for the role of knowledge-based externalities, in the NEG literature (Krugman, 1991; Krugman and Venables, 1995), more attention is oriented toward the benefits associated with the multiple co-location of economic activities. These benefits are characterised as pecuniary externalities and, more precisely, they are related to labour market pooling.
Goods are produced in a Dixit–Stiglitz monopolistic competition framework with scale economies, which allows the profits of each firm in the area to grow with the increasing number of firms that localise production in the same area. Equilibrium is concurrently determined by two forces in the model: 1) agglomeration economies promote co-location of activities in one single area and the divergence between territories; 2) increasing transportation costs favour the spreading of economic activities and a more even distribution of production, as with low transportation costs, it becomes increasingly convenient for firms to collocate in a single area.
Regarding the EU with respect to the NEG models, Krugman and Venables (1996) argued that national barriers in Europe have discouraged the extension of industrial districts beyond national borders. They also stated that the manufacturing sector in Europe is, in fact, much less spatially concentrated compared with the US and the decrease in transportation costs, which has followed the abolition of trade barriers, is expected to significantly promote agglomeration in the long run. Although the long-term welfare effect of integration is predicted to be positive, the level of inequality, particularly between regions, is expected to increase with the rise of economic agglomeration. In this regard, Gardiner et al. (2011) examined the national growth vs. regional inequality trade-off for Europe and found mixed evidence, primarily depending on the spatial scale unit used to measure agglomeration as well as on the same definition of agglomeration.
Overall, the core-periphery pattern suggested by the NEG theory seems capable of interpreting the geographical shape of the productivity in Europe. Using exploratory spatial data analysis to study the distribution of production and income in Europe, Le Gallo and Ertur (2003) found evidence of spatial concentration of economic activities at the regional level compatible with a generic core-periphery pattern. Ciccone (2002) studied the link between regional agglomeration, as proxy by employment density, and regional performance, as measured by total factor productivity. The empirical evidence indicated that the relationship is both positive and sizable.
9 Notwithstanding the evidenced correlation between agglomeration and territorial development, there is still much debate regarding the effect of agglomeration on growth at the regional level. Crozet and Koenig (2005) analysed the effect of spatial concentration within regions on growth and found evidence of a positive relationship; however, the case of spatial concentration between regions was not discussed. Dall’erba and Hewings (2003) presented a theoretical and empirical analysis for the case of infrastructure investments in European regions and studied both within region and between regions effects. Their results indicated that a decline in transportation costs (induced by improvements in the inter-regional infrastructure network) benefited aggregate country growth at the price of divergence; whereas, investments in the intra-regional infrastructure network stimulated regional growth in depressed areas, but had a limited impact on country growth. Petrakos et al. (2011) estimated a growth model using agglomeration and accessibility as covariates and found that the coefficient estimates related to both variables were positive and significant. However, in this study, prominent characters of regional growth in Europe, such as spatial heterogeneity and spatial spillovers (Dall’erba and Le Gallo, 2008; López-Bazo et al., 2004; Pfaffermayr, 2012; Sardadvar, 2012) were not accounted for in the estimation. Conversely, the spatial effects were considered in the study by Bosker (2007), who focused on regional growth for a sample of 208 regions in the EU16 from 1977 to 2002. This study estimated the direct effect of agglomeration on growth as well as the indirect (spillover) effect of agglomeration on neighbouring regions’ growth. Regarding both effects, a negative relationship was found between agglomeration and growth, thus suggesting that negative externalities and agglomeration diseconomies (on average) prevail over the benefits of agglomeration.
A Comprehensive Framework
Widespread empirical literature has attempted to bridge the gap between predictions from various theoretical models of regional development and empirical evidence by proposing testable hypotheses to be included in the cross-regional growth regression framework. These hypotheses have largely focused on one or more drivers of regional growth suggested by theories; however, they have rarely considered all of the theories in a comprehensive manner. In fact, it can be argued that the lack of a theoretical background identifying the relationship between the different economic externalities is responsible for this oversight.
On one hand, externalities related to human capital and research investments are usually considered to be pure externalities; that is, benefits deriving from an unintended transfer of knowledge are not mediated by market mechanisms. The NGT models indeed are not concerned with the mechanism of knowledge diffusion, which is considered as a type of black box. Nevertheless, advances have
10 been made in this literature, starting from the seminal contribution by von Hippel (1994), who first defined knowledge as sticky, up to the more recent stream of literature under the name of
Geography of Innovation (Audretsch and Feldman, 2004). On the other hand, externalities in the
NEG models are referred to as pecuniary externalities; that is, they are mediated by markets. According to Krugman (1991), it is worth focusing on pecuniary externalities since ‘knowledge flows are invisible, [and] they leave no paper trail by which they may be measured and tracked’ (p. 53).
However, Krugman, approximately two decades after Geography and Trade, recognised that the NEG theories had become popular at the end of that period in which economic development was driven exactly by the market forces described in the NEG models (Krugman, 2011). Currently, the spatial concentration of economic activities in developed economies is mostly driven by intangible sources of externalities, such as knowledge spillovers, and less by market forces. Such externalities, by definition, are not bounded in space, however are more likely to cross administrative borders and cause cross-regional externalities. This argument clarifies why such a large body of regional growth literature, under the influence of new developments in spatial econometric methods (LeSage and Pace, 2009), has refocused on inter-regional spillovers (Lopez-Bazo et al., 1999; Le Gallo et al., 2003; Badinger et al., 2004; Guastella and Timpano, 2010; Cem Ertur and Koch, 2006; Dall’erba and Le Gallo, 2008). Conversely, the effect of agglomeration on regional growth has been considered only to a minor extent in empirical studies.
Despite the prominence gained by knowledge spillovers in academic debates on regional growth, it is surprising to note how the policy debate about regional development (which is described in the introduction) is still confined to the role of agglomeration economies. Moreover, it focuses on the policy implications derived from the NEG models, despite the constraints set by the questionable plausibility and credibility of these models (Martin and Sunley, 2011).
This study aims to bridge this gap in the empirical literature by testing the role of agglomeration on growth, and considering the influence of non-market externalities such as those related to human capital and innovative activities. As suggested by previous literature, the role of spatial externalities is appropriately considered in the model framework. Most importantly, instead of estimating the average effect of externalities on growth, non-linear relations are estimated to understand in which regions externalities are more important.
11 The dataset used in this study is part of the Eurostat Regional Database and includes all regions of the EU25. Statistical units are defined according to the NUTS I and NUTS II classifications. More specifically, in the case of Belgium, Greece, Germany and the UK, NUTS I classifications were considered, as most of the data from the Eurostat Regional Database utilises this level. In regard to the rest of the countries, NUTS II classifications were considered. Overall, the regional classification applied in this work is similar to that used by the Organisation for Economic Co-operation and Development (OECD)2 in its definition of Territorial Level 3 (TL3).
<Insert Table 1 here>
The empirical model used to test the contributions of agglomeration, knowledge in the economy and innovation to regional economic growth in Europe is the standard cross-regional growth regression. The dependent variable, the annual average growth of per capita GDP3 is measured from 1995 to 2007. Furthermore, the main independent variable is the log of per capita GDP in 1995. This base model is extended to include three additional variables related to: 1) agglomeration (AGG), 2) human capital and knowledge in the economy (KNE) and 3) innovation (INNO). We initially assume a linear relationship between regional growth and its determinants to disentangle which variable (among all the possible proxies) can represent the relationships in the most meaningful manner. Hence, the model in Equation (0) is estimated using alternative indicators after which the best combination of indicators is selected. These indicators are described in Table 1, in which the mean, standard deviation (SD) and correlations are also reported. To proxy agglomeration, we use the standard employment density indicator (EMPD), which is a measure of the potential for firms to take advantage of co-location in the neighbourhoods of other firms.4 At the EU regional level, a more precise measure of market potential has been produced in the European Spatial Planning Observation Network (ESPON) project: the accessibility indicator (ACCESS). This indicator reflects the centrality of a region with respect to all the other markets and weighs the economic sizes of these markets. Concerning human capital and knowledge economy, we use data on education attainment and the characteristics of the workforce. In the case of the former, we
2
For more information on the territorial classification adopted by the OECD, please refer to the following: http://www.oecd.org/dataoecd/60/35/42392313.pdf.
3 Millions of euros at 2000 prices. 4
This measure of agglomeration does not consider the extent to which the industry mix in the region is responsible for agglomeration externalities. It only examines the total employment in the region. Notably, there are different views regarding the conceptualisation of agglomeration economies, as reflected in a number of surveys and meta-studies (Melo et al., 2009; Beaudry and Schiffauerova, 2009; De Groot et al., 2009), which oppose specialisation to diversity and interest as well as the notion of related variety.
12 consider the percentages of enrolment in tertiary education (EDUC); whereas, in the latter case, the share of workers employed in Knowledge Intensive Business Services (KIS) indicates that the latter better interprets the contributions of knowledge and skills to regional productivity and also accounts for the contributions of high value-added services to regional production. Finally, to measure innovation, we use the two standard measures of innovative input (i.e. research and development expenditures in the percentage of the GDP (RED)) and output (i.e. the number of patents per millions of inhabitants (PATENTS)):
(0) ,2007 ,1995 1 2 3 ,1995 1 ln i ln i i i i i i i GDP
GDP AGG KNE INNO e
T GDP X .
As usual in these models, the coefficient is expected to be lower than zero, indicating conditional convergence. Following theoretical predictions, all values of [ 1, 2, 3] are expected to be larger than zero, evidencing the positive contributions of all the factors on growth. Furthermore, X is a set of control variables, which are described below, and e is the usual i.i.d. disturbance. i
Table 2 summarises the estimation results by alternatively using each indicator and considering agglomeration (Columns b and c), knowledge economy (Columns d and e) and innovation (Columns f and g) separately. In Column (a), the estimation result of a standard cross-regional regression is reported while in Column (h), we obtain the most significant and representative indicators. All of the independent variables are expressed in logs and in all of the models, we include two control variables for the economic structure (i.e. the share of workers in agriculture (AGRI) and manufacturing (MAN)) and two dummy variables to reflect the geo-political environment specific to each region. In regard to the latter, one is for regions in New Member States (NMS) and one is for regions in cohesion countries (COHESION). The results indicate that the coefficient associated with the initial income is estimated to be between −0.02 and −0.03, which corresponds to the estimated 2% speed of convergence in previous studies. In all of the models, the coefficient is strongly significant. In the base model in Column (a), the coefficient associated with the log of the share of agricultural workers is negative and highly significant, and the one associated with the log of the share of manufacturing workers is insignificant. The coefficient for the NMS dummy is also negative and significant; whereas, the one for the COHESION dummy is insignificant. Columns (b) and (c) add the effect of agglomeration economies to the basic specification. Of the two measures of agglomeration, both positively related to growth and only the market potential exhibited a significant coefficient. Likewise, of the two measures of human capital and knowledge in the economy, only the share of knowledge intensive workers exhibited significant
13 coefficients (Columns d and e). In this case, it is also worth noting that in the model in Column (e), the coefficient associated with the log of the share of agricultural workers became insignificant, denoting that this variable intrinsically reflects the composition of the regional economic structure. Concerning innovation, both the coefficients associated with the different measures were positive and significant and produced very similar results (Columns f and g). However, the use of patents resulted in a higher goodness of fit. In Column (h), in the same regression, we included the log of accessibility, the log of KIS workers share and the log of patents to assess their contributions to growth of agglomeration, human capital and knowledge in the economy as well as innovation within the same framework. Based on a linear specification, it was found that all of these factors positively contributed to regional growth. Moran’s index5 of spatial correlation was applied to the residuals of the model in Column (h) and the findings indicate a significant autocorrelation of residuals, thus suggesting the use of alternative models to handle spatial dependence.
<Insert Table 2 here>
As suggested by Basile and Gress (2004), the spatial correlation of residuals may result from pure spatial dependence as well as from model misspecification, particularly due to unaccounted non-linearity. Furthermore, there is a trade-off between spatial dependence and non-non-linearity. Hence, the next step is to model the relationship between regional growth, initial income, agglomeration, human capital and knowledge in the economy and innovation in a setting that considers non-linearity and threshold effects as well as spatial dependence. This goal can be achieved by borrowing the methodological approach from Basile (2008) and Basile et al. (2012). Moreover, following Wood (2006), some covariates are introduced as smooth terms into the model formulation in addition to the parametric part, thus resulting in a semi-parametric generalised additive model (GAM). The suggested specification is described in Equation 2. The only parts of the model that remain as parametric are the intercept and the control variables, while smooth functions s
· are used to approximate the non-linear relationship between growth and the other variables.(0)
,2007 ,19 1 95 2 ,19 3 4 95 1 ln ln ln ln ln , i i i i i i i i i i GDPs GDP s ACCESS s KIS s PATENTS
T GDP s LONG LAT X e
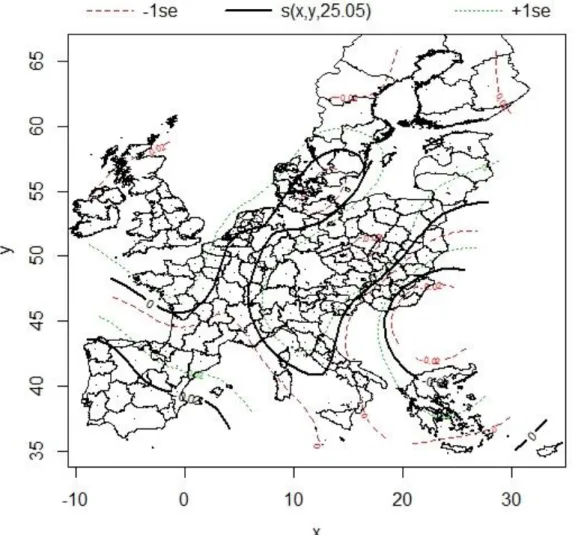
To deal with spatial heterogeneity and spatial dependence in the data, a spatial trend is introduced as a smooth function of the geographical coordinates (LONG and LAT). The spatial trend is
14 expected to capture the spatial heterogeneity (left unexplained by other model covariates) and account for non-observable regional factors that influence growth. The results in Table 3 indicate the estimates of two different models: one with the spatial component and the other without this component. The findings indicate that the model with the spatial component includes 25% more deviance compared with the model without the spatial component. Thus, the former model is preferred based on its generalised cross validation (GCV) score (Wood, 2006). In both models, the intercept and the control variables are included as parametric terms, whereas, the contributions of initial income, accessibility, the share of KIS workers and patents are estimated non-parametrically. In the former case, we report the estimated coefficient, t-statistic and p-value. In the latter case, we report the estimated degree of freedom, which summarises the degree of non-linearity, the F-statistic for the null hypothesis that the term can be excluded from the model and the related p-value. In both cases, the parametric terms are insignificant, with the exception of the intercept of the spatial model and the COHESION dummy in both models. Conversely, all of the non-parametric terms are statistically significant. However, the p-values related to KIS and ACCESS decrease considerably after the inclusion of the spatial component, which is highly significant.
<Insert Table 3 here>
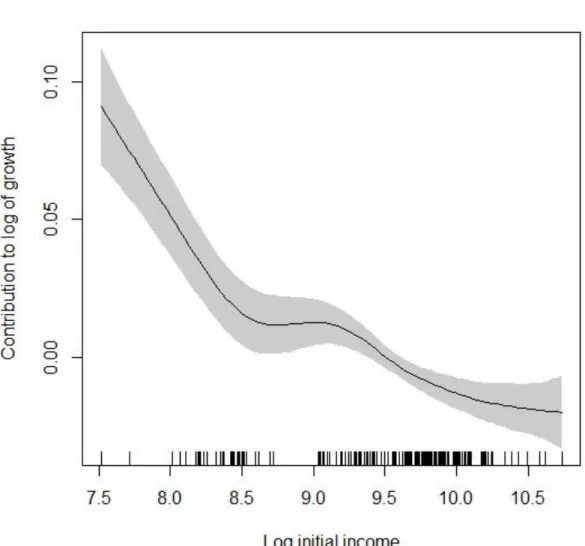
The advantage of a more flexible non-linearity over a simple linear specification is that it is not necessary to restrict the discussion to the average effect of an independent variable on the dependent variable, as the effect changes at each value of the independent variable. This can be graphically demonstrated by plotting the predicted contributions to growth from initial income, agglomeration, knowledge in the economy and innovation against the respective values of the variables. Relative to the spatial model only, Figures 1 to 4 map such relationships.
<Insert Figure 1 here>
As expected, the relationship between growth and initial income is negative. In Figure 1, it is possible to note two different slopes. First, the higher speed of convergence characterises the less-developed regions; namely, regions with the value of log income at 9, which is equivalent to the value of per capita income of approximately 8,000 euros at 2000 prices. Second, the lower speed of convergence describes the growth of the second group of regions; that is, the group of the most developed regions. Overall, this result confirms previous evidence regarding the presence of club convergence in Europe, as it has been shown that regions converge at different speeds and toward different steady-states.
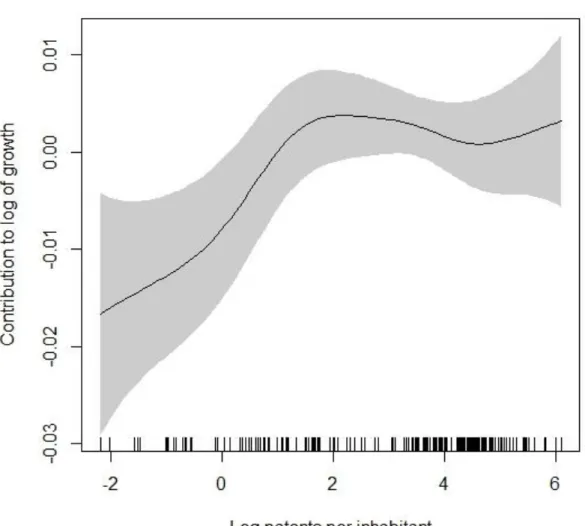
15 Considering the effect of innovation on regional growth, Figure 2 evidences the first phase, characterised by increasing returns to innovation, and the second phase in which adding innovative capacity does not contribute to regional growth. This result may appear to be in contrast to the literature, which has emphasised the presence of threshold effects in innovation related to the regional presence of a minimum pool of knowledge that enables the so-called absorptive capacity. In fact, this result is closely related to the use of patents as an innovative measure, as in most innovative locations where large firms and technical universities concentrate. Furthermore, more patent applications may represent a strategy to prevent duplications by competitors, with the consequence that the contribution of a single patent to regional productivity and growth becomes extremely limited. We distinguish the regions that produced less than six
e1.8 patents per inhabitant in the study period from the other regions, thus defining the first group as a cluster of regions with the potential to improve innovative capacity.<Insert Figure 3 here>
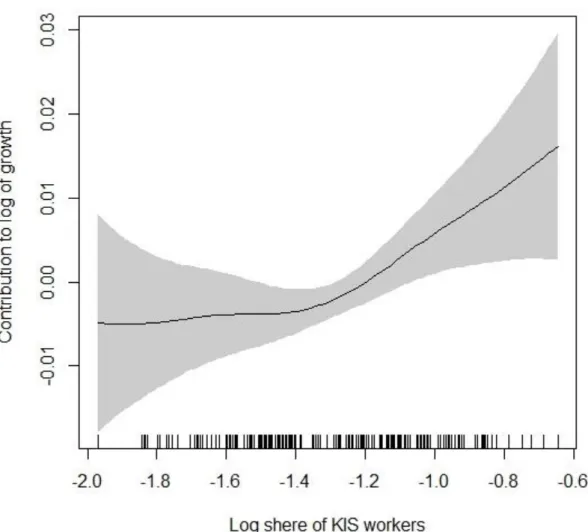
Figure 3 presents the contribution of knowledge to regional growth, characterised by the familiar threshold effect. The results indicate that the contribution to growth increases over time. This suggests that the primary knowledge base that roughly corresponds to the 0.3%
e1.3 of workers employed in KIS needs to be accumulated before knowledge becomes productive for the regional economy.<Insert Figure 4 here>
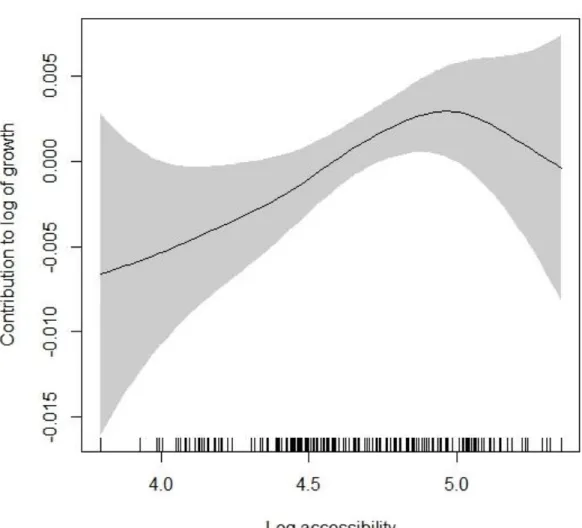
Figure 4 highlights the inverse U-shaped relationship that links agglomeration to regional growth. The contribution of agglomeration to regional growth is positive only for a selected group of regions (characterised by poor accessibility) and beyond this threshold, agglomeration diseconomies become more relevant. As the value of the accessibility indicator is measured according to the average EU level, the value of the threshold for the agglomeration indicator is not further discussed in this study.
<Insert Figure 5 here>
Finally, Figure 5 indicates the contribution of geography to regional growth by highlighting three levels. The main level crosses France and the northern EU countries, touches Italy and continues in the direction of Eastern Europe. The lower level covers Greece and the southern part of Hungary while the higher level covers Spain and Ireland.
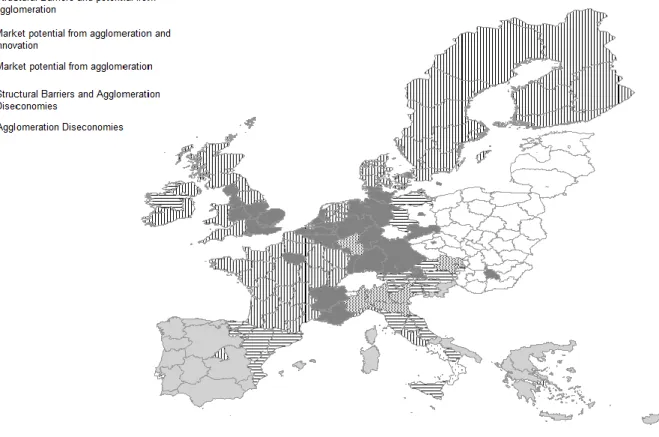
16 To describe (in a simple and meaningful manner) the information content extrapolated from the empirical analysis, the regions have been classified according to the marginal effects plotted in Figures 1–4. According to Figure 1, the regions belonging to the group in which the speed of convergence is the highest have been defined as convergence regions. Considering Figure 3, we distinguished a group of regions with structural barriers in which the structure of the economy and contribution of knowledge and human capital are insufficiently developed to ensure sustained growth. Based on Figure 2, we labelled the group of regions in which the contribution of innovation to growth is positive as regions with the potential for innovation, as the development of innovative capacity in these regions can effectively contribute to growth. Finally, according to Figure 4, we distinguished the regions subject to agglomeration economies from Figure 6.
<Insert Figure 6 here>
In contrast with the EU definition of convergence regions adopted by the European Commission, according to which southern Italy, Portugal and the majority of the regions in Spain and Greece are included,i regions in the convergence area (perhaps based on the definition provided in this study) are solely located in Eastern Europe. However, in many of these regions, the potential for growth induced by convergence is hampered by structural barriers. In particular, these regions lack the necessary knowledge to sustain smart growth as well as standard policy instruments that support workforce education. In contrast, solutions designed to speed up smart growth need to be enhanced and expanded at the territorial level. This can be achieved by addressing the reasons for such distances in the structural composition of the economy and focusing on the ability to enhance productivity based on human capital and knowledge.
The geographical scope of agglomeration economies appears to be quite extended in Europe, suggesting that many regions can still benefit from increasing their potential accessibility. This is the case in France (excluding Paris), some regions in Spain and Portugal, central and southern Italy, Austria, northern Germany, Ireland, western and northern UK and the northern EU countries. Furthermore, structural barriers appear in many of these regions, most notably in Spain, Portugal, Italy and Greece. Any potential growth caused by agglomeration economies in these regions is most likely moderated by the dearth of human capital and the regional economy. However, in some cases, this can be balanced by improvements in innovative capacity.
Furthermore, agglomeration diseconomies represent a characteristic of almost all other regions. In fact, it is not surprising to find many European capital regions within this category. Overall, in these regions, economic development is driven by human capital and innovation and it is partially
17 moderated by diseconomies. The few exceptions include: Lombardy, Piemonte, Emilia Romagna and Veneto (Italy) and Baden-Wuttenberg (Germany). In these regions, in contrast to other regions, the relatively lower weight of services compared to manufacturing confines or even reduces the potential for growth.
Discussion and Conclusion
Cross-regional convergence in Europe has been deeply investigated in the empirical literature, which has evidenced club convergence or core-periphery patterns of growth. In this respect, the present study, based on 186 NUTS I and II regions in the EU25, confirms this evidence by adding new results. Overall, the per capita income distribution appears to be characterised by bi-modality. In addition, the regions in the two groups grow at different average rates and converge at different speeds.
The analysis in this paper was innovative with respect to the existing literature inasmuch as the conditional convergence model was extended to include different hypotheses about how economic growth is driven by increasing returns. More importantly, the different hypotheses suggested by economic theory were tested simultaneously. A second innovative aspect was the non-linear estimation. While linear estimation is particularly useful in convergence models for the identification of steady states, its result (i.e. point elasticity) expresses the average effect of every variable on growth. Non-linear estimation, in contrast, is a powerful tool to reveal in which regions the effects are larger (smaller) and ultimately, to identify the threshold effects. From a policy perspective, evidenced heterogeneity in the drivers of regional growth underpin the territorial approach to regional policy.
The results created a complex picture characterised by large regional heterogeneity. The evidence also showed that different factors contributed to regional growth in Europe, perhaps simultaneously. Moreover, the findings indicated that convergence drives growth in Eastern Europe and generally in the NMS, although growth and catch-up in many regions is hampered by the structural gaps in knowledge. Therefore, it seems that only a significant boost in innovative capacity, accompanied by economic restructuring oriented toward knowledge economy, may help speed up the convergence process in these regions.
In addition, the majority of regions in Western Europe have the potential for growth linked to improvements in accessibility. However, such potential is mitigated by poor innovative capacity and the lack of human capital within the economy. This is the case in southern European regions
18 such as those of Spain, Portugal, Italy and Greece. Furthermore, only in a few regions was growth driven by innovation and human capital, even in the presence of agglomeration economies.
The present study does not consider the years after the 2008 financial crisis and recession, which likely worsened the macroeconomic stability of the countries in which structural barriers were more important. In light of the results illustrated in this study, it is possible to predict that the overall convergence process will slow down as a consequence of the crisis, and that income disparities may persist and even increase if the crisis stops economic restructuring processes in lagging regions.
Since growth patterns are heterogeneous across regions, regional policies for growth should be designed accordingly. There is evidence of a positive relationship between growth of human capital and innovation across all regions. However, the presence of thresholds invites more consideration regarding specific regions. In such territorial contexts, investments in knowledge and education may have considerably moderated the incremental effects or be entirely ineffective. For this reason, policies should be tailored to promote the substantial restructuring of the economy based on the specificities of each territory.
Finally, the evidence in this study suggests that a territorial approach to regional policy might better suit the goal of promoting growth at both the EU level and the regional level. On the one side, it was found that agglomeration is neither necessary nor sufficient for regional growth. In fact, many of the most developed regions in Europe are facing agglomeration diseconomies, while regions with the potential for growth caused by increasing agglomeration have registered relatively low growth. This indicates that improvements in spatially connective infrastructures might have a limited impact on regional growth in the absence of other measures. On the other side, the evidence suggests that growth is actually hampered by structural barriers related to the limited use of knowledge in the economy. In this respect, effectiveness of policy instruments depends on the ability to stimulate regional structural transformation toward a knowledge-based economy and remove structural barriers that prevent growth. Admittedly, this structural transformation, which is especially important in Mediterranean countries, has been challenged by their current debt crises in which important budget cuts have worsened their capacity to leverage on regional structural intervention and stimulate growth.
19
Acknowledgments
i
20
Appendix
Contiguity Matrix
The generic element wij of the contiguity matrix W is defined using the critical cut-off distance criterion with d being the minimum distance such that at least each region has one neighbouring *
region. The squared inverse distance between each pair of contiguous regions is used in place of the simple binary option and the elements are row-standardised.
2 * 2 / if 0 otherwise ij ij ij j d d d d w
21
References
AGHION P. and HOWITT P. (1992). A Model of Growth Through Creative Destruction. Econometrica, 60, 323–351. ALEXIADIS S. and TOMKINS J. (2010) Technology adoption and club convergence. MPRA WP.
AUDRETSCH D.B. and FELDMAN M.P. (2004). Knowledge spillovers and the geography of innovation, in HENDERSON J.V. and THISSE J.-F. (Eds) Cities and Geography, Handbook of Regional and Urban Economics, 2713–2739. Elsevier.
AZARIADIS C. and DRAZEN A. (1990). Threshold Externalities in Economic Development. The Quarterly Journal of Economics, 105, 501–526.
BADINGER H., MULLER, W. and TONDL G. (2004). Regional Convergence in the European Union, 1985– 1999: A Spatial Dynamic Panel Analysis. Regional Studies, 38, 241–253.
BADINGER H. and TONDL G. (2003). Trade, human capital and innovation: the engines of European regional growth in the 1990s, in FINGLETON B. (Ed) European Regional Growth, 215–238. Springer.
BALDWIN R.E. and FORSLID R. (2000). The Core-Periphery Model and Endogenous Growth: Stabilizing and Destabilizing Integration. Economica, 67, 307–324.
BARCA F. (2009). An Agenda For a Reformed Cohesion Policy. Independent Report to EC.
BARCA F., MCCANN P. and RODRÍGUEZ-POSE A. (2012). The Case for Regional Development Intervention: Place-Based Versus Place-Neutral Approaches. Journal of Regional Science, 52, 134–152.
BARRO R.J. (1991). Economic Growth in a Cross Section of Countries. The Quarterly Journal of Economics, 106, 407–443.
BASILE R. (2008). Regional economic growth in Europe: A semiparametric spatial dependence approach. Papers in Regional Science, 87, 527–544.
BASILE R., CAPELLO R. and CARAGLIU A. (2012). Technological interdependence and regional growth in Europe: Proximity and synergy in knowledge spillovers. Papers in Regional Science, 91, 697–722.
BASILE R. and GRESS B. (2004). Semi-parametric Spatial Auto-covariance Models of Regional Growth Behaviour in Europe. SSRN Paper 585221.
BEAUDRY, C. and SCHIFFAUEROVA, A. (2009). Who's right, Marshall or Jacobs? The localization versus urbanization debate. Research Policy, 38, 318–337.
BIVAND R.S., PEBESMA E.J. and GOMEZ-RUBIO V. (2008). Applied Spatial Data Analysis with R. Springer. BOSKER M. (2007). Growth, Agglomeration and Convergence: a Space-time Analysis for European Regions. Spatial
Economic Analysis, 2, 91–100.
BUCKLEY R.M. and BUCKLEY T.D. (2009). Discontent with the World Bank’s excursion into economic geography: lions and butterflies once more? Environment and Planning A, 41, 2806–2815.
CHESHIRE P. and MAGRINI S. (2000) Endogenous Processes in European Regional Growth: Convergence and Policy, Growth and Change, 31, 455–479.
CICCONE A. (2002). Agglomeration effects in Europe. European Economic Review, 46, 213–227.
COHEN W.M. and LEVINTHAL D.A. (1989). Innovation and Learning: The Two Faces of R&D. The Economic Journal, 99, 569–596.
CRESCENZI R. (2005). Innovation and Regional Growth in the Enlarged Europe: The Role of Local Innovative Capabilities, Peripherality, and Education. Growth and Change, 36, 471–507.
CROZET M. and KOENIG P. (2005). The Cohesion vs Growth Trade-off: Evidence from EU Regions (1980–2000). ERSA conference paper 05-716.
DALL’ERBA S. and HEWINGS G.J.D. (2003). European Regional Development Policies: The Trade-off between Efficiency-Equity Revisited. Regional Economics Applications Laboratory Discussion Paper 03-T2.
22
DALL’ERBA S. and LE GALLO J. (2008). Regional convergence and the impact of European structural funds over 1989–1999: A spatial econometric analysis. Papers in Regional Science, 87, 219–244.
DE GROOT, H., POOT, J. and SMIT, M.J. (2009). Agglomeration externalities, innovation and regional growth: theoretical perspectives and meta-analysis, in NIJKAMP, P. and CAPELLO, R. (Eds) Handbook of Regional Growth and Development Theories, pp. 256–281, Edward Elgar.
DEICHMANN U., GILL, I. and GOH, C.-C. (2011). Texture and tractability: the framework for spatial policy analysis in the World Development Report 2009. Cambridge Journal of Regions Economy and Society, 4, 163–174.
DOSI G. (1988). Sources, Procedures, and Microeconomic Effects of Innovation. Journal of Economic Literature, 26, 1120–1171.
ERTUR C. and KOCH W. (2006). Regional disparities in the European Union and the enlargement process: an exploratory spatial data analysis, 1995–2000. The Annals of Regional Science, 40, 723–765.
EUROPEAN COMMISSION (2010). Regional Policy contributing to smart growth in Europe 2020 (No. COM(2012) 553 final).
FAGERBERG J. and VERSPAGEN B. (1996). Heading for Divergence? Regional Growth in Europe Reconsidered. Journal of Common Market Studies, 34, 431–448.
FAGERBERG J., VERSPAGEN B. and CANIELS M. (1997). Technology, Growth and Unemployment across European Regions. Regional Studies, 31, 457–466.
FAROLE T., RODRÍGUEZ-POSE A. and STORPER M. (2011). Cohesion Policy in the European Union: Growth, Geography. Institutions, Journal of Common Market Studies, 49, 1089–1111.
FUJITA M., KRUGMAN P. and VENABLES A.J. (1999). The Spatial Economy: Cities, Regions and International Trade. The MIT Press, Cambridge, MA.
GALOR, O. (1996). Convergence? Inferences from Theoretical Models. The Economic Journal, 106, 1056–1069. GARCILAZO J.E., MARTINS J.O. and TOMPSON W. (2010). Why policies may need to be place-based in order to be
people-centred. VoxEU.org.
GARDINER B., MARTIN R. and TYLER P. (2011). Does spatial agglomeration increase national growth? Some evidence from Europe. Journal of Economic Geography, 11, 979–1006.
GILL I. (2010). Regional development policies: Place-based or people-centred? VoxEU.org.
GRIFFITH D.A. and PERES-NETO P.R. (2006). Spatial Modelling in Ecology: the Flexibility of the Eigenfunction Spatial Analyses. Ecology, 87, 2603–2613.
GUASTELLA G. and TIMPANO F. (2010). Spillover diffusion and regional convergence: a gravity approach. Regional Science Inquiry Journal, 2, 71–82.
HARVEY D. (2009). Reshaping Economic Geography: The World Development Report 2009. Development and Change, 40, 1269–1277.
KRUGMAN P. (1991). Geography and Trade. The MIT Press. Cambridge, MA.
KRUGMAN P. (2011). The New Economic Geography, Now Middle-aged. Regional Studies, 45, 1–7.
KRUGMAN P. and VENABLES A.J. (1995). Globalization and the Inequality of Nations. The Quarterly Journal of Economics, 110, 857–880.
KRUGMAN P. and VENABLES A.J. (1996). Integration, specialization, and adjustment. European Economic Review, 40, 959–967.
LE GALLO J. and ERTUR C. (2003). Exploratory spatial data analysis of the distribution of regional per capita GDP in Europe, 1980–1995. Papers in Regional Science, 82, 175–201.
LE GALLO J., ERTUR C. and BAUMONT, C. (2003). A Spatial Econometric Analysis of Convergence across European Regions, 1980–1995, in FINGLETON B. (Ed) European Regional Growth, 99–130. Springer.
23
LÓPEZ-BAZO E., VAYÁ E. and ARTÍS, M. (2004). Regional Externalities And Growth: Evidence From European Regions. Journal of Regional Science, 44, 43–73.
LOPEZ-BAZO E., VAYA E., MORA, A.J. and SURINACH J. (1999). Regional economic dynamics and convergence in the European Union. The Annals of Regional Science, 33, 343–370.
LUCAS R. (1988) On the mechanics of economic development. Journal of Monetary Economics, 22, 3–42.
MAGRINI S. (1999) The evolution of income disparities among the regions of the European Union, Regional Science and Urban Economics, 29, 257–281.
MANKIW N.G., ROMER D. and WEIL D.N. (1992). A Contribution to the Empirics of Economic Growth. The Quarterly Journal of Economics, 107, 407–437.
MARINGANTI A., SHEPPARD E. and ZHANG J. (2009). Where Is the Geography? World Bank’s WDR 2009, Economic and Political Weekly, 44, 45–51.
MARTIN R. and SUNLEY P. (1998). Slow Convergence? The New Endogenous Growth Theory and Regional Development. Economic Geography, 74, 201–227.
MARTIN R. and SUNLEY P. (2011). The new economic geography and policy relevance. Journal of Economic Geography, 11, 357–369.
MELO, P. C., GRAHAM, D.J. and NOLAND R.B. (2009). A meta-analysis of estimates of urban agglomeration economies. Regional Science and Urban Economics, 39, 332-342.OECD (2009a) How regions grow: trends and analysis. OECD, Paris.
OECD (2009b). Regions matter: economic recovery, innovation and sustainable growth. OECD, Paris.
PETRAKOS G., KALLIORAS D. and ANAGNOSTOU A. (2011). Regional convergence and growth in Europe: understanding patterns and determinants. European Urban and Regional Studies, 18, 375–391.
PFAFFERMAYR M. (2012). Spatial Convergence Of Regions Revisited: A Spatial Maximum Likelihood Panel Approach. Journal of Regional Science 857–873.
QUAH D.T. (1993). Galton’s Fallacy and Tests of the Convergence Hypothesis. The Scandinavian Journal of Economics, 95, 427–443.
QUAH D.T. (1996a). Regional convergence clusters across Europe. European Economic Review, 40, 951–958. QUAH D.T. (1996b). Empirics for economic growth and convergence. European Economic Review, 40, 1353–1375. RIGG J., BEBBINGTON A., GOUGH K.V., BRYCESON D.F., AGERGAARD J., FOLD N. and TACOLI C. (2009).
The World Development Report 2009 “reshapes economic geography”: geographical reflections. Transactions of the Institute of British Geographers, 34, 128–136.
RODRÍGUEZ-POSE A. (2010) Economic Geographers and the Limelight: Institutions and Policy in the World Development Report 2009, Economic Geography, 86, 361–370.
RODRÍGUEZ-POSE A. and CRESCENZI R. (2008). Research and Development, Spillovers, Innovation Systems, and the Genesis of Regional Growth in Europe. Regional Studies, 42, 51–67.
ROMER P.M. (1986). Increasing Returns and Long-Run Growth. Journal of Political Economy, 94, 1002–1037. SARDADVAR S. (2012). Growth and disparities in Europe: Insights from a spatial growth model. Papers in Regional
Science, 91, 257–274.
SOLOW R.M. (1956). A Contribution to the Theory of Economic Growth. The Quarterly Journal of Economics, 70, 65–94.
STERLACCHINI A. (2008). R&D, higher education and regional growth: Uneven linkages among European regions. Research Policy, 37, 1096–1107.
THISSEN M. and VAN OORT F. (2010). European Place-Based Development Policy and Sustainable Economic Agglomeration. Tijdschrift voor economische en sociale geografie, 101, 473–480.
VERSPAGEN B. (2010). The spatial hierarchy of technological change and economic development in Europe. Annals of Regional Science, 45, 109–132.
24
VON HIPPEL E. (1994). “Sticky Information” and the Locus of Problem Solving: Implications for Innovation, Management Science, 40, 429–439.
WOOD S.N. (2006). Generalized Additive Models: An Introduction with R. Chapman & Hall, Boca Raton.
Table 1: Description of Variables
Variable Description Mean
(SD)
Correlations
RED PA KIS EDUC ACCESS EMPD
RED Public and private research expenditure in percentage of GDP (average in years 1997-1999, Eurostat)
0.719 (0.749)
- 0.760 0.573 0.226 0.464 0.090
PA Patent applications at the European Patent Office per inhabitant (average in years 1997-1999, Eurostat)
63.240 (82.113)
- 0.512 0.076 0.497 0.061
KIS Knowledge Intensive Services workers in percentage of total workers (average in years 1997-1999, Eurostat)
0.284 (0.078)
- 0.369 0.437 0.333
EDUC Students in tertiary education based on ISCDE97 classification in percentage of total population (1999, Eurostat)
0.031 (0.015)
- 0.182 0.338
ACCESS Multimodal potential accessibility indicator (2006,
ESPON)
110.088 (36.290)
- 0.326
EMPD Employment density, ratio between the number of employees and the area of the region in square kilometres (average in years 1997-1999, Eurostat)
0.145 (0.346)
-
Note to table: RED, KIS and EDUC are expressed in percentages. Hence the average R&D to GDP in the sample is 0.719%. The accessibility indicator is by construction measured relative to the EU average. However the original data are available at NUTS III level and the average in the sample is different from 100 as a result of this aggregation.
Table 2: Conditional beta-covergence of GDP growth. EU regions 1995-2007 (a) (b) (c) (d) (e) (f) (g) (h) Intercept 0.204*** (0.036) 0.196*** (0.037) 0.185*** (0.038) 0.211*** (0.037) 0.291*** (0.039) 0.264*** (0.039) 0.237*** (0.037) 0.308*** (0.042) lnGDP -0.022*** (0.004) -0.022*** (0.004) -0.023*** (0.004) -0.022*** (0.004) -0.024*** (0.004) -0.030*** (0.004) -0.024*** (0.004) -0.031*** (0.004) lnDENSITY -0.001 (0.001) lnACCESS 0.007* (0.004) 0.007* (0.004) lnEDUC 0.001 (0.002) lnKIS 0.029*** (0.006) 0.027*** (0.006) lnPAT 0.005*** (0.001) 0.003*** (0.001) lnRED 0.004*** (0.001) lnAGRI -0.014*** (0.003) -0.016*** (0.004) -0.012*** (0.003) -0.013*** (0.003) -0.004 (0.004) -0.010*** (0.003) -0.010*** (0.003) 0.000 (0.004) lnMAN -0.001 (0.002) -0.002 (0.002) -0.002 (0.002) -0.001 (0.002) 0.002 (0.002) -0.005** (0.002) -0.004* (0.002) -0.002 (0.002) NMS -0.009* (0.005) -0.008 (0.006) -0.010* (0.005) -0.009* (0.005) -0.009* (0.005) -0.004 (0.005) -0.009* (0.005) -0.006 (0.005) COHESION 0.001 (0.003) 0.001 (0.003) 0.002 (0.003) 0.000 (0.003) 0.007** (0.003) 0.006* (0.003) 0.002 (0.003) 0.012*** (0.004) Moran I 9.4536 [0.000] R2 0.2605 0.2642 0.272 0.2635 0.3373 0.313 0.3055 0.3809
Notes to table SE in parenthesis, p-values in brackets.
Table 3: Generalized additive model of conditional beta-covergence of GDP growth. EU regions 1995-2007
GAM excluding the spatial trend GAM including the spatial trend
coefficient t-stat p-value coefficient t-stat p-value
Intercept 0.022 2.790 [0.006] 0.010 1.196 [0.234]
lnAGRI 0.000 0.031 [0.975] -0.003 -0.889 [0.375]
lnMAN -0.001 -0.266 [0.790] -0.003 -1.232 [0.220]
NMS -0.002 -0.276 [0.783] -0.004 -0.594 [0.554]
COHESION 0.008 2.300 [0.023] 0.022 3.387 [0.001]
estimated DF F-stat p-value Estimated DF F-stat p-value
s(lnGDP) 4.454 16.485 [0.000] 6.456 13.127 [0.000] s(lnPATENTS) 4.974 3.849 [0.001] 4.538 4.028 [0.001] s(lnKIS) 2.425 7.721 [0.000] 3.180 2.264 [0.065] s(lnACCESS) 3.621 2.458 [0.041] 2.967 2.145 [0.083] s(LONG,LAT) 25.053 6.251 [0.000] Deviance Explained 55.40% 81.50% GCV*100 0.013 0.008
List of Figures