Anselmo Caricato, Sara Pitoni, Luca Montini, Maria Grazia Bocci, Pina Annetta, Massimo Antonelli
Anselmo Caricato, Sara Pitoni, Luca Montini, Maria Grazia Bocci, Pina Annetta, Massimo Antonelli, Department of Anes-thesiology and Intensive Care Medicine, Catholic University of the Sacred Heart, “A. Gemelli” Teaching Hospital, Intensive Care Unit, 00168 Roma, Italy
Author contributions: Caricato A, Pitoni S and Antonelli M designed the paper; Montini L produced images; Bocci MG and Annetta P critically revised the paper; Caricato A wrote the paper. Correspondence to: Anselmo Caricato, Assistant Profes-sor, Department of Anesthesiology and Intensive Care Medicine, Catholic University of the Sacred Heart, Largo A. Gemelli 8, 00168 Roma, Italy. [email protected]
Telephone: +39-339-3974355 Fax: +39-6-97252605 Received: January 10, 2014 Revised: March 18, 2014 Accepted: July 15, 2014
Published online: September 28, 2014
Abstract
Transcranial sonography (TCS) is an ultrasound-based imaging technique, which allows the identification of several structures within the brain parenchyma. In the past it has been applied for bedside assessment of different intracranial pathologies in children. Pres-ently, TCS is also used on adult patients to diagnose intracranial space occupying lesions of various origins, intracranial hemorrhage, hydrocephalus, midline shift and neurodegenerative movement disorders, in both acute and chronic clinical settings. In comparison with conventional neuroimaging methods (such as com-puted tomography or magnetic resonance), TCS has the advantages of low costs, short investigation times, repeatability, and bedside availability. These noninva-sive characteristics, together with the possibility of of-fering a continuous patient neuro-monitoring system, determine its applicability in the monitoring of multiple emergency and non-emergency settings. Currently, TCS is a still underestimated imaging modality that requires a wider diffusion and a qualified training process. In this review we focused on the main indications of TCS
for the assessment of acute neurologic disorders in in-tensive care unit.
© 2014 Baishideng Publishing Group Inc. All rights reserved. Key words: Brain sonography; Transcranial sonography; Ultrasounds; Cerebral sonography; Brain imaging; Hy-drocephalus; Cerebral hemorrhage
Core tip:Transcranial sonography (TCS) is an ultra-sound-based imaging technique, which allows the iden-tification of several structures within the brain paren-chyma, not only in neonates, but also in adult patients. It can be used to diagnose intracranial space occupying lesions of various origins, intracranial hemorrhage, hy-drocephalus and midline shift. In comparison with com-puted tomography scan, TCS has the advantages of low costs, short investigation times, repeatability, and bedside availability. These noninvasive characteristics, together with the possibility of offering a continuous patient neuro-monitoring system, determine its applica-bility in multiple emergency settings.
Caricato A, Pitoni S, Montini L, Bocci MG, Annetta P, Antonel-li M. Echography in brain imaging in intensive care unit: State of the art. World J Radiol 2014; 6(9): 636-642 Available from: URL: http://www.wjgnet.com/1949-8470/full/v6/i9/636.htm DOI: http://dx.doi.org/10.4329/wjr.v6.i9.636
INTRODUCTION
Definitions
In the last years, due to new ultrasounds technology, echographic imaging of the brain parenchyma has been obtained not only in children, but also in adults. Several authors have found a good visualization of cerebral struc-tures using transcranial B-mode ultrasounds through a
TOPIC HIGHLIGHT
Radiology
W J R
Submit a Manuscript: http://www.wjgnet.com/esps/ Help Desk: http://www.wjgnet.com/esps/helpdesk.aspx DOI: 10.4329/wjr.v6.i9.636
World J Radiol 2014 September 28; 6(9): 636-642
ISSN 1949-8470 (online) © 2014 Baishideng Publishing Group Inc. All rights reserved.
Echography in brain imaging in intensive care unit: State of
the art
transtemporal approach [transcranial sonography (TCS)]. In the past, the skull was considered unsuitable for sonographic examination because of its thick structure. Aaslid et al[1] described a “temporal window”, the thinner
part of the temporal bone located just above the zygo-matic arch, and observed that low-frequency ultrasounds may well penetrate inside the skull in this zone. Since then, TCS has been proposed for bedside identification of many different intracranial pathologies, in both acute and chronic settings, such as intracranial space occupying lesions of various origins (intracranial hemorrhage), hy-drocephalus, midline shift and neurodegenerative move-ment disorders. In comparison with conventional neu-roimaging methods such as computed tomography (CT) and Magnetic Resonance, TCS has the advantages of low costs, short investigation times, repeatability, and bedside availability. These noninvasive characteristics, together with the possibility of offering a continuous patient neu-ro-monitoring system, determine its wide applicability in the monitoring of multiple emergency settings including Intensive Care Units, trauma centers and the context of emergency transportations (i.e., aeromedical flights,
heli-copter transfers, etc.)[2,3].
The main limitation of TCS is its dependence to an adequate temporal acoustic window. In fact, between 5%-18% of patients the exam is not feasible due to a particularly thick structure of the temporal bone[4].
High-er pHigh-ercentage of failure rate was described in people of Asian ethnic origin[5].
In this context, patients with skull defects, such as those who underwent decompressive craniectomy, allow a very accurate assessment of brain parenchyma by TCS[2].
In this review, we summarize the usefulness of this technique for the assessment of acute neurological dis-orders in the intensive care unit, describing proposed in-dications, technical considerations, main advantages and limitations.
TCS technique
The patient lies in a supine position, and the examiner usually sits at the head of the examination table, firmly positioning the ultrasound probe on the temporal zone.
The location of the acoustic window may be variable. In fact, it can be either located in the anterior part of the temporal bone, close to the vertical portion of the zygo-matic bone, or, more frequently, posteriorly and close to the pinna of the ear. A low-frequency probe with a 2.0-2.5 MHz phased array transducers is appropriate to insonate the brain through the intact skull. In case of decompres-sive craniectomy, a standard abdominal convex phased-array probe with a mean central frequency of 4 MHz and an abdominal setting can be used.
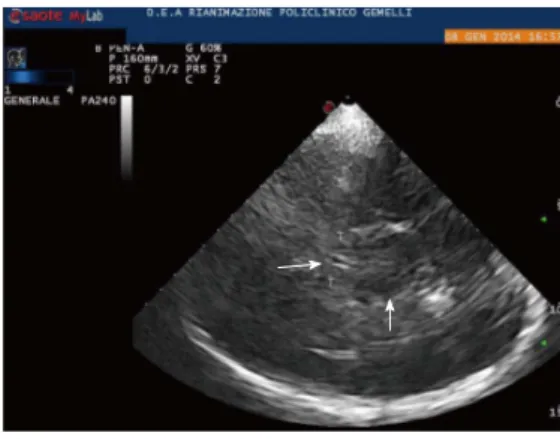
Usually, the examination starts with the identification of the mesencephalic brainstem in the axial plane parallel to the “orbitomeatal line”, so to obtain CT-like images (Midbrain transverse scan; Figures 1 and 2). The butter-fly-shaped mesencephalic brainstem surrounded by the echogenic basal cisterns is the “landmark” of this scan, and can be observed in 90%-95% of the patients.
Tilting the probe about 10° upwards, a diencephalic transverse scan may be obtained. In this section, the third ventricle can be visualized as a highly echogenic double-line image, due to ipsilateral and controlateral inner layer of the hyperechogenic ependima (Figures 2-4).
Just posteriorly, thalami are depicted as hypoecogen/
hysoecogen structures surrounding the third ventricle (Figure 2). Anteriorly, the frontal horn of the contralater-al lateral ventricle is visualized as hypoechogenic structure,
well visible between two parallel lines corresponding to the medial and lateral layer of the ependima (Figure 4). At this plane, the largest transverse diameters of the third ventricle and of the frontal horns of the contralateral lateral ventricle may be measured[6,7]. It may be useful to
pay attention that image is generated by a sectorial probe, and the proportions are different in the central and in the lateral part of the image. Thus, lateral ventricle ipsilateral to the probe is often depicted at the same depth of the third ventricle.
The insonation planes are usually the midbrain and diencephalic transverse ones, even though the coronal orientation has been described. A free hand multiplanar approach has been observed, especially on surgically decompressed patients[2], and attempts of standardized
Figure 1 Midbrain transverse scan. The butterfly-shaped mesencephalic
brainstem surrounded by the echogenic basal cisterns is shown in the circle. Figure 2 Diencephalic transverse scan. The third ventricle can be visualized as a highly echogenic double-line image (arrow head on the left). Mesencepha-lon is indicated by the arrow head on the right. T: Thalamus.
approaches have been reported[8]. A standardization of
insonation planes would be very useful for comparison and follow-up of sonographic findings.
With the blind technique, landmarks regularly visual-ized, even in moderate sonographic conditions (identifi-cation rates of > 75%) are mesencephalon, pons, third ventricle, lateral ventricles, falx, thalamus, basal ganglia, pineal gland and temporal lobe[7]. Moreover, ultrasound
(US) perfusion imaging can be enhanced by the applica-tion of echo-contrast harmonic imaging modalities[9,10].
CLINICAL APPLICATION
Intracranial hemorrhage
In spontaneous or traumatic cerebral hemorrhage (ICH), hematoma enlargement is the most important modifiable prognostic factor; thus, monitoring of the volume of the hemorrhage is the first priority in the acute phase[11,12].
CT’s widespread acute availability makes it the pri-mary diagnostic modality for ICH. However, in the first hours after the diagnosis, TCS may be very useful to monitor an early ICH enlargement. In fact, TCS allows the visualization of acute ICH, as an hyperechoic sharply demarcated mass within the brain parenchyma. The ac-curacy is limited to the first 4-6 d after the onset of the ICH, when the hematoma remains more echogenic than
the surrounding brain tissue.
Several authors studied the correlation between CT and TCS in cerebral hemorrhage. Seidel confirmed CT diagnosis by TCS in 18/23 cases (78%)[9]. Mäurer et al[13]
published a study on TCS in 151 stroke patients correctly differentiating between ischemia and hemorrhage in 95%. 12% had an insufficient temporal bone window for tran-scranial insonation.
Perez et al[14] prospectively studied 46 patients with
supratentorial ICH evaluated within 3 h of onset. In 8 cases ICH was not observed by TCS: 5 patients showed a small-sized ICH on CT, and in 3 cases hematoma was located in brainstem or in cerebellum. In the remaining patients a very good correlation was observed for each diameter of the mass and for total hematoma volume (r
= 0.82, P < 0.001).
TCS was also evaluated to detect hemorrhagic trans-formation in the early phase of ischemic stroke. Seidel
et al[15] found an excellent correlation between TCS and
CT on 20 patients with hemorrhagic transformation; in 2 cases small cortical hematoma was not diagnosed.
From these data, TCS seems an interesting option for ICH monitoring; actually, its accuracy appears insufficient to support therapeutic decisions in the acute setting.
Recent studies evaluated the impact of echo contrast agents on visualization of ICH by TCS. By using
ultra-A B
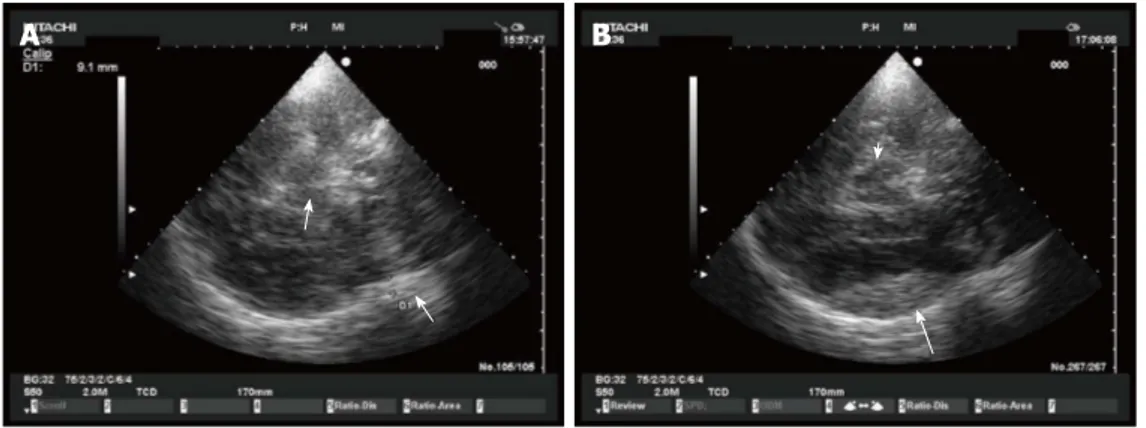
Figure 4 Lateral ventricles. A: Lateral ventricles in echography. Frontal horns of lateral ventricles are visualized as hypoechogenic structure, well visible between two
parallel lines corresponding to the medial and lateral layer of the ependima. The three parallel lines correspond to lateral layers of ependima and septum pellucidum. The image is generated by a sectorial probe, and lateral ventricle ipsilateral to the probe is depicted at the same depth of the third ventricle. Arrow shows third ventricle, Small arrow heads on the left show frontal horns of lateral ventricles; B: Lateral ventricles in computed tomography (CT). CT scan of lateral ventricles correspondent of Figure 4A is shown.
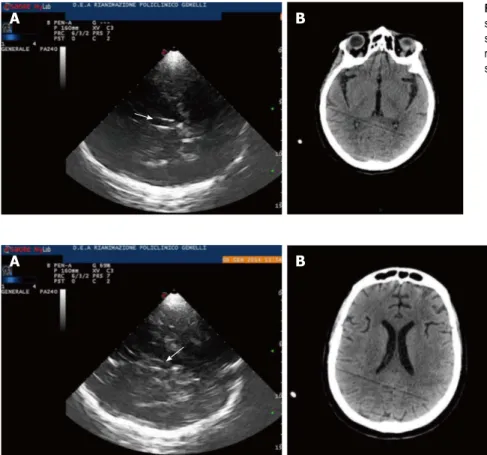
A B Figure 3 Third ventricle. A: Diencephalic transverse scan. A small enlargement (12 mm) of third ventricle is
shown (arrow); B: Third ventricle in computed tomog-raphy (CT). CT scan correspondent of Figure 3A is shown.
as an hyperechogenic image just inside the skull (Figures 5-7). Prospective data on usefulness of this technique for EDH detection are lacking and should be encouraged.
The extent of SDH has also been diagnosed and monitored by TCS [20]. In particular, SDH has been
quan-tified by measuring the distance between the skull and the dural border of the arachnoid, described as a highly echo-genic membrane. In this context, Niesen et al[20] reliably
detected SDH in 22 of the 25 patients with confirmed SDH (88%). In the remaining 3 patients, the temporal bone window was insufficient for TGS investigation. Extent of SDH measured by CT and TCS correlated lin-early (r = 0.849)[20].
In conclusion, TCS, when performed by a trained so-nographer, may represent a possible method for noninva-sively monitoring early hematoma growth at the bedside of patients with or without skull defects, with the role of complementing the CT scan diagnostic technique.
Midline shift
In the diencephalic transverse scan, midline dislocation (MLD) and hydrocephalus can be diagnosed through TCS scanning. The MLD can be observed and measured through two different methods.
According to the method described by Seidel et al[7],
the third ventricle should be considered as a marker of the midline. The distance between third ventricle and external side of the temporal bone (A), needs to be mea-sured. The same calculation can be repeated for the con-tralateral side (B). A MLD of the third ventricle is then estimated according to the formula MLD = (A - B)/2.
In that study, a reproducibility of sonographic MLD measurements corresponding to 0.3 ± 0.2 mm was reached in 10 healthy volunteers. This technique has been widely investigated by several studies in patients with acute cerebrovascular disease and after traumatic brain injury, and a very good correlation between sonographic and CT measurement of MLD are reported[21-23].
After decompressive craniectomy this method may be difficult. Bone defects, temporal cephalhematomas, or changes in intracranial anatomy secondary to trauma sound perfusion imaging, Kern et al[16] observed a
reduc-tion in contrast agent arrival in the ICH core, which led to better delineation of the lesion borders from adjacent tissue. Correlation with CT was very good (r = 0.94,
95%CI: 0.81-0.98, P < 0.001). Similar results were
report-ed by Vicenzini et al[17] and Kern et al[18].
US perfusion imaging has a wide diffusion in myo-cardial, renal and musculoskeletal tissue, and might be an option even for brain under difficult insonation condi-tions; actually, the real advantage of this technique on TCS is still unknown.
Epidural and Subdural hemorrhage
Epidural and subdural hematoma (EDH, SDH) are po-tentially life-threatening complications after severe, mod-erate and mild traumatic brain injury. If undetected and untreated, they may lead to progressive transtentorial her-niation with loss of consciousness, pupillary dilation, and further neurologic deficits. In EDH-patients, the CT scan remains the diagnostic gold standard, but early bedside detection of acute EDH by TCS has been described[19].
By using a midbrain transverse scan, contralateral skull became well visible even in absence of decompressive craniectomy, and an epidural hematoma can be observed
A B
Figure 5 Epidural hematoma in echography. A: Epidural hematoma. A small epidural hematoma (arrow on the right) is shown as an hyperechogenic image just inside
the skull. Arrow on the left indicates mesencephalon; B: Epidural hematoma. The same epidural hematoma of Figure A (arrow) 1 h later. White arrow indicates mesen-cephalon.
Figure 6 Epidural hematoma in decompressive craniectomy. A small acute
epidural hematoma is shown as a hyperechogenic mass lesion controlateral to decompressive craniectomy.
may all induce bias in the measure. In such a condition, Caricato et al[2] described a further method to visualize the
MLD. This technique has shown an excellent agreement with CT scan measurements. In an axial plane, the mid-line, defined as the line between the two lateral ventricles, is measured by a convex probe with an abdominal preset. After localizing the falx cerebri, both on frontal and oc-cipital sides, the distance between the extension of falx and the interventricular line is assessed; the present mea-surement is the MLD (Figure 8). The last method, which is still to be externally validated, seems rather simple and accurate because measurements are obtained on direct observation of the images and not by indirect mathemat-ical calculations.
Hydrocephalus
Posthemorrhagic hydrocephalus is a frequent complica-tion after subarachnoid hemorrhage or parenchymal hemorrhage; furthermore external ventricular drainage may be necessary after severe traumatic injury to control intracranial hypertension. In these conditions, direct visu-alization of cerebral ventricles may be required, and criti-cal patients have to be moved to radiology for CT scan.
In this context, TCS may be an useful option. In fact, previous studies compared sonographic and CT measurements of ventricular diameters, founding a good agreement. This was observed in particular for the meas-urement of third ventricle, that is depicted in a plane orthogonal to the probe, and doesn’t need angle cor-rection. As we reported above, direct measurement of lateral ventricles is more difficult since its angle with the probe, and a generally moderate correlation with CT scan is reported. Actually, Kiphuth et al[21] observed that TCS
was a reliable technique to predict the need of cerebros-pinal fluid drainage. In patients with external ventricular drainage (EVD), they estimated that a cut-off value of an increase of 5.5 mm in ventricle width after clamping had an high sensitivity (100%) and negative predictive value (100%). They suggested that an increase in ventricular width lower than the cut-off was an indication for a safe removal of EVD.
In conclusion, even if the technique still requires a wide validation, it seems to be an interesting option when repetitive CT measurement have to be performed to monitor obstructive hydrocephalus in intensive care Unit.
Evaluation of intracranial hypertension
Optic nerve sheath diameter: Measurement of optic nerve sheath diameter has been proposed as a measure of increased intracranial pressure in a variety of settings[24-26].
In fact, the sheath around the optic nerve is a continua-tion of the dura; thus, a rise in ICP is transmitted to the optic nerve, eventually resulting in swelling of the optic disc and in a sheath diameter grater than the normal. The technique is easy and a quick learning curve is described. According with Cennamo et al[27], patients were examined
in the supine position. Using a 7.5-MHz linear probe on the closed upper eyelid, the optic nerve was visualized as a linear hypoechoic structure with clearly defined margins posterior to the globe. Sheath diameter was measured 3.00 mm behind the globe, and a value greater than 5.00 mm was considered abnormal.
The technique has been described more than 20 years ago; even if some criticism should be considered[28], it is
A B
Catheter tip
Midline shift
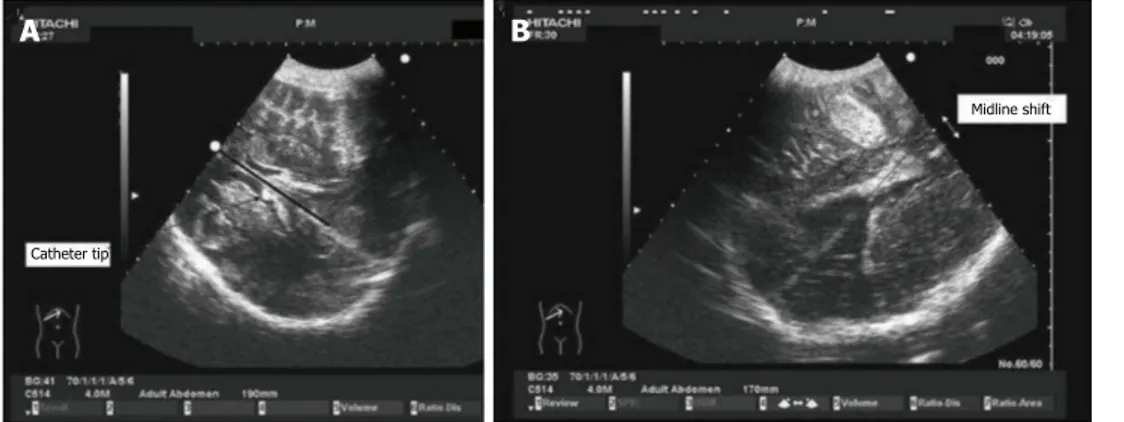
Figure 7 Midline shift in decompressive craniectomy. Images obtained through decompressive craniectomy. Midline was identified with the interventricular line.
The distance between the extension of falx and the interventricular line was measured as midline shift (MLS). In the case on the left (A), the extension of the falx ex-actly overlaps with the interventricular line (dark line). On the right (B), MLS caused by a temporal hematoma is shown.
Figure 8 Optic nerve sheath diameter. Using a 7.5-MHz linear probe on
the closed upper eyelid, the optic nerve was visualized as a linear hypoechoic structure with clearly defined margins posterior to the globe. Sheath diameter was measured 3 mm behind the globe. ONSD: Optic nerve sheath diameter.
proposed as screening test to rule out intracranial hyper-tension noninvasively at the bedside.
CONCLUSION
In neurointensive care transcranial Doppler is often used for the evaluation of the cerebral blood flow, diagnosis and monitoring of vasospasm, and autoregulation in patients with different types of brain injury. Beyond the classic indications of transcranial doppler, B-mode ultra-sounds can be used as imaging technique to monitor pa-tients in ICU, and may often reduce the indication to CT scan. In this review we summarized the main indications for TCS in intensive care unit. In our opinion, it is a still underestimated imaging modality that requires a wider diffusion. As for any other sonographic assessment, TCS is a highly user-dependent technique, and requires expertise to perform accurate evaluation. In this context, physicians working in neurologic intensive care medicine should be trained not only to apply Doppler methods for investigation of cerebral vessels but also in transcranial B-mode sonography; further studies should be encour-aged for a better comprehension of usefulness and limits of this technique as option to brain CT.
REFERENCES
1 Aaslid R, Markwalder TM, Nornes H. Noninvasive
tran-scranial Doppler ultrasound recording of flow velocity in basal cerebral arteries. J Neurosurg 1982; 57: 769-774 [PMID: 7143059]
2 Caricato A, Mignani V, Bocci MG, Pennisi MA, Sandroni C,
Tersali A, Antonaci A, de Waure C, Antonelli M. Usefulness of transcranial echography in patients with decompressive craniectomy: a comparison with computed tomography scan. Crit Care Med 2012; 40: 1745-1752 [PMID: 22610180 DOI: 10.1097/CCM.0b013e318246b6ea]
3 Libert N, Boutonnet M, Giraud N, Tourtier JP, de Rudnicki S.
Transcranial echography: an interesting tool for aeromedical evacuations. Crit Care Med 2012; 40: 3331-3332; author reply 3332 [PMID: 23164789 DOI: 10.1097/CCM.0b013e3182675c60]
4 Wijnhoud AD, Franckena M, van der Lugt A, Koudstaal PJ,
Dippel ED. Inadequate acoustical temporal bone window in patients with a transient ischemic attack or minor stroke: role of skull thickness and bone density. Ultrasound Med
Biol 2008; 34: 923-929 [PMID: 18243493 DOI: 10.1016/j.ultras
medbio.2007.11.022]
5 Yoshimura S, Koga M, Toyoda K, Mukai T, Hyun BH,
Naganuma M, Nagatsuka K, Minematsu K. Frontal bone window improves the ability of transcranial color-coded sonography to visualize the anterior cerebral artery of Asian patients with stroke. AJNR Am J Neuroradiol 2009; 30: 1268-1269 [PMID: 19213827]
6 Seidel G, Kaps M, Gerriets T. Potential and limitations of
transcranial color-coded sonography in stroke patients. St
roke 1995; 26: 2061-2066 [PMID: 7482650 DOI: 10.1161/01.
STR.26.11.2061]
7 Seidel G, Kaps M, Gerriets T, Hutzelmann A. Evaluation
of the ventricular system in adults by transcranial duplex sonography. J Neuroimaging 1995; 5: 105-108 [PMID: 7718936]
8 Kern R, Perren F, Kreisel S, Szabo K, Hennerici M, Meairs
S. Multiplanar transcranial ultrasound imaging: stan-dards, landmarks and correlation with magnetic resonance imaging. Ultrasound Med Biol 2005; 31: 311-315 [PMID: 15749552 DOI: 10.1016/j.ultrasmedbio.2004.12.006]
9 Seidel G, Meyer-Wiethe K, Berdien G, Hollstein D,
Toth D, Aach T. Ultrasound perfusion imaging in acute middle cerebral artery infarction predicts outcome. Stro
ke 2004; 35: 1107-1111 [PMID: 15031454 DOI: 10.1161/01.
STR.0000124125.19773.40]
10 Bartels E, Bittermann HJ. Transcranial contrast imaging of cerebral perfusion in patients with space-occupying intra-cranial lesions. J Ultrasound Med 2006; 25: 499-507 [PMID: 16567439]
11 Brouwers HB, Greenberg SM. Hematoma expansion follow-ing acute intracerebral hemorrhage. Cerebrovasc Dis 2013; 35: 195-201 [PMID: 23466430 DOI: 10.1159/000346599]
12 Dowlatshahi D, Demchuk AM, Flaherty ML, Ali M, Lyden PL, Smith EE. Defining hematoma expansion in intracere-bral hemorrhage: relationship with patient outcomes.
Neu-rology 2011; 76: 1238-1244 [PMID: 21346218 DOI: 10.1212/
WNL.0b013e3182143317]
13 Mäurer M, Shambal S, Berg D, Woydt M, Hofmann E, Geor-giadis D, Lindner A, Becker G. Differentiation between in-tracerebral hemorrhage and ischemic stroke by transcranial color-coded duplex-sonography. Stroke 1998; 29: 2563-2567 [PMID: 9836768 DOI: 10.1161/01.STR.29.12.2563]
14 Pérez ES, Delgado-Mederos R, Rubiera M, Delgado P, Ribó M, Maisterra O, Ortega G, Alvarez-Sabin J, Molina CA. Transcranial duplex sonography for monitoring hyperacute intracerebral hemorrhage. Stroke 2009; 40: 987-990 [PMID: 19164795 DOI: 10.1161/STROKEAHA.108.524249]
15 Seidel G, Cangür H, Albers T, Burgemeister A, Meyer-Wiethe K. Sonographic evaluation of hemorrhagic trans-formation and arterial recanalization in acute hemispheric ischemic stroke. Stroke 2009; 40: 119-123 [PMID: 18988915 DOI: 10.1161/STROKEAHA.108.516799]
16 Kern R, Kablau M, Sallustio F, Fatar M, Stroick M, Henne-rici MG, Meairs S. Improved detection of intracerebral hemorrhage with transcranial ultrasound perfusion imaging. Cerebrovasc Dis 2008; 26: 277-283 [PMID: 18648201 DOI: 10.1159/000147456]
17 Vicenzini E, Delfini R, Magri F, Puccinelli F, Altieri M, Santoro A, Giannoni MF, Bozzao L, Di Piero V, Lenzi GL. Semiquantitative human cerebral perfusion assessment with ultrasound in brain space-occupying lesions: preliminary data. J Ultrasound Med 2008; 27: 685-692 [PMID: 18424642] 18 Kern R, Krogias C, Meyer-Wiethe K, Renault G, Kablau M,
Sallustio F, Eyding J, Meves S, Seidel G, Meairs S: Diagnosis of acute ischemic vs. hemorrhagic stroke with transcranial ultrasound imaging – a prospective multi-center study.
Cerebrovasc Dis 2006; 21 (suppl 4): 34
19 Caricato A, Mignani V, Sandroni C, Pietrini D. Bedside de-tection of acute epidural hematoma by transcranial sonog-raphy in a head-injured patient. Intensive Care Med 2010; 36: 1091-1092 [PMID: 20213067 DOI: 10.1007/s00134-010-1801-0] 20 Niesen WD, Burkhardt D, Hoeltje J, Rosenkranz M, Weiller
C, Sliwka U. Transcranial grey-scale sonography of subdu-ral haematoma in adults. Ultraschall Med 2006; 27: 251-255 [PMID: 16596509 DOI: 10.1055/s-2006-926544]
21 Kiphuth IC, Huttner HB, Struffert T, Schwab S, Köhrmann M. Sonographic monitoring of ventricle enlargement in posthemorrhagic hydrocephalus. Neurology 2011; 76: 858-862 [PMID: 21288979 DOI: 10.1212/WNL.0b013e31820f2e0f] 22 Stolz E, Gerriets T, Fiss I, Babacan SS, Seidel G, Kaps M.
Comparison of transcranial color-coded duplex sonography and cranial CT measurements for determining third ven-tricle midline shift in space-occupying stroke. AJNR Am J
Neuroradiol 1999; 20: 1567-1571 [PMID: 10512247]
23 Llompart Pou JA, Abadal Centellas JM, Palmer Sans M, Pérez Bárcena J, Casares Vivas M, Homar Ramírez J, Ibáñez Juvé J. Monitoring midline shift by transcranial color-coded sonography in traumatic brain injury. A comparison with cra-nial computerized tomography. Intensive Care Med 2004; 30: 1672-1675 [PMID: 15197433 DOI: 10.1007/s00134-004-2348-8]
24 Newman WD, Hollman AS, Dutton GN, Carachi R. Mea-surement of optic nerve sheath diameter by ultrasound: a means of detecting acute raised intracranial pressure in hydrocephalus. Br J Ophthalmol 2002; 86: 1109-1113 [PMID: 12234888 DOI: 10.1136/bjo.86.10.1109]
25 Moretti R, Pizzi B, Cassini F, Vivaldi N. Reliability of optic nerve ultrasound for the evaluation of patients with spon-taneous intracranial hemorrhage. Neurocrit Care 2009; 11: 406-410 [PMID: 19636971]
26 Dubost C, Le Gouez A, Jouffroy V, Roger-Christoph S, Benhamou D, Mercier FJ, Geeraerts T. Optic nerve sheath
diameter used as ultrasonographic assessment of the inci-dence of raised intracranial pressure in preeclampsia: a pilot study. Anesthesiology 2012; 116: 1066-1071 [PMID: 22258019 DOI: 10.1097/ALN.0b013e318246ea1a]
27 Cennamo G, Gangemi M, Stella L: The comparison between endocranial pressure and optic nerve diameter: an ultraso-nographic study. Doc Ophthalmol Proc Ser 1987; 48: 603-606 [DOI: 10.1007/978-94-009-3315-6_99]
28 Copetti R, Cattarossi L. Optic nerve ultrasound: artifacts and real images. Intensive Care Med 2009; 35: 1488-1489; author reply 1488-1489 [PMID: 19367390 DOI: 10.1007/s00134-009-1494-4]
P- Reviewer: Brigo F, Llompart-Pou J, Zanini MA S- Editor: Ji FF L- Editor: A E- Editor: Lu YJ