University of Sassari PhD Course in
Life Sciences and Biotechnologies
Curriculum: Microbiology and immunology
XXX cycle
PhD Course Director: Prof. Leonardo A. Sechi
Metaproteogenomic analyses of the gut
microbiota in human and animal models:
identification of changes induced by special
diets in health and disease
Tutor: Prof. Sergio Uzzau
PhD candidate: Marcello Abbondio
PhD Course Director:
Università degli Studi di Sassari Corso di Dottorato di ricerca in Life Sciences and Biotechnologies
La presente tesi è stata prodotta durante la frequenza del corso di dottorato in Life Sciences and Biotechnologies dell’Università degli Studi di Sassari, a.a. 2016/2017 - XXX ciclo, con il sostegno di una borsa di studio cofinanziata con le risorse del P.O.R. SARDEGNA F.S.E. 2007-2013 - Obiettivo competitività regionale e occupazione, Asse IV Capitale umano, Linea di Attività l.3.1 “Finanziamento di corsi di dottorato finalizzati alla formazione di capitale umano altamente specializzato, in particolare per i settori dell’ICT, delle nanotecnologie e delle biotecnologie, dell'energia e dello sviluppo sostenibile, dell'agroalimentare e dei materiali tradizionali”.
Acknowledgements
The present work has been possible thanks to the collaboration between the Department of Biomedical Sciences (University of Sassari, Italy) and Porto Conte Ricerche (Technology Park of Sardinia in Tramariglio, Alghero, Italy), where all the experiments were performed, including sample preparation, DNA sequencing, mass spectrometry identification, and metagenomic and metaproteomic analyses.
In addition, the collaboration with several other groups has occurred: i) the Department of Biomedical Sciences (University of Cagliari, Italy) for the rat model of caloric restriction; ii) the Institute of Food Sciences of the National Research Council (ISA-CNR, Avellino, Italy), for the mouse model of celiac disease; iii) the Institute for Genetic and Biomedical Research of National Research Council (IRGB-CNR, Cagliari), for the human healthy cohort study; iv) the Centre of Diabetology (San Giovanni University Hospital, Cagliari), for the dietary intervention study on T2D patients versus healthy controls; v) the Department of Agricultural Sciences (University of Sassari), for the ovine study.
Table of Contents
Acknowledgements ... 3
Table of Contents ... 4
List of Figures and Tables ... 6
List of Abbreviations ... 12
Background ... 15
The gut microbiota ... 17
Methods to characterize the gut microbiota ... 19
Gut microbiota and diet ... 22
Aim of the research project ... 26
Chapter 1:Animal models for the study of gut microbiota and diet interactions ... 27
1.1 Introduction ... 27
1.2 Caloric restriction promotes rapid expansion and long-lasting increase of Lactobacillus in the rat fecal microbiota ... 29
1.2.1 Aim of the study ... 29
1.2.2 Experimental design ... 29
1.2.3 Material & Methods ... 30
1.2.4 Results ... 38
1.3 Caloric restriction-induced changes in the fecal microbiota are kept in the adulthood but start to be reversed just after 1 week of ad libitum diet ... 52
1.3.1 Aim of the study ... 52
1.3.2 Experimental design ... 52
1.3.3 Material & Methods ... 53
1.3.4 Results ... 55
1.4 Effects of sourdough-leavened bread diet integration on the fecal microbiota in a model of caloric restriction in rats ... 68
1.4.1 Aim of the study ... 68
1.4.2 Experimental design ... 68
1.4.3 Material & Methods ... 69
1.4.4 Results ... 72
1.5.1 Aim of the study ... 79
1.5.2 Experimental design ... 79
1.5.3 Material & Methods ... 80
1.5.4 Results ... 82
1.6 Conclusion and perspectives ... 92
Chapter 2:Integrated metaproteogenomic analyses of the human and the ovine gut microbiomes ... 94
2.1 Introduction ... 94
2.2 Characterization of human gut microbiota functions and metabolic pathways of healthy human cohort ... 97
2.2.1 Aim of the study ... 97
2.2.2 Experimental design ... 98
2.2.3 Material & Methods ... 98
2.2.4 Results ... 101
2.3 Human gut microbiome variations according to their dietary habits ... 116
2.3.1 Aim of the study ... 116
2.3.2 Experimental design ... 116
2.3.3 Material & Methods ... 117
2.3.4 Results ... 120
2.4 Human gut microbiome variations according to dietary interventions ... 135
2.4.1 Aim of the study ... 135
2.4.2 Experimental design ... 136
2.4.3 Material & Methods ... 136
2.4.4 Results ... 138
2.5 Functions and metabolic pathways in the gastrointestinal tracts of an economically relevant livestock species: the ovine ... 143
2.5.1 Aim of the study ... 143
2.5.2 Experimental design ... 144
2.5.3 Material & Methods ... 144
2.5.4 Results ... 150
2.6 Conclusion and perspectives ... 168
Conclusion and perspectives ... 170
List of Figures and Tables
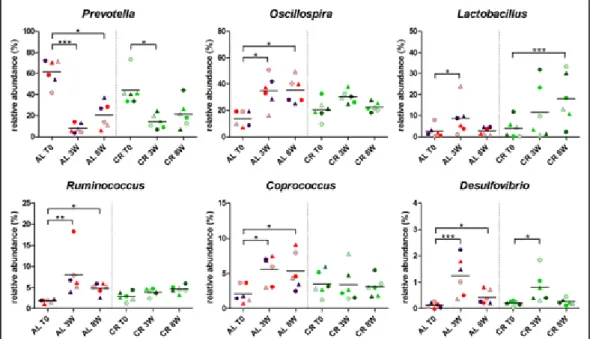
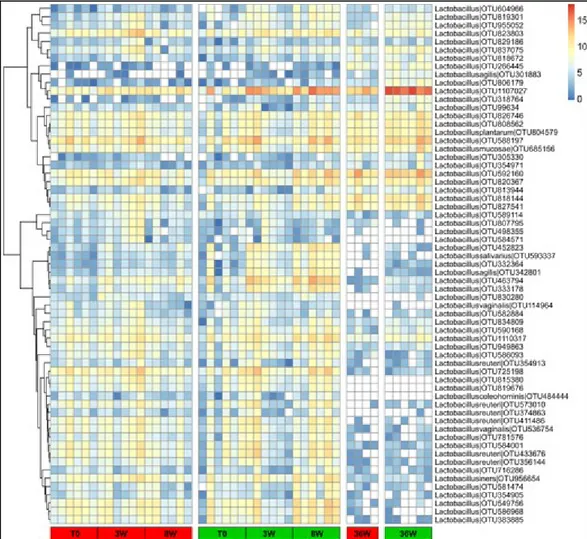
Figure 1: A map of microbial diversity in the human microbiota (Morgan et al 2013). ... 16 Figure 2: Human microbiota colonization and shaping through age progression and perturbations (Ottman et al 2012). ... 18 Figure 3: Outline of the approaches available for the study of the gut microbiota (Addis et al 2016). ... 22 Figure 4: Schematic illustrating the experimental design of the study. ... 29 Figure 5: Growth curves of young growing (A) and adult (B) rats during ad libitum (AL, red) and caloric restriction (CR, green) treatment (Fraumene et al 2017). ... 38 Figure 6: Food intake/body weight ratio curve of young growing (A) and adult (B) rats during ad libitum (AL, red) and caloric restriction (CR, green) treatment (Fraumene et al 2017). ... 39 Figure 7: Lipid serum profile of young growing rats after 8 weeks of ad libitum (AL, red) and caloric restriction (CR, green) treatment (Fraumene et al 2017). ... 39 Table 1: OTU richness and alpha-diversity within AL (ad libitum) and CR (caloric restriction) groups at different time points. ... 40 Figure 8: Beta-diversity at OTU level between ad libitum (AL, red) and caloric restriction (CR, green) groups before (T0, A) and after 3 weeks of treatment (3W, B) in young rats (Fraumene et al 2017). ... 41 Figure 9: Top 10 genera within the young rats gut microbiota fed ad libitum (AL, left) and with caloric restriction (CR, right) (Fraumene et al 2017). ... 42 Figure 10. Relative abundance variation of genera in young rats fecal microbiota after 8 weeks of ad libitum (AL) or caloric restriction (CR) diets (Fraumene et al 2017). ... 43 Figure 11: Beta-diversity and fecal microbiota composition of ad libitum (AL) and caloric restriction (CR) treated adult rats (Fraumene et al 2017). ... 44 Figure 12: Heatmap showing the relative log-transformed abundance distribution of Lactobacillus spp. OTUs among all samples. ... 45 Figure 13: Changes in taxonomic composition at genus level based on metaproteomic results obtained upon caloric restriction treatment on young rats. ... 47 Figure 14: Beta-diversity at functional level observed upon caloric restriction treatment on young rats.. ... 47
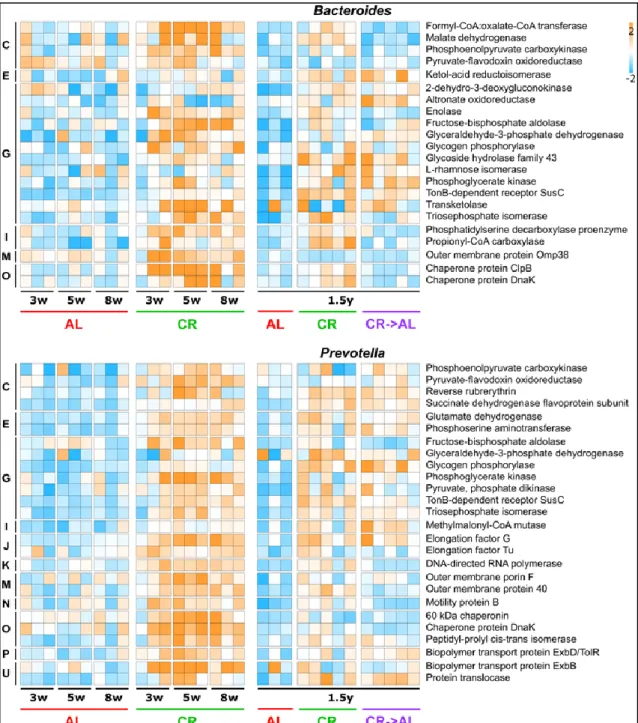
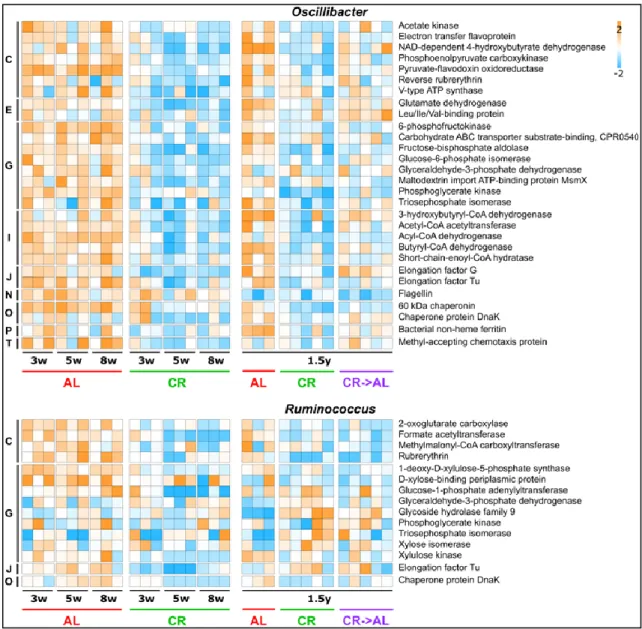
Figure 15: Changes in metaproteome functional expression observed upon caloric restriction treatment on young rats.. ... 48 Figure 16: Scatter plots showing the relative abundance of enzymes involved in short-chain fatty acid biosynthesis. ... 49 Table 2: Host differential functions upon caloric restriction treatment on young rats. ... 50 Figure 17: Schematic illustrating the experimental design of the study. ... 52 Figure 18: Adult rats (1.5 years of treatment): changes in fecal samples taxonomic composition at genus level based on 16S rDNA gene sequencing (A) and metaproteomics (B). ... 55 Figure 19: Beta-diversity at functional level observed upon caloric restriction treatment on adult rats (1.5 years of treatment). ... 56 Figure 20: Changes in metaproteome functional expression observed upon caloric restriction treatment on adult rats (1.5 years of treatment)... 57 Figure 21: Functional expression profile of Lactobacillus (top) and Clostridium (bottom) metaproteomes. ... 59 Figure 22: Functional expression profile of Bacteroides and Prevotella metaproteomes. ... 61 Figure 23: Functional expression profile of Oscillibacter, and Ruminococcus metaproteomes. ... 62 Figure 24: Scatter plots showing the relative abundance of enzymes involved in short-chain fatty acid biosynthesis in adult rats. ... 63 Figure 25: Expression profile of butyrogenic enzymes in young and adult rats. ... 64 Figure 26: Expression profile of propionogenic enzymes in young and adult rats. .... 65 Figure 27: Expression profile of acetogenic enzymes in young and adult rats. ... 66 Table 3: Host differential functions upon caloric restriction treatment on adult rats. ... 67 Figure 28: Schematic illustrating the experimental design of the study. ... 69 Figure 29: Growth curves of rats following different dietary treatments. ... 72 Figure 30: Food intake/body weight ratio curve of rats following different dietary treatments. ... 72 Figure 31: Alpha-diversity and richness within groups after 4 weeks of different dietary treatments. ... 73
Figure 32: Beta-diversity at OTU level among groups at the beginning (T0), after 1
(1W), 3 (3W) and 4 weeks (4W) of different dietary treatments. ... 74
Figure 33: Relative abundance variation of families and genera in rats fecal microbiota after 4 weeks of different diets. ... 75
Figure 34: Genera with relative abundance variation among groups in rats fecal microbiota after 4 weeks of different diets. ... 77
Table 4: Differential taxa between sourdough-leavened and standard-leavened bread supplementation upon caloric restriction treatment on young rats. ... 77
Figure 35: Schematic illustrating the experimental design of the study. ... 80
Figure 36: Richness comparison within groups at different time points. ... 83
Figure 37: Alpha-diversity within groups at different time points. ... 84
Figure 38: Beta-diversity at OTU level among groups at different time points. ... 85
Figure 39: Beta-diversity at OTU level within groups at different time points. ... 85
Table 5: Differential taxa among groups at different time points. ... 86
Table 6: Differential OTU among groups at T0. ... 87
Table 7: Differential OTU among groups at T5. ... 88
Table 8: Differential OTU among groups at T10. ... 89
Figure 39: Taxa with relative abundance variation among groups in mice fecal microbiota during the treatment. ... 90
Figure 40: Schematic illustrating the experimental design of the study (Tanca et al 2017a). ... 98
Table 9: Gender, age and BMI of the human subjects selected for the study (Tanca et al 2017a). ... 101
Table 10: Taxonomic and functional annotation yields (Tanca et al 2017a). ... 102
Figure 41: Principal Component Analysis plots related to taxonomic and functional features (Tanca et al 2017a). ... 103
Figure 42: Main metagenome and metaproteome features of the gut microbiota (Tanca et al 2017a). ... 104
Table 11: Percentage of taxa and functions with differential abundance between the human gut metagenomes and metaproteomes analyzed in this study (Tanca et al 2017a). ... 105
Figure 43: Features with significantly differential abundance between gut metaproteome and metagenome (Tanca et al 2017a).. ... 106
Figure 44: Metabolic functions with differential abundance between MP and MG datasets mapped in the KEGG carbon metabolism pathway (Tanca et al 2017a). ... 107 Table 12: Percentage distribution of conserved and variable features within the human gut metagenomes and metaproteomes analyzed in this study (Tanca et al 2017a). ... 108 Figure 45: Inter-individual variability of gut microbiota features (Tanca et al 2017a). ... 110 Figure 46: KEGG orthology functional groups with significantly differential abundance between Firmicutes and Bacteroidetes (Tanca et al 2017a). ... 111 Figure 47: Schematic overview of gut microbiota metabolic pathways from carbohydrate uptake and degradation to the production of SCFAs (Tanca et al 2017a). ... 112 Figure 48: Active carbohydrate metabolism pathways and related taxonomic assignments (Tanca et al 2017a). ... 113 Figure 49: Schematic illustrating the experimental design of the study. ... 117 Table 13: Metrics and macronutrients intake of the human subjects selected for the study. ... 121 Figure 50: Principal coordinate analysis plots related to taxonomic, functional and taxa/function combined features based on the studied population gender. ... 123 Figure 51: Principal coordinate analysis plots related to taxonomic, functional and taxa/function combined features based on the studied population age. ... 124 Figure 52: Principal coordinate analysis plots related to taxonomic, functional and taxa/function combined features based on the studied population ... 125 Table 14: Summary of the differential abundant features detected in each comparison.. ... 126 Table 15: Differential abundant features at taxonomy level in each comparison. ... 127 Figure 53: One-week dietary diary facsimile. ... 129 Table 16: Differential abundant active functions in each comparison. ... 130 Table 17: Differential abundant potential functions in each comparison. ... 132 Table 18: Differential abundant protein family/order combinations on MG data in each comparison. ... 132 Table 19: Differential abundant protein family/order combinations on MP data in each comparison. ... 134 Figure 54: Schematic illustrating the experimental design of the study. ... 136
Table 20: Metrics of the T2D subjects selected for the study. ... 139 Table 21: Metrics of the healthy controls selected for the study. ... 139 Table 22: OTU richness and alpha-diversity within groups at the beginning and after the end of the dietary treatment. ... 140 Figure 55: Beta-diversity at OTU level among groups at the beginning and after the dietary intervention. ... 140 Figure 56: Beta-diversity at OTU level within groups at different time points. ... 141 Figure 57: Families and genera with relative abundance variation among groups at the beginning and after the dietary intervention. ... 142 Figure 58: Schematic illustrating the experimental design of the study. ... 144 Figure 59: Alpha-diversity and richness distribution along the gastrointestinal tracts of a pre-weaned lamb. ... 151 Figure 60: Beta-diversity at OTU level within the gastrointestinal tracts of a pre-weaned lamb. ... 151 Figure 61: Top 20 microbial families distribution along the gastrointestinal tracts of a pre-weaned lamb. ... 152 Table 23: Peptide spectrum matches (PSMs) detected and taxonomic and functional annotated in each GI tract of a pre-weaned lamb. ... 154 Table 24: Top 20 microbial functions detected in the lumen of rumen and large intestine of a pre-weaned lamb. ... 155 Figure 62: Taxonomic composition of the sheep fecal prokaryotic microbiota, according to V4-16S rRNA (16S, left), metagenomic (MG, center) and metaproteomic (MP, right) results (Tanca et al 2017b).. ... 157 Figure 63: Functional potential and activity of the sheep fecal microbiota, as measured by metagenomics (MG, left) and metaproteomics (MP, right), respectively (Tanca et al 2017b). ... 158 Table 25: Protein families assigned exclusively to a single phylum and detected in all samples. ... 160 Figure: 64. Metabolic pathway potential and activity of the sheep fecal microbiota, as measured by metagenomics (MG, left) and metaproteomics (MP, right), respectively (Tanca et al 2017b). ... 162 Figure 65: Enzymatic functions identified by metaproteomics and mapped in the KEGG carbon metabolism pathway. ... 164
Table 26: Carbohydrate ABC transporter genes and proteins identified in the fecal microbiota of all sheep by metagenomics and metaproteomics, respectively. ... 165
List of Abbreviations
ABC: ammonium bicarbonateACN: acetonitrile AL: ad libitum
AL+F: ad libitum + functional bread AL+S: ad libitum + standard bread ANOVA: analysis of variance BMI: body mass index bps: base pairs
BW: body weight CD: celiac disease
CFUs: colony-forming units
COG: Clusters of Orthologous Group CR: caloric restriction
CR+F: caloric restriction + functional bread CR+S: caloric restriction + standard bread
CR->AL: 1-week reversion from caloric restriction to ad libitum
CREA: Council for Agricultural Research and Analysis of Agricultural Economics CV: coefficient of variation
DC: differential centrifugation DL: direct lysis
DTT: dithiothreitol
ENA: European Nucleotide Archive FASP: filter-aided sample preparation F/B ratio: Firmicutes/Bacteroidetes ratio FDR: false discovery rate
GH: glycoside hydrolase GI: gastrointestinal H2: hydrogen
HCD: Higher Energy Collisional Dissociation HLA: human leukocyte antigen
HMP: Human Microbiome Project IAM: iodoacetamide
ibb: inverted beta binomial IBD: inflammatory bowel disease
ISA-CNR: Institute of Food Sciences of the National Research Council KEGG: Kyoto Encyclopedia of Genes and Genomes
LC: liquid chromatography LCA: lowest common ancestor LPS: lipopolysaccharide
MetaHIT: metagenomics of the human intestinal tract MG: metagenomics
MP: metaproteomics
MRS: De Man-Rogosa-Sharpe MS/MS: tandem mass
NAFLD: non-alcoholic fatty liver disease
NCBI-nr: National Center for Biotechnology Information non-redundant NGS: next generation sequencing
NIH: National Institute of Health ORF: open reading frame
OTUs: operational taxonomic units PCA: Principal Components Analysis PCoA: principal coordinate analysis PCR: polymerase chain reaction PSM: peptide-spectrum match
QIIME: Quantitative Insights Into Microbial Ecology RLE: Relative Log Expression
rRNA: ribosomal RNA
SDS: sodium dodecyl sulfate spp.: species
T2D: type 2 diabetes
TMAO: trimethylamine-N-oxide V3: 16S rDNA variable region 3 V4: 16S rDNA variable region 4 WGS: whole genome shotgun WHO: World Health Organization
Background
The term “microbiome", nowadays often substituted with "microbiota", was introduced for the first time in 2001 by Joshua Lederberg to define “the ecological community of commensal, symbiotic, and pathogenic microorganisms that literally share our body space and have been all but ignored as determinants of health and disease" (Lederberg and McCray 2001). Humans and animals, indeed, carry a huge load of microbes that populate most of their surfaces and outnumber the host cells by an estimated ratio of 10:1 (Savage 1977).
The human (and animal) microbiota include bacteria, fungi, archaea, protists, and viruses, distributed throughout the different body sites (i.e. oral cavity, vagina, upper respiratory tract, skin, and gastrointestinal tract).
Some of these microorganisms can cause illnesses, and are thus to be considered as pathogens, but they are only a minimal percentage. Rather, the majority are harmless commensal, often essential for the host health.
For this reason, and with the advent of the high-throughput next generation sequencing (NGS) techniques, the studies inspecting the microbiota are increased in an exponentially way. The project that, beyond the shadow of a doubt, marked the beginning of the era of microbiome studies is the Human Microbiome Project (HMP). This project was launched in 2007 by the National Institute of Health (NIH) of the United States of America with the ambitious purpose of describing the microbial diversity associated with health and disease (Peterson et al 2009). To this aim, 300 healthy adults were recruited and both 16S rDNA gene and microbiome genomes (also known as metagenome) were sequenced from 5 major body sites (18 subsites): nasal passages, oral cavities, skin, gastrointestinal (GI) tract, and urogenital/vaginal tract. In 2010, 178 genomes and 550,000 genes were sequenced and published (Nelson et al 2010), with the goal, today, to sequence 3,000 reference genomes.
HMP and several other studies highlighted the different composition of microbiota depending on the body localization (HMP Consortium 2012, Costello et al 2009, Grice et al 2008, Qin et al 2010, Ravel et al 2011, Willner et al 2011). As illustrated in Figure
1, the human microbiome is composed basically by four phyla, Actinobacteria, Bacteroidetes, Firmicutes, and Proteobacteria, but their relative abundance, and those of their lower taxa, differ tremendously according to the body site; for example the gut is dominated by Bacteroidetes and Firmicutes, while vagina by Lactobacillus spp., and oral cavity by Streptococcus spp. (Morgan et al 2013).
Figure 1: A map of microbial diversity in the human microbiota (Morgan et al 2013). A specific
bacterial taxonomy distribution characterizes each body site. Districts with similar chemical and physical features are more related than others.
The diverse composition derived in the first place from chemical and physical features that characterize each district, such as pH, nourishment availability, aerobic or anaerobic conditions. Furthermore, after the colonization, key microorganisms can modify the habitat to which they adapt, triggering microbial occurrence and co-exclusion. The final result is that each body site is a highly specialized niche, where
members of the microbial community interact with each other and with the host environment (Grice and Segre 2012).
The gut microbiota
The gut microbiota is certainly one of the most studied microbial community among those that reside in the human body, as demonstrated by two important projects currently underway: the Metagenomics of the Human intestinal tract (MetaHIT), financed by European Union, and the American Gut Project, the world’s largest crowd-funded citizen science project in existence. The GI tract was one of the first human ecosystems to be examined by whole genome shotgun (WGS) metagenomic analysis (Gill et al 2006). Because of their easy to be obtained and of the large amount of biomass which contain, fecal samples are regularly used as a proxy of the GI microbiota.
The human intestine is home for approximately up to 100 trillion (1014) microbial cells, while the total number of microbial genes could be more than 100-fold superior than the total number of human genes (Backhed et al 2005, Ley et al 2006). Despite the gut core microbiota is composed mainly by Firmicutes and Bacteroidetes phyla and less by Actinobacteria and Proteobacteria, each individual has an exclusive intestinal flora signature, composed of up to 5000 microbial taxa (HMP Consortium 2012, Dethlefsen et al 2008, Tap et al 2009).
The gut microbiota is now considered just like a real organ, that contributes in an essential way to the development of the immune system (Ahern et al 2014), to the host metabolism and the energy production (Koropatkin et al 2012), and to the protection from enteropathogen invasion (Fukuda et al 2011).
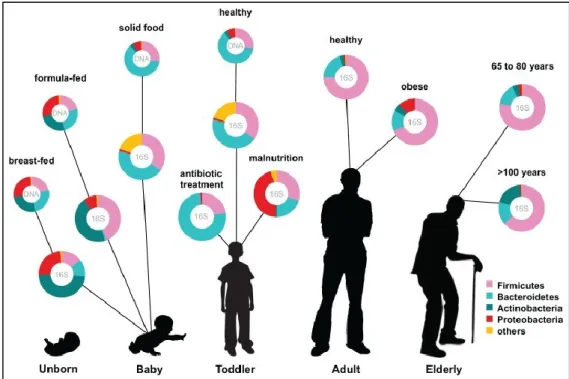
Colonization of the GI tract begins at birth and evolves and shapes over a lifetime. The newborn's gut is characterized by a low diversity flora, composed mainly of mother inherited and environmental bacteria acquired at birth (Koenig et al 2011, Scholtens et al 2012).
Figure 2: Human microbiota colonization and shaping through age progression and perturbations (Ottman et al 2012).
Gestational age, mode of delivery (natural or caesarean birth), diet (breast or formula feeding) and exposure to antibiotics are factors that influence the early colonization (Fouhy et al 2012, Marques et al 2010). Later on, gut microbiota complexity increases, with new microbes populating through feeding and other contacts, until becoming more stable, diverse and rich in adulthood, with the dominance of Firmicutes and Bacteroidetes (Figure 2) (Ottman et al 2012, Rajilic-Stojanovic et al 2009, Scholtens et al 2012).
Distinct microbes communities are present along the small intestine, caecum and large intestine (colon), given the diverse physiological variations along its length that include pH and nutrient gradients, mucus layer and host immune system (Donaldson et al 2016). First colonization, age progression, host genetics and countless environmental factors, such as diet, chemical exposition, lifestyle, can contribute to define the adult structure of the gut microbiota. Once composed, GI ecosystem results being partially stable in adulthood, as firstly noted by Caporaso and colleagues (Caporaso et al 2011a). Conservation of several taxa was confirmed by a number of long-term studies: from 75% of microbes in terms of relative abundance that persists after one year, up to 60% of strains detected in a 5 years monitoring (Faith et al 2013, Martinez et al
2013). Short- and long-terms stability is verified also after dietary change and antibiotic treatments, suggesting the resilience property of microbiota (David et al 2014a, Dethlefsen and Relman 2011, Jernberg et al 2007, Lozupone et al 2012, Wu et al 2011). However, changes in the intestinal milieu can take place resulting in a global remodeling of microbial hierarchy, and sometimes in an imbalance between the gut microbiota and the host, denominated as dysbiosis. These imbalances are known to be associated or predispose individuals to many diseases, starting from inflammatory bowel disease (IBD) and its two main manifestations, Crohn’s disease and ulcerative colitis (Erickson et al 2012, Manichanh et al 2012), other gut intrinsic disorders such as colonic cancer and celiac disease (Arthur et al 2012, Girbovan et al 2017), metabolic syndromes, obesity (Turnbaugh et al 2009, Ussar et al 2015), diabetes (Karlsson et al 2013, Qin et al 2012), and non-alcoholic fatty liver disease (NAFLD) (Jiang et al 2015). In addition, the disruption of the intestinal community equilibrium can pave the way to pathogen invasion and/or pathobionts overgrowth, such as in Clostridium difficile infections (Rupnik et al 2009).
For these reasons, a better knowledge and characterization of the human microbiota is mandatory; firstly a comprehension of the interaction and alteration provoked by factors such as genotype, diseases, diet, age, and the exposition to drugs, and nutritional factors is necessary, then, in the near future, these data could allow scientists to selectively manipulate the gut microbiota in cases of dysbiosis-associated upsets.
Methods to characterize the gut microbiota
The investigations regarding the gut microbiota are almost always focused on its taxonomic characterization and, to a lesser extent, the metagenome analysis. Originally, taxonomic assignment was carried out through cultural techniques, making use of selective bacterial growth media and performing the identification on the base of morphological and metabolic features. The main drawback of this approach is that more than 80% of microbial species harbored by our gut could not be easily cultured, or are considered as uncultivable (Gevers et al 2012, Grice and Segre 2012).
Nowadays, the sequencing of 16S ribosomal RNA (rRNA) gene fragment is the most popular technique used for phylogenetic and taxonomic purposes. The 16S rRNA gene, which is present in all bacteria, is approximately 1,500 base pairs (bps) in length and contains both species-specific hypervariable regions and highly conserved sequences, which makes it well suited for polymerase chain reaction (PCR) amplification and sequencing (Hugenholtz and Pace 1996). However, 16S metagenomics presents many limitations, such as the huge variability in the number of 16S rRNA gene copies in bacterial genomes, PCR amplification bias, and difference in taxonomic assignment depending on the choice of the 16S rDNA variable region (Jumpstart Consortium Human Microbiome Project Data Generation Working Group 2012, Lamendella et al 2012, Schloss 2010). In addition, amplicon sequencing allows scientists to obtain information about the microbial taxonomy, but not about its gene assortment (Addis et al 2016, Ellegaard and Engel 2016), a limit that is partially overcome using specific tools to predict the functional profiling (Asshauer et al 2015, Langille et al 2013).
Shotgun metagenomics is another DNA-based approach, that consists in sequencing the whole microbial DNA, including bacteria, viruses and fungi, instead of amplifying a specific procariotic or eucariotic target locus. After extraction, DNA is subjected to fragmentation and sequenced, producing a great number of microbial sequences; sequences are then taxonomically and functionally annotated by aligning them to reference genomes, including bacteria, viruses and fungi, or with a "de novo" strategy (Lai et al 2012, Sharpton 2014). For these reasons, shotgun metagenomics provides information about both the taxonomic composition as well as functional genes. Nevertheless, metagenomics data presents several challenges. The first one is represented by the great complexity and dimension of the data generated, that affect the computational analysis, in terms of power and pipeline (Sharpton 2014). In addition, a lack or a scarce number of sequences deriving from poorly represented genomes could make difficult the assembly and alignment steps (Mende et al 2012). Furthermore, microbial DNA could be overwhelmed by unwanted host DNA, requiring molecular and bioinformatics strategy to filter it out (Garcia-Garcera et al 2013,
Schmieder and Edwards 2011). Finally, only genetic potential is investigated, while no information is provided about actively expressed functions.
In order to investigate the microbiota active functions, it is necessary to unveil the microbiota members expression profile (metatranscriptomics) or the protein products (metaproteomics).
Metatranscriptomics refers to the analysis of both rRNA and mRNA expressed by a microbial community. mRNAs provide an instantaneous image of the microbes responses to an external stimulus, that may alter the environmental conditions (Tveit et al 2014). After extraction, RNA is reverse transcripted to cDNA, and analyzed by high-throughput sequencing technologies (RNA-seq) (Giannoukos et al 2012). The main challenges in a metatranscriptomics analysis are the low stability of RNA and sequence assembly and annotation issues (Abram 2015).
Metaproteomics provides a direct measure of the active functions of the microbiota by studying the entire microbial proteomes. Host proteins are also detected and, although they may sometimes be considered as contaminants, they give researchers information about the host milieu and its response to the microbiota (Valles-Colomer et al 2016). In addition, post-translational modifications can also be analyzed (Ahrens et al 2010). Typically, a metaproteomic pipeline consists on protein extraction, their hydrolysis with proteolytic enzymes in order to generate a complex peptide mixture, which is analyzed by liquid chromatography (LC) separation systems with high-resolution mass spectrometers (MS). Metaproteomics requires appropriate databases for peptide identification, and their construction and annotation is of course the most complex bioinformatics task concerning this approach (Muth et al 2013). Since the majority of the gut microbial genomes are poorly or absolutely not characterized, the availability of metagenomic sequences from the community being studied is fundamental for a satisfactory protein identification (Tanca et al 2014).
Finally, the systematic analysis of the metabolites produced by microbial communities, named metametabolomics, is a currently established approach for functional microbiota analyses and it is growing together with the other methodologies in an integrated fashion.
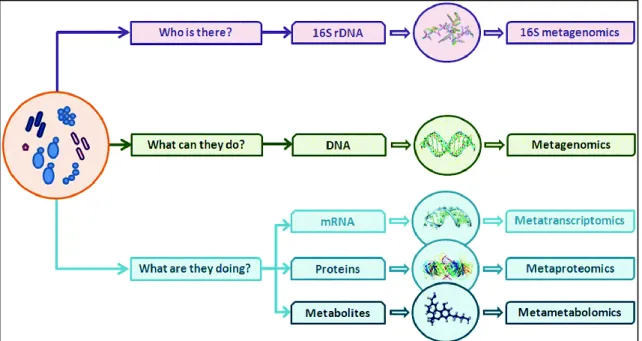
Therefore, the choice of the best approach for studying the gut flora depends essentially on the question to be asked: 16S rDNA data provides exclusively information regarding the taxonomy, answering the question "who is there?"; metagenomics gives not only a understanding of the taxonomic composition of a microbial community, but also of its gene potential, answering the question "what could they do?"; finally, metaproteomics and metatranscriptomics, as well as metametabolomics, take a picture of what microbes are really doing in a specific moments (Figure 3) (Addis et al 2016, Sharpton 2014).
Figure 3: Outline of the approaches available for the study of the gut microbiota (Addis et al 2016).
Gut microbiota and diet
Diet has without a doubt an important role in modifying human gut microbiota as strong as medication. Since birth, maternal nutrition shapes the gut microbiota composition of breastfed newborns (Cabrera-Rubio et al 2012, Ma et al 2014). The amount, type and balance of the main dietary macronutrients (carbohydrates, proteins and fats) have a great impact on the intestinal flora. Many food components, such as plant-derived complex carbohydrates (i.e., fibers and resistant starch), that cannot be digested by the human digestive system, become primary substrates for our GI microbes, being capable of breaking down and fermenting them.
Dietary fiber provides a considerable amount of substrate to the intestinal microflora; it includes a broad array of nondigestible carbohydrates derived by plant cell wall components, such as cellulose and xylans, and storage polysaccharides, such as resistant starch and inulin (Salonen and de Vos 2014). Our gut microbiota is able to produce thousand of enzymes in order to ferment fiber into short-chain fatty acids (SCFAs), hydrogen (H2), methane and carbon dioxide, that are the main metabolic
end-products (El Kaoutari et al 2013, Slavin 2013).
SCFAs, mainly acetate, butyrate and propionate, are involved in various essential processes: energy source for colonocytes, anticancer and anti-inflammatory effects (butyrate) (Leonel and Alvarez-Leite 2012, Salonen and de Vos 2014); gluconeogenesis and protection from diet-induced obesity (propionate) (De Vadder et al 2014); lipogenesis in the liver (acetate) (Vipperla and O'Keefe 2012); histone deacetylase inhibition (acetate and butyrate) (Sonnenburg and Backhed 2016). SCFAs also reduce the luminal pH, contrasting the growth and the activity of pathogens (Kashtanova et al 2016); finally, they are involved in tissue repairing, epithelial integrity maintenance, secretion of IgA by B cells, and promotion of regulatory T cell response in the gut (Thorburn et al 2014).
In addition to provide fermentable substrates in the colon, dietary fiber promotes also the transit rate increase (Salonen and de Vos 2014). A fiber-rich diet is often associated to a healthy condition, both for the host and the intestinal community; several studies have shown that dietary fiber has a preventive and a therapeutic role in many disorders, including cardiovascular diseases, type II diabetes and obesity (Bodinham et al 2012, Hauner et al 2012, Murphy et al 2012).
Dietary proteins are an important part of a balanced diet, as they serve not only as the major source of nitrogen for the microbes growth, but also to enhance carbohydrates fermentation and assimilation, contributing to the health of the bowel. However, some end-products of protein, such as ammonia, hydrogen sulphide, amines, phenols, thiols and indoles, have been shown to be cytotoxic, genotoxic and carcinogenic (Conlon and Bird 2014, Toden et al 2005), while trimethylamine-N-oxide (TMAO), a metabolite from L-carnitine (abundant in red meat) and phosphatidylcholine (cheese, seafood eggs and
meat), have been associated with atherosclerosis promotion (Koeth et al 2013, Wang et al 2011).
An endogenous source of protein, alternative to those taken with the diet, are the mucins secreted from goblet cells, that assemble an extra GI layer important for the luminal protection (Johansson et al 2013). Mucins provide an always available protein resource and, with their high polysaccharide content, they may constitute half of the carbon flux in the intestinal tract (Salonen and de Vos 2014). Only few microorganisms are capable to utilize this nutrient source and most of all as alternative substrate (Png et al 2010); in case of scarcity of nutrients, dietary fiber in particular, some gut microbiota species can shift from polysaccharides to mucus glycan metabolism, causing the reduction of the mucus layer thickness and promoting access by mucosal pathogen (Desai et al 2016, Earle et al 2015).
Dietary fat also influences the composition and metabolic activity of the gut microbiota. High fat diet induces increased circulating levels of bacterial lipopolysaccharide (LPS) in humans (Moreira et al 2012), possibly as a consequence of increased intestinal permeability, and it has been associated with obesity, hepatic steatosis, non-alcoholic fat liver disease (NAFLD) (de Wit et al 2012, Devkota et al 2012, Kubeck et al 2016), and IBD (de Wit et al 2012, Devkota et al 2012, Kubeck et al 2016).
Fat intake influences the gut microbiota in an indirect manner too, through the hepatic production and release of bile acids. These molecules have antibacterial property and create a significant selection among the intestinal microbiota, but some microbial secondary bile acids products are potentially carcinogenic and are associated with the development of colorectal cancer and NAFLD (Mouzaki et al 2016, Ou et al 2012). The exposure to a specific dietary pattern since youth affects tremendously our intestinal flora, selecting microbes on the basis of their capability to metabolize what the menu offers. For example, different studies have demonstrated that the gut microbiota of rural or hunter-gatherer Africans is equipped with a broad-spectrum of enzymes that are able to degrade dietary complex polysaccharides, while most of
these enzymes completely lacking in the Western populations that follow a high fat and protein diet (De Filippo et al 2010, Rampelli et al 2015, Yatsunenko et al 2012). If long-term dietary habits have a strong impact on the intestinal ecosystem, human gut responds also to immediate changes in diet (David et al 2014b); however, the gut microbiome is generally resilient and short-term dietary intervention is unusually successful in treating obesity and malnutrition (Xu and Knight 2015).
Nowadays scientists are paying specific attention to dietary intervention, as demonstrated by the huge number of studies regarding probiotics, prebiotics and functional foods administration. Once the complex interactions between dietary components and gut microbes will be elucidated and deepened, diet could aim for becoming an easier and cheaper remedy against dysbiotic and pathological conditions than drugs and traditional therapy.
Aim of the research project
In keeping with the considerations outlined in the introduction, the main objective of this project is the study of the interactions of the gut microbiota with the diet.
Accordingly, the following aims are established:
Aim 1: to develop experimental animal models for the metaproteogenomic characterization of diet-induced changes of the gut microbiota.
Aim 2: to characterize the gut microbiota in human and livestocks through a metaproteogenomic approach.
Aim 3: to describe the gut microbiome taxonomic and functional features in human cohorts according to their dietary habits and to dietary interventions.
Chapter 1:
Animal models for the study of gut
microbiota and diet interactions
1.1 Introduction
Animal models are commonly used by scientists to investigate human diseases in the event that experimentation on humans would be impracticable or unethical. Cancer, metabolic syndromes, autoimmune disorders, chronic diseases are only few examples of research branches that are investigated with the support of models, often in rodents.
Since the active role of the gut microbiota in human health and disease has been hypothesized, the gut microbiota of several animal models has become subject of study (Gkouskou et al 2014, Silverman et al 2017, Tomkovich et al 2017).
The advantages in using animals are innumerable: feces can be sampled easily and frequently; individuals can be sacrificed after the experiment to analyze different tissues or samples (i.e. cecal contents or liver); in disease models, sampling can take place before the onset and during the progression of the pathology; experimental design and parameters are more controlled, making the inter-individual variability smaller than in humans. In addition, there is a large use of animal without an intestinal flora - called germ-free - or with a controlled one - named gnotobiotic - that provide an invaluable experimental tool for investigating the interactions between host and microbiota, and are ideal for fecal transplantation or single strain administration experiments (Al-Asmakh and Zadjali 2015, Martin et al 2016).
In contrast, some factors need to be taken into account when dealing with animal models: firstly, the gut microbiota could not replicate the same development and
function occurring in the human one, neither the taxonomy could be comparable due to environmental and anatomical differences; several husbandry aspects, such as cohousing, degree of kinship, sex, feeding, handling, have an effect on microbiota and must be evaluated and if possible reduced; not least, especially in long-time experiments, animals with specific genotypes can get sick or die prematurely, resulting in a drop of the number of samples and consequently in a lower statistical power. As for dietary treatments, mice and rats become good actors when ethical and compliance matters impede to test extreme diets (i.e. high-fat diet) or overfeeding in humans; moreover, studies with animals allow researchers to investigate both slight dietary intervention (supplement/removal of a single nutrient) and long-term diet habit (eating always the same food).
As an example, in diet-induced obesity scientists have shed light on the strong association of the gut microbiota to the disease when, after fecal transplantation from obese to germ-free mice or from lean to obese ones, the phenotype of the receiving was transformed in that of the donor (Ridaura et al 2013, Turnbaugh et al 2006). Hence, animal models represent an important instrument to investigate the interaction among diet, gut flora and disease before moving to humans, if possible, and, when studies are well designed, to ensure a better control of the experimental variables and the inter-variability among individuals.
1.2 Caloric restriction promotes rapid expansion
and long-lasting increase of Lactobacillus in the rat
fecal microbiota
1.2.1 Aim of the study
In this study, it was investigated whether fecal microbiota variation is induced by short-term caloric restriction (CR) and whether such change perseveres in long-lasting CR, in a rat model of aging (Marongiu et al 2016). Animals were fed ad libitum (AL), as for the majority of murine experimental models. This condition might be assimilated to overfeeding, given the poor energy expenditure in the animal house settings, compared to wild rats in their natural environments.
The results reported in this chapter have been partially published on Gut Microbes (Fraumene et al 2017).
1.2.2 Experimental design
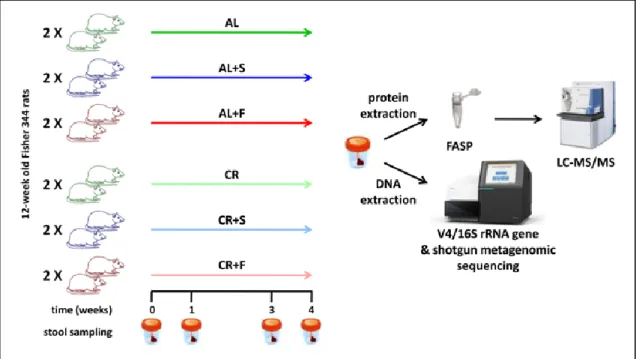
Fecal microbiota was evaluated in young growing and adult Fisher 344 rats, comparing animals fed AL and animals fed with 70% of the AL ratio (CR), in order to shed light on timing and nature of microbial composition and functional changes. Both 16S metagenomics and metaproteomics (MP) approaches were employed, as illustrated in Figure 4.
1.2.3 Material & Methods
Animal intervention and sampling
A total of 22 Fisher 344 male rats, from a colony available at the Department of Biomedical Sciences, University of Cagliari, were used. Rats were fed with Purina Rodent Lab Chow diet (3% of fat, Mucedola srl, Settimo Milanese, Italy) until the age of 8 weeks. Then animals were reared two per cage and split in two groups of 6: the first was maintained on the AL diet, the latter was provided 70% of the AL ratio (CR). Food to CR group was delivered every night at 1AM through a computer assisted automated food dispenser. Stool samples were collected one week before the beginning of the treatment, after 3, 5 and 8 weeks. In a parallel experiment, 10 rats were fed as described above since the age of 8 weeks and up to their mid-life. Feces were sampled after 36 weeks of CR treatment (6 rats) and from controls (4 rats) fed AL. Animal studies were reviewed and approved by the Institutional Animal Care and Use Committee of the University of Cagliari.
All collected fecal samples (N = 58) were immediately stored at -80°C until use. At the time of the analyses, feces were thawed at 4°C, and, in cases of both DNA and protein extraction, two portions were collected from each of them.
To evaluate the abundance of Lactobacillus spp. in fecal samples, bacterial cultures were conducted on De Man-Rogosa-Sharpe Agar (MRS, Oxoid, Basingstoke, UK) added with the fungicide cycloheximide (7 µg/mL, Sigma-Aldrich, Saint Louis, MO, USA) in anaerobic condition at 37°C. Lactobacillus colonies were identified according to their morphology and then by a genus-specific PCR amplification (Rinttila et al 2004).
Sequencing of the 16S rRNA gene
A total of 46 rat feces sampled one week before and 3 and 8 weeks after the beginning of the treatment, were subjected to DNA extraction with the QIAamp Fast Stool Kit protocol (QIAGEN, Hilden, Germany), following the manufacturer's instructions. After extraction, DNA was purified according to E.Z.N.A.® Soil DNA Kit (Omega Bio-Tek, Norcross, GA, USA) and quantified with a Qubit 2.0 Fluorometer (Life Technologies, Grand Island, NY, USA), using the Qubit® dsDNA High Sensitivity Assay Kit (Life Technologies). In the adult rats samples the full-length 16S rRNA gene was amplified using the universal primers 27F-1492R (AGAGTTTGATYMTGGCTCAG and TACGGYTACCTTGTTACGACTT, respectively) (Hugenholtz et al 2001). In the young rats samples the V4 region of 16S rRNA was amplified according to Caporaso and co-workers' protocol (Caporaso et al 2011b). PCR products were confirmed on 2% agarose gel (Sigma Aldrich). The gene amplification reaction was performed in duplicate for each experiment, pooled together, cleaned up with AMPure XP magnetic beads (Beckman Coulter, Brea, CA, USA) and quantified using the Qubit HS assay (Life Technologies). Sample libraries were made according to the Illumina Nextera XT sample preparation protocol (Illumina, San Diego, CA, USA) and then checked for quality on a 2100 BioAnalyzer with a DNA 1000 kit (Agilent Technologies, Santa Clara, CA, USA). The average insert size was around 500 bps. Libraries were quantified with the Qubit® dsDNA Broad-Range Assay Kits (Life Technologies), normalized and, after pooling, subjected to the cluster generation step with the cBOT cluster generation station, following the Illumina TruSeq Paired-End Cluster Kit protocol instructions. DNA sequencing was carried out using the Illumina HiScanSQ sequencer, using the paired-end method and 93 cycles of sequencing.
Shotgun metagenomics sequencing
A total of 12 fecal samples equally distributed among treatment groups and time points were subjected to whole metagenome sequencing in order to create an "in house" sequence database for the metaproteomic identification. DNA was extracted, purified and quantified as mentioned in the above section. Then DNA was randomly
tagmented and libraries were constructed according to the Nextera XT kit instruction. After quality control on a BioAnalyzer High Sensitivity DNA Chip (Agilent Technologies), quantification with the Qubit® dsDNA High Sensitivity, normalization and pooling, libraries were sequenced with the HiScanSQ sequencer, using also in this case the paired-end method and 93 cycles.
Bioinformatics and statistical analysis of sequencing data
After sequencing, all obtained reads were subjected to a demultiplexing step using Casava software (version 1.8.2) implemented in HiScan control software (Illumina). Then FASTX-Toolkit was used to trim reads for the first 20 bps, while sequences with Nextera adapter contamination were identified with the UniVec database (ftp://ftp.ncbi.nlm.nih.gov/pub/UniVec/) and removed.
The paired-end reads with a minimum overlap of eight base pairs were merged using the script join_paired_ends.py contained into the bioinformatics platform Quantitative Insights Into Microbial Ecology (QIIME) (version 1.9.1) (Caporaso et al 2010). Operational taxonomic units (OTUs) generation was performed with a QIIME pipeline
following the USEARCH's OTU clustering recommendations
(http://www.drive5.com/usearch/manual/otu_clustering.html); the closed-reference OTU picking was used to allow clustering of shotgun 16S sequences (Tanca et al 2017c). OTUs were obtained after clustering reads at 97% identity using UCLUST (Edgar 2010). Taxonomy assignment of resulting OTUs was performed using the Greengenes database (version 13_8) (DeSantis et al 2006). A number of OTUs were assigned to taxa given in square brackets, including [Prevotella], [Paraprevotellaceae] [Ruminococcus]
gnavus, and [Clostridium] difficile. These outputs from QIIME analyses refer to
taxonomic assignments recommend by GreenGenes, mainly based on genome trees. As normalization step, rarefaction to equal sequencing depth was performed on all samples in each experiment. Richness was quantified as observed OTU counts, while alpha diversity was calculated based on Shannon diversity index; the statistical significance regarding differences in microbial community composition index between
sample categories was determined by non-parametric Monte Carlo permuted two-sided t-test (999 permutation).
Rarefied OTU tables were employed to perform Principal Components Analysis (PCA) and to generate PCA plots using the web platform MetaboAnalyst (version 3.0) (http:// http://www.metaboanalyst.ca/) (Xia and Wishart 2016); boxplots and scatter plots were created using GraphPad Prism (version 5.03), while heatmap was produced with the web application ClustVis (http://biit.cs.ut.ee/clustvis) (Metsalu and Vilo 2015) and edited using Inkscape (https://inkscape.org).
Sequence similarity search was performed via the BLAST [nucleotide] tool available in the European Nucleotide Archive (ENA) website, using default search parameters (http://www.ebi.ac.uk/Tools/sss/ncbiblast/nucleotide.html).
OTUs with differential abundance between the two sample groups were obtained by applying a negative binomial generalized linear model (Wald test within the DESeq2 module available in QIIME) (Love et al 2014) to the raw OTU counts. Differential abundance analysis at genus level was carried out between groups using Student’s t test after log transformation and pareto scaling, while analysis within groups on paired data was performed with an established paired sample test for count data based on an
inverted beta binomial model, available in ibb R package
(http://www.oncoproteomics.nl/software/BetaBinomial.html) (Pham and Jimenez 2012). P-values were corrected for multiple inference using the Benjamini-Hochberg FDR procedure with an adjusted alpha cutoff value of 0.05.
Metagenome bioinformatics
Raw metagenomic reads were either filtered and clustered without assembly, or assembled into contigs. In the first case, read processing was performed with tools from the USEARCH suite (version 8.0.1623) (Edgar 2010). In particular, the following steps were carried out in succession: merging of paired reads (fastq_mergepairs command, setting parameters as follows: fastq_truncqual 3, fastq_minovlen 8, fastq_maxdiffs 0), sorting (sortbylength command), quality filtering (fastq_filter command, with fastq_truncqual 15 and fastq_minlen 100), and sequence clustering
(cluster_smallmem command, with 1 as identity threshold). In the second case, read assembly into contigs was performed using Velvet (version 1.2.10) (Zerbino and Birney 2008) with velveth command by setting 61 as k-mer length, and velvetg command by setting 200 as insert length and 300 as minimum contig length. FragGeneScan (version 1.30) (Rho et al 2010) was used for open reading frame (ORF) finding, with the training for Illumina sequencing reads with about 0.5 % error rate.
Protein sample preparation and mass spectrometry analysis
Proteins were extracted from a total of 36 fecal samples according to Tanca and colleagues' protocol (Tanca et al 2014). In detail, feces were resuspended in 100 μl of sodium dodecyl sulfate (SDS)-based reducing extraction buffer (2% SDS, 100 mM dithiothreitol, DTT, 20 mM Tris-HCl pH 8.8), incubated at 95°C for 20 min in agitation (500 rpm) in a Thermomixer Comfort (Eppendorf, Hamburg, Germany), and subsequently subjected to bead-beating combined with freeze-thawing as described below. To each sample a steel bead (5-mm diameter; Qiagen) was added; then, samples were incubated at −80°C for 10 min, subjected to bead-beating for 10 min (30 cycles/s in a TissueLyser LT mechanical homogenizer, Qiagen), incubated at −80°C for 10 min and then at 95°C for 10 min, and subjected to an additional bead-beating step of 10 min. Samples were lastly centrifuged at 20,000 × g for 10 min at 4°C, with the final supernatant being the protein extract. Extracted proteins were cleaned up, alkylated and subjected to trypsin digestion according to the filter-aided sample preparation (FASP) procedure (Wisniewski et al 2009), with minor modifications (Tanca et al 2013, Tanca et al 2015).
In detail, SDS protein extracts were diluted to 200 μL with a solution composed of 8M urea in 100 mM Tris-HCl, pH 8.8, filtrated by loading into Ultrafree® MC-GV centrifugal filters (Merck Millipore, Billerica, MA, USA) and then loaded into the Amicon® Ultra-0.5 centrifugal filter units with Ultracel-10 membrane (Merck Millipore). Samples were subjected to centrifugation at 14 000 × g for 15 min, then to dilution into the filter with 200 μL of the urea solution and again to centrifugation. Following centrifugation, the concentrates were mixed with 100 μL of iodoacetamide (IAM, 50 mM) in the urea
solution and incubated at 20°C for 20 min. After centrifugation, each concentrate was diluted with 100 μL of urea solution and concentrated again (this step was repeated twice). Next, concentrates were diluted with 100 μL of ammonium bicarbonate (ABC, 50 mM) and concentrated once more. This step was repeated another time. Subsequently, 40 μL of trypsin solution (150 ng in 50 mM ABC) were added to each filter, and the samples were incubated at 37°C overnight. Peptides were collected by centrifugation of the filter units, followed by a further wash step with 50 μL of a solution containing 70% acetonitrile (ACN) and 1% formic acid. Finally, the peptide mixtures were brought to dryness and resuspended in 0.2% formic acid to a final concentration of 1 mg/mL.
Peptide mixtures concentration was estimated by measuring absorbance at 280 nm with a NanoDrop 2000 spectrophotometer (Thermo Fisher Scientific, Waltham, MS, USA), using dilutions of the MassPREP E. coli Digest Standard (Waters, Milford, MA, USA) to generate a calibration curve. After quantification, tryptic digests coming from rats reared in the same cage (2 rats per cage) were equally pooled.
Liquid chromatography (LC)-tandem mass (MS/MS) analyses were carried out using an LTQ-Orbitrap Velos mass spectrometer (Thermo Fisher Scientific) interfaced with an UltiMate 3000 RSLCnano LC system (Thermo Fisher Scientific). The single-run one-dimensional LC peptide separation was performed as detailed by Tanca and colleagues: (Tanca et al 2013, Tanca et al 2014): peptide mixtures (4 μg per run) were loaded, concentrated and desalted on a trapping pre-column (Acclaim PepMap C18, 75 μm × 2 cm nanoViper, 3 μm, 100 Å, Thermo Fisher Scientific), using 0.2% formic acid at a flow rate of 5 μl/min. Then, peptides were separated with a C18 column (Acclaim PepMap RSLC C18, 75 μm × 15 cm nanoViper, 2 μm, 100 Å, Thermo Fisher Scientific) at 35°C with a flow rate of 300 nL/min, using a 247-min gradient from 1% to 50% eluent B (0.2% formic acid in 95% ACN) in eluent A (0.2% formic acid in 5% ACN). The mass spectrometer was set up in a data dependent MS/MS mode under direct control of the Xcalibur software (version 1.0.2.65 SP2), where a full scan spectrum (from 300 to 1700 m/z) was followed by MS/MS spectra. The instrument was operated in positive mode with a spray voltage of 1.2 kV, a capillary temperature of 275°C, and was calibrated
before measurements. Full scans and MS/MS spectra were carried out in the Orbitrap with resolution of 30,000 and 7,500 at 400 m/z, respectively. The automatic gain control was regulated to 1,000,000 ions and the lock mass option was enabled on a protonated polydimethylcyclosiloxane background ion ((Si(CH3)2O)6; m/z =
445.120025) as internal recalibration for accurate mass measurements (Olsen et al 2005). Peptide ions were chosen as the ten most intense peaks (Top 10) of the previous scan. 500 counts was set as the signal threshold for activating an MS/MS event. Higher Energy Collisional Dissociation (HCD) was performed at the far side of the C-trap and was selected as the method of fragmentation, with the following parameters: 40% value for normalized collision energy, isolation width of m/z 3.0, Q-value of 0.25, and activation time of 0.1 ms. Nitrogen was used as the collision gas.
Metaproteome bioinformatics
Microbial peptide identification was carried out using the Proteome Discoverer informatic platform (version 2.0; Thermo Fisher Scientific), with a workflow consisting of the following nodes (and respective parameters): Spectrum Selector for spectra preprocessing (precursor mass range: 350–5000 Da; S/N threshold: 1.5), SEQUEST-HT as search engine (enzyme: trypsin; maximum missed cleavage sites: 2; peptide length range 5–50 amino acids; maximum delta Cn: 0.05; precursor mass tolerance: 10 ppm; fragment mass tolerance: 0.02 Da; static modification: cysteine carbamidomethylation; dynamic modification: methionine oxidation), and percolator for peptide validation (false discovery rate, FDR, <1% based on peptide q-value). Only rank 1 peptides were kept after results filtering, and protein grouping was allowed according to the maximum parsimony principle.
A custom collection of metagenomic sequences obtained in house, as described in the previous section (7,422,716 sequences in total), was employed as sequence database, after joining ORF obtained both from non-assembled reads and from contigs. Host peptide identification was carried out with the Proteome Discoverer informatic platform (version 1.4; Thermo Fisher Scientific), using the protein sequences belonging to the order Rodentia and downloaded from UniProtKB/SwissProt (release 2017_05;
26,536 sequences in total) as database. Search engine and parameters were set as mentioned above for microbial peptide identification.
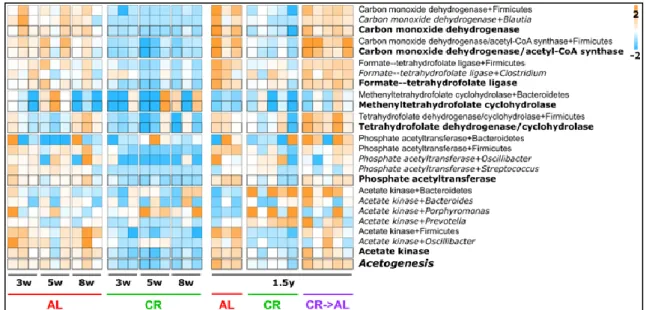
Taxonomic and functional annotation was carried out using multiple strategies. MEGAN (version 6.6.7) was used as first annotation option (Huson et al 2016). Protein sequences were preliminary subjected to a DIAMOND (version 0.8.22) search against the National Center for Biotechnology Information non-redundant (NCBI-nr) database (2016/09 update), using the blastp command with default parameters (Buchfink et al 2015); subsequently, DIAMOND outputs were loaded on MEGAN in order to perform both lowest common ancestor (LCA) classification and functional annotation (according to InterPro and eggNOG modules) using default parameters. Moreover, the Unipept web application (version 3.1; https://unipept.ugent.be) was used to carry out an LCA classification of the identified peptide sequences (Mesuere et al 2017). Finally, an additional functional annotation was accomplished by aligning with DIAMOND (blastp module, e-value threshold 10-5) the identified protein sequences against a database containing all bacterial sequences from UniProtKB/Swiss-Prot (release 2016/09); UniProtKB/Swiss-Prot accession numbers were then utilized to retrieve protein name and Kyoto Encyclopedia of Genes and Genomes (KEGG) orthologous group information from the UniProt website via the ‘retrieve’ tool (Pundir et al 2016). Taxonomic information from different sources were combined, giving priority to MEGAN results; functional information from different sources were examined, merged and made uniform manually. Butyrate, propionate and acetate biosynthetic pathways were reconstructed based on the corresponding KEGG pathway maps (Kanehisa et al 2016), available at http://www.genome.jp/kegg/pathway.html.
Metaproteomics statistical analysis and graph generation
Spectral counts were uploaded to the web application MicrobiomeAnalyst (http://www.microbiomeanalyst.ca) to evaluate differential abundance through comparative statistical analysis (Dhariwal et al 2017). Features with prevalence in <10% of samples in a given comparison were filtered out. Prior to statistical testing, count data were subjected to transformation in accordance with the Relative Log
Expression (RLE) method (Anders and Huber 2010). Differential abundance analysis was then performed using the edgeR algorithm (Anders et al 2013), with an adjusted P-value (FDR) cutoff of 0.05.
Relative abundance data (obtained by dividing the count data by the total number of counts in a sample) were employed to create PCA plots using the web application ClustVis with default parameters. Heatmaps were generated starting from relative abundance data with the web application Morpheus (https://clue.io/morpheus). Relative abundance values were transformed by subtracting the median abundance of a given taxonomic/functional feature in the dataset, and subsequently dividing by the median absolute deviation, as one of the ‘transform’ options available in the ‘color scheme’ menu. Scatter plots were generated using GraphPad Prism starting from relative abundance data, and Student’s t test was applied to calculate significant differences between total enzyme abundance means.
1.2.4 Results
Growth curves and serum lipids profile in rats fed AL or CR diet
Growth curves of AL and CR rats were well separated after only 3 weeks from the beginning of the CR diet (Figure 5).
Figure 5: Growth curves of young growing (A) and adult (B) rats during ad libitum (AL, red) and caloric restriction (CR, green) treatment (Fraumene et al 2017). Arrows indicate the different weeks at which
stools were collected, while the first point in which the two groups exhibit a statistically significant difference in weight is marked with an asterisk.
Animals fed AL showed initially a quick body weight increase and continued to gain weight until the 36th week, when their weight remained quite stable until the end of
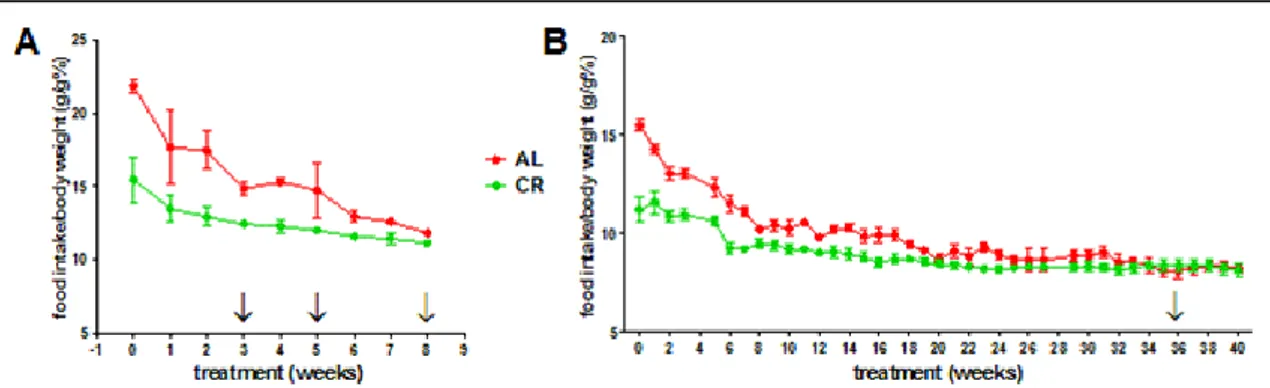
the experiment. On the contrary, rats fed CR showed a slower growth compared to AL until 21 weeks of treatment, after which their weight remained stable. These data are in accordance with the literature for the Fisher 344 rat strain (Armbrecht et al 1988). Although the absolute food consumption was 30% less in CR animals, after 28 weeks of feeding CR rats were fed an equal amount of diet compared to AL group in relation to their actual size, as their food intake/body weight ratio became comparable (Figure 6). Significant changes in serum lipids profile after both short-term and long-term CR are well established (Choi et al 1988). Interestingly, significant decreases in total cholesterol and triglycerides were observed to be already evident after 8 weeks of CR regimen (Figure 7).
Figure 6: Food intake/body weight ratio curve of young growing (A) and adult (B) rats during ad
libitum (AL, red) and caloric restriction (CR, green) treatment (Fraumene et al 2017). Arrows indicate
the different weeks at which stools were collected.
Figure 7: Lipid serum profile of young growing rats after 8 weeks of ad libitum (AL, red) and caloric restriction (CR, green) treatment (Fraumene et al 2017). Standard deviation and Student's t-test P value
Sequencing of 16S rDNA from the gut microbiota of young and adult Fisher 344 rats To investigate the gut microbiota composition in the Fisher 344 rats subjected to either CR or AL chow diet, feces were collected from the 12 young rats one week before the beginning of dietary intervention (T0) and after 3 and 8 weeks. (Figure 4, young rat experiment). Feces were also collected from 10 adult rats after 36 weeks from the beginning of CR and analyzed with 16S metagenomics (Figure 4, adult rat experiment).
Sequencing of the 16S amplicons, from a total of 46 fecal samples, enabled to obtain 30,107,702 and 3,358,687 reads, respectively for the young and the adult rats experiments, after the merging of paired-end reads. Richness, calculated as the number of OTUs detected within each community, showed no significant difference comparing samples from the two groups of animals of the same age (Table 1).
As reported above for richness, Shannon's index analyses indicated similarity in microbial diversity between the CR and AL young growing rats, with the exception of feces sampled after 3 weeks of CR intervention, that showed a significant lower alpha-diversity compared to the AL control group (P = 0.015) (Table 1). Taking into account that the richness was not influenced by dietary intervention, this difference in alpha-diversity might be related to a reduced uniformity of the gut microbial community composition after the first three weeks of CR treatment. It is remarkable that this coincided with the time point when CR animals were subjected to a sudden change in average food intake per body weight (Figure 6). In the same way, alpha-diversity index did not differ between adult rats with or without CR treatment (Table 1).
Richness (No. of detected OTUs) Alpha diversity (Shannon index) Treatment (weeks) AL CR AL CR
-1 1649.8 ±6.2 1652.4 ±14.0 7.147 ±0.569 7.691 ±0.798
3 1664.1 ±3.4 1661.0 ±7.1 8.495 ±0.066 8.231 ±0.183
8 1667.1 ±3.1 1666.6 ±2.0 8.409 ±0.091 8.255 ±0.219
36 1168.8 ±8.4 1167.4 ±6.5 7.723 ±0.219 7.475 ±0.199
Table 1: OTU richness and alpha-diversity within AL (ad libitum) and CR (caloric restriction) groups at different time points. Means and standard deviation of the number of detected OTUs and Shannon