1
Alma Mater Studiorum – Università di Bologna
DOTTORATO DI RICERCA IN
SCIENZE E TECNOLOGIE AGRARIE,
AMBIENTALI E ALIMENTARI
Ciclo XXVII
Settore Concorsuale di afferenza: 07/G1 Settore Scientifico disciplinare: AGR/17
TITOLO TESI
ANALYSIS OF THE PIG GENOME
FOR THE IDENTIFICATION OF GENOMIC REGIONS
AFFECTING PRODUCTION TRAITS
Presentata da:
Giuseppina Schiavo
Coordinatore Dottorato
Relatore
Prof. Giovanni Dinelli Prof. Luca Fontanesi
_______________________
___________________
2
Contents
General Introduction... 3
Italian Large White breed ... 3
The Pig Genome ... 4
Examples and application of genotype studies ... 5
Aim ... 7
CHAPTER 1 ... 9
A genome wide association study for backfat thickness in Italian Large White pigs using a selective genotyping approach ... 9
CHAPTER 2 ... 39
A genomewide association study for average daily gain in Italian Large White pigs ... 39
CHAPTER 3 ... 89
Copy number variants in Italian Large White pigs detected using high density single nucleotide polymorphisms and their association with back fat thickness ... 89
CHAPTER 4 ... 110
A retrospective analysis of major gene allele frequency changes during 20 years of selection in the Italian Large White pig breed ... 110
CHAPTER 5 ... 130
Twenty years of artificial directional selection have shaped the genome of the Italian Large White pig breed ... 130
CHAPTER 6 ... 188
Reduced representation libraries from DNA pools analysed with next generation semiconductor based-sequencing to identify SNPs in extreme and divergent pigs for back fat thickness ... 188
3
General Introduction
The Domestic Pig (Sus scrofa) originated from Wild Boar whose appearance in Eurasia has been estimated to go back to around 500,000 years. Since then, it has been spread in all over the world, with independent domestication events starting about 9,000 years ago, leading to breeds with highly different charachteristics from Europe to Asia (Groenen et al. 2012, Rubin et al. 2012). Depending on different market requirements, artificial selection pushed European commercial breeds toward two main different directions. In most part of Europe, customers requirements are oriented toward lean meat, and this aspects makes the “Heavy Pig” an almost completely Italian concept. Italian Large White pig selection started in the last decades, taking advantage of breeders and scientists experience concerning phenotypic traits and it dramatically improved during the last few years.
Italian Large White breed
The Italian meat industry is mainly based on the production of high quality tipical regional products and Protected Designation of Origin (PDO) products e.g Prosciutto di Parma and San Daniele. The dry-cured ham production is carried out with strict rules established by the ham Consortia. These rules go from the breeding strategies to the storage after slaughtering; the geographical origin of the animals is also controlled and regulated. In animals aimed at dry-cured ham production, most of the economic value is linked to the legs that will be processed and their fat content that will have an essential role in the aging. High quality ham does not contain additives and preservatives, and the aging is performed only by controlling the amount of added salt, humidity and temperature of the place in which they are processed (Reg. UE n. 1151/2012, Disciplinari Prosciutto di Parma DOP, Disciplinari Prosciutto San Daniele DOP).
The attentions that can lead to an optimal dry-cured ham start from the genetic selection. According to the national pig breeders association (ANAS) programs animals are selected to improve feeding efficiency, performance and carcass traits and meat quality traits. The piglets are brought to the
4 testing station at 30-45 days. During the growth and every two weeks, many parameters are measured such as Average Daily Gain (ADG) and feeding:gain ratio; after slaughtering, other characteristics are measured, including Back Fat Thickness (BFT). This is an indirect indicator of the amount of fat covering the legs. All these measurements are used for the calculation of Estimated Breeding Values (EBV) by means of multiple traits mixed models, namely BLUP animal model.
The national program of selection for Italian Large White pigs is aimed to maintain the traditional fat coverage of the carcass and improve meat quality for the transformation in tipical aged products. Furthermore, when compatible with the above goals, genetic selection points to increase fresh meat cuts and the adaptability of pigs to intensive livestock; the selection also aims to improve traits involved in reproduction.
The breeding program is based on sib-testing: it implies the calculation of EBV related on the measurement of production traits in triplets (2 females and 1 castrated male) from the same litter. They are slaughtered when they reach the weight of about 160 kg.
Due to these premises, it should be clear that the integration of genomic data with simple phenotypic aspects is fundamental for optimizing future breeding selection strategies.
Furthermore, the pig is also an interesting model for studying human traits in particular related to metabolic syndrome and obesity. Information that are developed in breeding programs could be a by-product also for this aspect.
The Pig Genome
The pig genome sequence has been assembled in 2012 thanks to the Swine Genome Sequencing Consortium (Groenen et al. 2012) and the latest version, Sscrofa10.2, is available since May 2012 at Ensembl database (Cunningham et. Al 2015). The assembly has been obtained using artificial bacterial chromosomes and whole-genome shotgun sequencing. It consists of a goldenpath of around 2.80 gigabases, arranged in 18 autosomal chromosomes, Y and X chromosomes and the
5 Mitochondrial DNA; beside the 20 total chromosomes, sequences of 4562 scaffolds still unplaced are available. The number of annotated genes is at present 25322, including those placed on scaffolds. Most of these genes have been automatically annotated as described in Ensembl pipeline (Pig annotation pipeline), while around 2000 come from the manually curated. At present, the database comprising SNPs and short indels identified in pig contains 28702985 and among them 28702828 are present in dbSNP.
SNP assay BeadChip Over 64000 SNPs can be assayed in one shot by means of high-density genomic array of Illumina Technology, the Porcine Illumina BeadChip 60k. Briefly, the technology consists of a series of beads carrying probes with DNA segments on their surface. The probes are generally 121bp long, carrying the SNP to be tested in the middle. After proper shearing and binding of DNA fragments to the beads, a replication step is carried on with fluorescently marked nucleotides. Only in presence of one form of the allele the replication event will occur and a fluorescent signal will be detected.
The choice of the 60k SNPs has been determined after several Next Generation Sequencing experiments combined with SNP discovery techniques (Ramos et al. 2009) from pools of 5 different breeds. The latest version, released in Jun 2012 contains 64232 declared SNPs.
The application of BeadChip in agriculture ranges from genomic selection to studies of diversity and to the detection of QTL regions. The fluorescent signal can be interpreted both in a qualitative way (namely the absence ore presence of the allele in exam), useful in case of Genome Wide Association Studies (GWAS) or to quantify the effective amount of genomic material with that exact sequence, as it happens for Copy Number Variation (CNV) studies.
Examples and application of genotype studies
Association studies have already identified some candidate genes associated with production traits in other pig breeds intended for ham production (Corominas et al. 2013, 2012) and analysis at
6 genome wide level, with Porcine BeadChip, successfully found markers associated with meat quality and composition (Ramajo-Caldas et al. 2012).
Concerning CNV studies, it is known that they are a big source of variability in mammals and that their presence can lead to drastic phenotype changes, as it is known for the KIT allele, whom Copy Number duplication causes the white color in pigs (Marklund et al. 1998). Several works detected CNV regions in different pig breeds (Ramayo-Caldas et al 2010, Wang et al. 2013), enlarging the landscape of pig variability.
It is interesting to observe how allele frequency changed in animals undergone to strong artificial selection processes; as in the case of Texel sheep (Boman et al. 2011), it is worth to note the side effects of breeding schemes.
7
Aim
The aim of this Thesis was to identify markers associated with production traits in the pig genome using different approaches. The peculiarity of the following experimental designs are the choice of samples, that were mainly based on Selective Genotyping approach: for some of the following described works, two sets of pigs with completely divergent EBVs for some production traits have been genotyped. The idea was to clearly separate animals depending on their phenotype, to treat them as case-control, and making the GWAS more effective than it is in a global population sample. Another subset of animals, consisting of pigs born within two decades, gives the possibility to have an eyesight on the temporal changes in the pig genome during a relatively short time frame that could produce selection signature.
In the first two chapters we have shown a GWAS study using SNPs, searching for association between genotypes and one of the main carcass characteristics, Back Fat Thickness and one of the most important production traits, Average Daily Gain. Since we were also interested in other markers affecting production traits, we applied a slightly different approach, and searched for CNV associated with BFT. The CNV identification has been described in chapter 3. To understand how selection shaped the allele frequency of some candidate genes and thousands of other SNPs, we compared their frequency in groups of pigs born in different years. For this dataset, in the fourth and fifth chapters, we have described how allele frequency changed during years. In chapter four, we have focused the attention on SNPs present in few candidate genes (IGF2, MC4R, VRTN, PRKAG3 and FTO) that have great importance in meat production; in the fifth chapter we have described allele frequency differences at genome wide level. In the last chapter we have explored how Next Generation Sequencing can be optimized to discover new polymorphisms that can be associated to Back Fat Thickness, starting from pools of animals with divergent EBV for this traits.
8 CHAPTERS
1. A genome wide association study for backfat thickness in Italian Large White pigs highlights new regions affecting fat deposition including neuronal genes
2. A genome wide association study for average daily gain in Italian Large White pigs 3. Copy number variants in Italian Large White pigs detected using high-density single
nucleotide polymorphisms and their association with back fat thickness
4. A retrospective analysis of major gene allele frequency changes during 20 years of selection in the Italian Large White pig breed
5. Genome wide allele frequency changes over twenty years of artificial directional selection in the Italian Large White pig breed
6. Reduced representation libraries from DNA pools analysed with next generation semiconductor based-sequencing to identify SNPs in extreme and divergent pigs for back fat thickness
9
CHAPTER 1
A genome wide association study for backfat thickness in Italian Large White pigs using a selective genotyping approach
Luca Fontanesi 1,2,§, Giuseppina Schiavo 1,2,*, Giuliano Galimberti 3,*, Daniela Giovanna Calò 3,*, Emilio Scotti 1, Pier Luigi Martelli 2,4, Luca Buttazzoni 5, Rita Casadio 2,4 and Vincenzo Russo 1
1
Department of Agro-Food Science and Technology, University of Bologna, Viale Fanin 46, 40127 Bologna Italy
2
Centre of Genome Biology, University of Bologna, 40126 Bologna, Italy
3
Department of Statistical Sciences “Paolo Fortunati”, University of Bologna, Via delle Belle Arti 41, 40126 Bologna, Italy
4
Biocomputing Group, Department of Experimental Evolutionary Biology, University of Bologna, Via San Giacomo, 40126 Bologna, Italy
5
CRA, Centro di Ricerca per la Produzione delle Carni e il Miglioramento Genetico, Via Salaria 31, 00015 Monterotondo Scalo, Roma, Italy
* These authors contributed equally
Published in BMCGenomics. 2012 Nov 15;13:583. doi: 10.1186/1471-2164-13-583.
Abstract Background
Carcass fatness is an important trait in most pig breeding programs. Following market requests, breeding plans for fresh pork consumption are usually designed to reduce carcass fat content and increase lean meat deposition. However, the Italian pig industry is mainly devoted to the production of Protected Designation of Origin dry cured hams: pigs are slaughtered at around 160 kg of live weight and the breeding goal aims at maintaining fat coverage, measured as backfat thickness to
10 avoid excessive desiccation of the hams. This objective has shaped the genetic pool of Italian heavy pig breeds for a few decades. In this study we applied a selective genotyping approach within a population of ~ 12,000 performance tested Italian Large White pigs. Within this population, we selectively genotyped 304 pigs with extreme and divergent backfat thickness estimated breeding value by the Illumina PorcineSNP60 BeadChip and performed a genome wide association study to identify loci associated to this trait.
Results
We identified 4 single nucleotide polymorphisms with P≤5.0E-07 and additional 119 ones with 5.0E-07<P≤5.0E-05. These markers were located throughout all chromosomes. The largest numbers were found on porcine chromosomes 6 and 9 (n=15), 4 (n=13), and 7 (n=12) while the most significant marker was located on chromosome 18. Twenty-two single nucleotide polymorphisms were in intronic regions of genes already recognized by the Pre-Ensembl Sscrofa10.2 assembly. Gene Ontology analysis indicated an enrichment of Gene Ontology terms associated with nervous system development and regulation in concordance with results of large genome wide association studies for human obesity.
Conclusions
Further investigations are needed to evaluate the effects of the identified single nucleotide polymorphisms associated with backfat thickness on other traits as a pre-requisite for practical applications in breeding programs. Reported results could improve our understanding of the biology of fat metabolism and deposition that could also be relevant for other mammalian species including humans, confirming the role of neuronal genes on obesity.
11
Background
Fat deposition is a key biological process that has important similarities between humans and pigs, potentially useful to elucidate mechanisms determining human obesity. This trait has practical and economical implications in pig breeding as it indirectly affects feeding efficiency and determines carcass value and consumers’ acceptance of pork.
Following consumer demands, breeding goals for fresh pork generally aim at reducing carcass fatness and increasing lean meat content which has adversely affected pork quality (e.g. [1]).
The Italian pig breeding industry is mainly devoted to the production of high quality Protected Designation of Origin (PDO) dry cured hams for which pigs are raised until they reach about 160 kg live weight and appropriate fat coverage of the hams is required [2,3]. Therefore, breeding objectives aim at maintaining fat coverage measured as backfat thickness (BFT). This objective has shaped the genetic pool of Italian heavy pig breeds for a few decades.
To investigate molecular genetic aspects of fat deposition in these pigs, we have recently applied a systematic candidate gene approach and have identified tens of single nucleotide polymorphisms (SNPs) associated with BFT and/or intermuscular fat content in Italian Large White and Italian Duroc pigs [4-10]. For example, a list of more than 30 SNPs has been associated with BFT in Italian Large White, including SNPs already found by other authors in IGF2[11], MC4R[12], TBC1D1[8], PPARG[13] genes or newly identified in the PCSK1[14], ACP2, CALR, JAK3, and NT5E, among several other genes [10]. Moreover, many other SNPs in additional candidate genes have been shown to explain a proportion of genetic variability of fat deposition traits in pigs [4,15,16]. In addition, a large number of QTLs for a variety of fat deposition and related traits have been already reported and listed in the Pig QTL database [17,18].
Recently, with the development of a commercial high throughput SNP genotyping tool in pig (PorcineSNP60 BeadChip [19]), a number of genome wide association (GWA) studies have been
12 carried out in this species focusing on reproduction [20,21], boar taint [22,23], disease resistance[24], structural and body composition, including BFT [25].
We have herein applied a selective genotyping approach in the Italian Large White pig breed and genotyped extreme and divergent pigs for BFT estimated breeding value (EBV) by the Illumina PorcineSNP60 BeadChip ( http://www.illumina.com webcite) tool to identify chromosome regions and markers associated with BFT.
Results and Discussion
SNP data
A total of 304 performance tested Italian Large White pigs were genotyped with the Illumina PorcineSNP60 BeadChip, interrogating 62,163 loci. One pig was excluded from further analysis due to a call rate below 90%. A call rate ≥0.90 was obtained for 58,680 SNPs (for 2,293 SNP, call rate was 0.0; 1,190 SNP had 0.0<call rate<0.90). About 15.8% (9,287 SNPs) of these potentially useful SNPs had a minor allele frequency <0.05 and were discarded. The remaining 49,393 SNPs were re-mapped on the Sscrofa10.2 genome assembly.
Genome wide association (GWA) results
Only individuals with extreme phenotypes were genotyped for association study. Several authors have shown that this approach allows to attain the same power with less genotyped individuals (e.g. [26-28]). A recent GWA study for human obesity showed that this design can obtain very similar results to previous studies on general body mass index performed on unselected cohorts of tens of thousands of subjects [29].
In our study, genotyped pigs had extreme and divergent EBV for BFT: 151 had the lowest (thinnest BFT) and 152 the highest (thickest BFT) EBV. These animals were two generation unrelated gilts taken from the performance test of the National selection program of the Italian Large White breed carried out by the National Pig Breeders Association (ANAS).
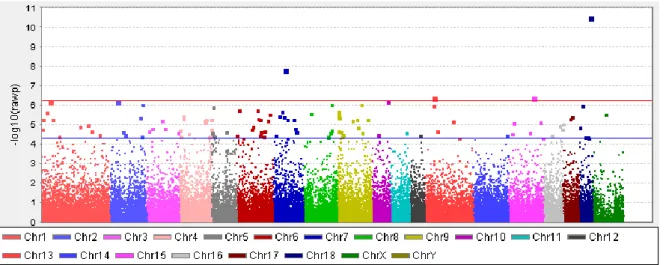
13 Figure 1 reports a Manhattan plot showing significant (P≤5.0E-07) and suggestively significant (5.0E-07<P≤5.0E-05) SNPs (Pnominal value thresholds for significant results were those indicated by the Wellcome Trust Case Control Consortium, WTCCC [30]). Using these values, 4 SNPs were significantly associated (Table 1) whereas 119 SNPs were suggestively associated with BFT (Additional file 1: Table S1).
The WTCCC criteria to reduce the number of false positive are rather conservative: the suggestive threshold for significance (P=5.0E-05) corresponds to a FDR of 0.02. Had we assumed a false discovery rate (FDR) of 0.05 (Pnominal value = 0.000412), a total of 410 SNPs would had been below this threshold and therefore considered at least “suggestively associated” (data not shown). Single nucleotide polymorphisms with P≤5.0E-05 were located in all porcine autosomal chromosomes (SCC), and on SSCX, and 5 SNPs were in unassembled scaffolds of the Sscrofa10.2 genome version. Among the mapped SNPs, the largest number was on SSC6 and SSC9 (n = 15), SSC4 (n = 13), SSC7 (n = 12) and SSC1 (n = 11) (Additional file 1: Table S1). Twenty-two SNPs were in intronic regions of recognized genes in the Pre-Ensembl Sscrofa10.2 assembly. The closest gene for the remaining mapped SNPs (n = 96) was located in a range from 481 bp to 4.69 Mb (mean = 287.6 kb ± 580 kb, median = 88 kb).
The most significant SNP (ALGA0098168; P=3.07E-11) was on SSC18 (Table 1). This SNP was localized in intron 3 of the phosphodiesterase 1C, calmodulin-dependent 70kDa (PDE1C) gene. PDEC1, highly expressed in brain and heart, is involved in the regulation of the cellular level of adenosine 3′,5′-cyclic monophosphate (cAMP) and guanosine 3′,5′-cyclic monophosphate (cGMP) that play critical roles in signal transduction [31]. The second most significant SNP (M1GA0010276; P=1.45E-08) was localized on SSC7 at about 3.6 kb from the cysteine-rich secretory protein 1 (CRISP1) gene whose known function in reproduction processes is not directly linked to any fat or energy related biological function. The third top SNP (ALGA0109557; P=3.81E-07) was mapped on SSC15 at about 460 kb from the signal transducer and activator of transcription 4 (STAT4) gene. STAT4 is a member of the STAT family of transcription factors that
14 transduces interleukin and type 1 interferon cytokine signals in T cells and monocytes, leading to important immunological functions. Reduction of STAT4 activation has been proposed to control obesity-induced inflammation [32]. The fourth most significant marker (ALGA0069549; P=3.87E-07) was located on SSC13 at about 20 kb from the stabilin 1 (STAB1) gene. Another close marker (ALGA0109216; at position 38330168 of SSC13; Additional file 1: Table S1) was suggestively significant (P=1.01E-06). The SSC13 region bracketed by these two SNPs includes the STAB1-nischarin (NISCH) gene interval that in human has been shown to be associated with waist-hip ratio (a measure of body fat distribution) [33].
Several other genes close or within the additional suggestively significant SNPs (Additional file 1: Table S1) have been already involved in obesity related biological mechanisms. Among this list it is worth mentioning: ATP-binding cassette, sub-family B (MDR/TAP), member 1 (ABCB1) gene (SSC9; ALGA0109564, P=9.01E-07) whose altered function contributes to steatosis and obesity in mice [34] and a polymorphism in this gene has been associated with obesity risk in Japanese subjects [35]; galanin receptor 3 (GALR3) gene (SSC5; M1GA0007458, P=1.25E-06) that is upregulated in adipose tissues of mice fed a high fat diet [36], and whose function is to bind galanin, a neuropeptide that regulates food intake, neurogenesis, memory, and gut secretion; olfactory receptor genes (two genes on SSC9, OR52N2 and OR56A3) have been associated with eating behaviour and adiposity in humans [37]; Parkinson protein 2 (PARK2) gene on SSC1 (ALGA0108518, P=5.48E-06) that is regulated in a lipid-dependent manner and modulates systemic fat uptake via ubiquitin ligase-dependent effects [38]; phosphodiesterase 4B, cAMP-specific (PDE4B) on SSC6 (ALGA0109354, P=5.95E-06) that has been already shown to be associated with BFT in pigs as well as with obesity in humans [39]; vacuolar protein sorting 13 homolog B (yeast) (VPS13B) on SSC4 (ALGA0024658, P=3.00E-05) that causes Cohen syndrome, characterized by truncal obesity [40]; iroquois homeobox 3 (IRX3) gene on SSC6 (M1GA0008432, P=4.66E-05), that is involved in the stress response after fat loss [41] and could be linked to obesity
15 and type 2 diabetes through its pancreatic function [42]. Interestingly the second closest gene to this latter SSC6 SNP was FTO, that is well known to affect human obesity (i.e. [43]).
Even though the annotation of the pig genome available at present in Pre-Ensembl should be considered preliminary, we further evaluated the potential functional role of regions around associated or suggestively associated SNPs with BFT in our pig population (Additional file 1: Table S1). For this evaluation we used Gene Ontology (GO) information of their corresponding closest genes. Table 2 reports GO terms enriched in this dataset. Interestingly, most of the statistically significant GO terms were related to nervous system development and regulation. This indication might support and extend the role of the nervous system in the genetic predisposition of fat accumulation in mammals, as in part reported in large GWA studies in humans [44] and, subsequently, in pigs [39]. Among the genes listed in these neuronal GO categories (Table 2), few have been already reported to be indirectly associated or involved in obesity related traits. Apart from those already described above (IRX2 and PARK2), it is interesting to mention the delta-like 1 (Drosophila) gene (DLL1) as this gene is located in a quite large region (~1 Mb) associated to type 1 diabetes on human chromosome 6 [45]. For several other genes involved in neuronal processes, at present, there is no direct reported link with obesity or fat metabolism. It would be important to further explore their role in affecting the investigated phenotype as a possible strategy to identify new pathways and mechanisms affecting fat deposition. For example, it could be possible to speculatively suggest a relationship between dysbindin (DTNBP1), involved in the modulation of glutamatergic neurotransmission in the brain, schizophrenia and obesity [46].
Comparison with other studies in pigs
We compared our GWA results with results obtained in our previous candidate gene studies for BFT in pigs [4-10] and those obtained by other GWA [25] and QTL mapping studies. In our previous studies [5,10], the IGF2 intron3-g.3072G>A mutation [11] was the most significant marker (P < 1.00E-50 by selective genotyping [10]). As the IGF2 gene is not assembled in the Sscrofa10.2 genome version, it was not possible to obtain a direct comparison with results obtained
16 for SNPs mapped on SSC2 included in the Illumina PorcineSNP60 BeadChip. However, no SNP in the region where IGF2 is likely to be found (0–10 Mb) reached the significance level of P<5.0E-05 (Additional file 1: Table S1). Only one SNP (ASGA0008884, position 9139348; P=2.12E-04) was included in the list of markers with PFDR<0.05. Several other SSC2 SNPs were suggestively significant (Additional file 1: Table S1) indicating that they might pick up other regions affecting fatness as already reported by QTL studies (e.g. [47,48]) or candidate gene studies [5,10,49,50]. The second most significant marker of our previous candidate gene investigation was the MC4Rp.Asp298Asn substitution [10]. In the current GWA study, no significant or suggestively significant SNPs were located in the SSC1 region around the MC4R gene, even if a few markers had P<1.0E-3 (data not shown). The GWA study by Fan et al. [25], conducted on gilts of a commercial breeding stock, showed that markers around MC4R were significantly associated with 10th rib and last rib backfat. These slight differences in terms of level of significance of the markers between the two studies might be due to different MC4R haplotype structures in the two pig populations (Fontanesi et al. submitted) or to different positions in the pig body where BFT measurements were taken. However, in general, few results we obtained confirmed those previously obtained by Fan et al.[25] in their GWA study on BFT. This could be due to different experimental designs, incomplete power in the two studies, and/or to differences between the investigated populations. Other results we previously obtained in candidate gene studies (i.e. [10]) could be confirmed if we relaxed the significance threshold up to FDR <0.05 (data not shown).
QTLs for fat deposition traits can be found over all pig chromosomes. Many different studies have repeatedly reported the presence of complex QTL patterns for fat related traits in SSC1, SSC2, SSC4, SSC6 and SSC7 [18]. In the present GWA study, SSC4, SSC6, SSC7, and also SSC9 resulted to be rich in significant or suggestively significant markers (SSC4: expected proportion = 0.068, observed = 0.110; SSC6: expected = 0.059, observed = 0.127; SSC7: expected = 0.063, observed = 0.102; SSC9: expected = 0.061, observed = 0.127). These results seem to indicate these chromosomes to support an important proportion of genetic variability for BFT in the Italian Large
17 White breed. In particular, two markers below the suggestive significance threshold were located both on IGSF3 or close to PKN2 on SSC4 and a few close blocks of SNPs with P<5.0E-05 (from about 65.1 - 65.4, 70.6 - 72.5, and 100.7 - 101.8 Mb) were located on SSC6 (Additional file1: Table S1). As mentioned above, FTO is close to the marker at position 28215213 on SSC6. Single marker analysis using a few FTO SNPs in our previous large association study with BFT in Italian Large White pigs did not produce significant results [10]. However, subsequent haplotype analysis at this locus tended to confirm FTO as an important locus affecting fat deposition also in this pig breed [51].
Conclusions
This study is the first genome wide association analysis for BFT in Italian heavy pigs. The targeted trait is of paramount importance for the Italian pig breeding industry that is devoted to the production of high quality dry-cured hams for which fat coverage is a key factor during the processing and curing steps [2,3]. The genetic dissection of BFT could open new perspectives to improve selection efficiency. In this study we applied a selective genotyping approach within the Italian Large White pig population to reduce the cost of genotyping without losing much power [26-31]. We took advantage of the large number of pigs that have been performance tested and genetically evaluated under the National selection program for this breed. The association analysis that compared SNP genotype frequencies between low BFT-EBV vs. high BFT-EBV groups identified 123 SNPs with P<5.0E-5 that were more densely represented in a few chromosomes known to harbor important QTLs for fat deposition traits. The quite large number of markers below this threshold (spread in different chromosome regions) might indirectly support the fact that many genes, each with a small-medium contribution, are involved in determining BFT, according to the classical definition of a quantitative trait.
Several significant or suggestively significant SNPs were close to genes whose function might be directly or indirectly related to energy metabolism and fat deposition. Many other cannot be easily linked to the targeted trait and might provide, if confirmed in following up studies, new evidence on
18 this matter. Even if the annotation available in Pre-Ensembl for Sscrofa10.2 is preliminary, GO enrichment analysis indicated that neuronal genes might affect fat deposition in pig confirming and enlarging previous indications reported in humans [44].
Summarizing, as more information is becoming available in pigs on biological aspects of fat metabolism and deposition, it is more and more clear that this species could represent an attractive biomedical model for human obesity and associated diseases. Data here reported could give an insight over genetic mechanisms of fat metabolism and deposition that could be helpful in understanding also biology aspects of human obesity.
Methods
Animals and phenotypic traits
All animals used in this study were kept according to Italian and European legislation for pig production and all procedures described were in compliance with national and European Union regulations for animal care and slaughtering.
The national selection program of the Italian Large White breed is based on triplets of siblings from the same litter (two females and one castrated male) that are individually performance tested at the Central Test Station of the National Pig Breeder Association (ANAS) for the genetic evaluation of a boar from the same litter (sib-testing). Performance evaluation starts when the pigs are 30 to 45 days of age and it ends when the animals reach 155 ± 5 kg live weight. The nutritive level is quasi ad libitum, meaning that about 60% of the pigs are able to ingest the entire supplied ration. At the end of test, animals are transported to a commercial abattoir where they are slaughtered following standard procedures [52]. Then, backfat thickness is measured on the carcasses at the level of Musculus gluteus medius.
The association study was conducted following a selective genotyping approach (e.g. [26-31]). In this study we genotyped two extreme and divergent groups of Italian Large White gilts of these
19 triplets (one female per triplet), performance tested in the period 1996–2007. Two-generation unrelated females (i.e. gilts with different and unique parents) were chosen according to their EBV for BFT (152 with most negative and 152 with most positive EBV) within a performance tested population of ~12000 pigs (details of EBV calculation are reported below). The two extreme groups were chosen ranking the animals according to their BFT EBV and then taking only the first unrelated gilts in the list (with the most positive or the most negative BFT EBV). BFT EBV used to choose the animals were recalculated for the whole performance tested population in 2007. Average BFT EBV in the negative and positive selected groups of pigs were −9.8 ± 1.6 mm and +6.6 ± 2.3 mm, respectively. Genotyped pigs were a subset of the 560 two-generation unrelated pigs used in our previous candidate gene association study [10].
Genotyping
Genomic DNA was extracted from dried-blood by standard protocols. Based on quality control, all animals were used for genotyping using the PorcineSNP60 BeadChip [19] developed by Illumina according to manufacturer’s protocol [53].
Data analyses
Estimated breeding values for BFT were calculated in the population using a BLUP-Multiple Trait-Animal Model that included the fixed effect of sex (considering the triplets of pigs from the same litter), batch on trial, inbreeding coefficient of the animal, interaction of sex by age at slaughtering, date of slaughtering and random effect of litter and animal. Three criteria were used to filter animals and SNP before association analysis: call rate >0.9 both at the 1) animal and 2) SNP level, and 3) MAF>0.05. Animals and SNPs that passed these filters were taken for association analysis treating the two groups as cases and controls. Full pedigree information available was used to obtain a kinship matrix. In order to correct for possible family-based stratification (see Additional file 2: Figure S1), the EIGENSTRAT method [54] was applied including the kinship matrix, and association tests were performed. All analyses were performed in R [55], using an option of the
20 package GenABEL [56] for computing the test-statistics according to the EIGENSTRAT method, and the package kinship [57] for building the pedigree kinship matrix.
For n animals, the first K<n principal components, c1, …, cK, of the kinship matrix among the animals were used as axes of genetic variation. Let gij and pj be the genotype at SNP i (gij = 0, 1 or 2) and the phenotype of animal j, respectively, a PC-based adjustment was performed on genotypes and phenotypes according to the following formulas:
where ckj is the score of the k-th component on animal j, βki and γk are the partial regression coefficients for predicting the i-th genotype and the phenotype, respectively, on the basis of the k-th component (with k = 1, ., K).
The association test-statistic is computed as (n − K − 1)ri2, where
is the squared correlation coefficient between the i-th PC-adjusted genotype and PC-adjusted phenotype. As noted by Price et al. [54], this statistic is a generalization of the Armitage trend statistic for discrete genotypes and phenotypes.
Wellcome Trust Case Control Consortium significance thresholds, whose definition depends on the prior odds and power, were used in this study [30]. In addition, correction for multiple testing was achieved by using a False Discovery Rate approach [58]. For each chromosome, the expected proportion of SNPs with P<5.0E-5 was computed under the assumption of uniform distribution
21 from the informative SNPs over the chromosome. This proportion was compared to the proportion of significant or suggestively significant markers actually observed on the same chromosome. Bioinformatics analyses
Mapping of the PorcineSNP60 BeadChip SNPs was obtained by using BWA [59] on the Sscrofa9.2 and Sscrofa10.2 genome assemblies as previously described [10] and confirmed using the BLAT analysis available at the Ensembl ( http://www.ensembl.org/Sus_scrofa/Info/Index webcite) and Pre-Ensembl ( http://pre.ensembl.org/Sus_scrofa/Info/Index webcite) databases (February 2012). Coordinates for the Sscrofa10 genome preliminary version (September 2010) were downloaded from the Animal Genome repository web sitehttp://www.animalgenome.org/repository/ webcite. Identification of the closest genes to SNPs with P<5.0E-05 was obtained using Pre-Ensembl annotation of Sscrofa10.2 genome version and verified using Ensembl Sscrofa9.2 genome version (February 2012). Starting from the corresponding protein sequences retrieved from these databases, the corresponding gene symbols were extracted from NCBI Gene section ( http://www.ncbi.nlm.nih.gov/ webcite) and/or Uniprot (http://www.uniprot.org/ webcite) databases (February 2012). Gene annotation was verified by BLAST analysis ( http://blast.ncbi.nlm.nih.gov/ webcite). Gene Ontology analysis was carried out using DAVID Bioinformatics Resources 6.7 ( http://david.abcc.ncifcrf.gov/ webcite[60]).
Competing interests
The authors declare that they have no competing interests.
Authors’ contributions
LF conceived and coordinated the study, analysed data and drafted the manuscript. GS, GG, DGC, and PLM performed statistical and bioinformatics analyses. ES carried out laboratory activities. LB, RC and VR coordinated and conceived the study. All authors reviewed and contributed to draft the manuscript. All authors read and approved the final manuscript.
22 We thank ANAS for providing samples and data. This work was supported by University of
Bologna RFO and FAGenomicH projects and by Italian MiPAAF INNOVAGEN funds.
References
1. Lonergan SM, Huff-Lonergan E, Rowe LJ, Kuhlers DL, Jungst SB: Selection for lean
growth efficiency in Duroc pigs influences pork quality. J Anim Sci 2001, 79:2075-2085.
2. Russo V, Nanni Costa L: Suitability of pig meat for salting and the production of quality
processed products.
Pig News Inform 1995, 16:7N-26N.
3. Bosi P, Russo V: The production of the heavy pig for high quality processed products.
Ital J Anim Sci 2004, 3:309-321.
4. Fontanesi L, Scotti E, Buttazzoni L, Davoli R, Russo V: The porcine fat mass and obesity
associated (FTO) gene is associated with fat deposition in Italian Duroc pigs. Anim Genet 2009, 40:90-93.
5. Fontanesi L, Speroni C, Buttazzoni L, Scotti E, Dall'Olio S, Nanni Costa L, Davoli R, Russo V:The insulin-like growth factor 2 (IGF2) gene intron3-g.3072G>A polymorphism is
not the only Sus scrofa chromosome 2p mutation affecting meat production and carcass traits in pigs: evidence from the effects of a cathepsin D (CTSD) gene polymorphism.
J Anim Sci 2010, 88:2235-2245.
6. Fontanesi L, Colombo M, Scotti E, Buttazzoni L, Bertolini F, Dall’Olio S, Davoli R, Russo V:The porcine tribbles homolog 3 (TRIB3) gene: identification of a missense mutation
and association analysis with meat quality and production traits in Italian heavy pigs. Meat Sci 2010, 86:806-813.
23 7. Fontanesi L, Scotti E, Speroni C, Buttazzoni L, Russo V: A selective genotyping approach
identifies single nucleotide polymorphisms in porcine chromosome 2 genes associated with production and carcass traits in Italian heavy pigs.
Ital J Anim Sci 2011, 10:e15.
8. Fontanesi L, Colombo M, Tognazzi L, Scotti E, Buttazzoni L, Dall’Olio S, Davoli R, Russo V:The porcine TBC1D1 gene: mapping, SNP identification, and association study
with meat, carcass and production traits in Italian heavy pigs. Mol Biol Rep 2011, 38:1425-1431.
9. Fontanesi L, Speroni C, Buttazzoni L, Scotti E, Dall’Olio S, Davoli R, Russo V: Association between polymorphisms in cathepsin and cystatin genes with meat
production and carcass traits in Italian Duroc pigs: confirmation of the effects of a cathepsin L (CTSL) gene marker.
Mol Biol Rep 2012, 39:109-115.
10. Fontanesi L, Galimberti G, Calò DG, Fronza R, Martelli PL, Scotti E, Colombo M, Schiavo G, Casadio R, Buttazzoni L, Russo V: Identification and association analysis of
several hundred single nucleotide polymorphisms within candidate genes for back fat thickness in Italian Large White pigs using a selective genotyping approach.
J Anim Sci 2012, 90:2450-2464. Van Laere A-S, Nguyen M, Braunschweig M, Nezer C,
Collette C, Moreau L, Archibald AL, Haley CS, Buys N, Tally M, Andersson G, Georges M, Andersson L: A regulatory mutation in IGF2 causes a major QTL effect on muscle
growth in the pig.
Nature 2003, 425:832-836.
11. Kim KS, Larsen N, Short T, Plastow G, Rothschild MF: A missense variant of the
porcine melanocortin-4 receptor (MC4R) gene is associated with fatness, growth, and feed intake traits.
24 12. Fan B, Onteru SK, Mote BE, Serenius T, Stalder KJ, Rothschild MF: Large-scale
association study for structural soundness and leg locomotion traits in the pig. Genet Sel Evol 2009, 41:14.
13. Fontanesi L, Bertolini F, Scotti E, Trevisi P, Buttazzoni L, Dall’Olio S, Davoli R, Bosi P, Russo V: Polymorphisms in an obesity related gene (PCSK1) are associated with fat
deposition and production traits in Italian heavy pigs. Animal 2012, 6:1913-1924.
14. Fan B, Du ZQ, Rothschild MF: The fat mass and obesity-associated (FTO) gene is
associated with intramuscular fat content and growth rate in the pig. Anim Biotechnol 2009, 20:58-70.
15. Switonski M, Stachowiak M, Cieslak J, Bartz M, Grzes M: Genetics of fat tissue
accumulation in pigs: a comparative approach. J Appl Genet 2010, 51:153-168.
16. Rothschild MF, Hu Z-L, Jiang Z: Advances in QTL mapping in pigs.
Int J Biol Sci 2007, 3:192-197.
17. Hu Z-L, Reecy JM: Animal QTLdb: Beyond a repository – A public platform for QTL
comparisons and integration with diverse types of structural genomic information. Mamm Genome 2007, 18:1-4.
18. Ramos AM, Crooijmans RP, Affara NA, Amaral AJ, Archibald AL, Beever JE, Bendixen C, Churcher C, Clark R, Dehais P, Hansen MS, Hedegaard J, Hu ZL, Kerstens HH, Law AS, Megens HJ, Milan D, Nonneman DJ, Rohrer GA, Rothschild MF, Smith TP, Schnabel RD, Van Tassell CP, Taylor JF, Wiedmann RT, Schook LB, Groenen MA: Design of a
high density SNP genotyping assay in the pig using SNPs identified and characterized by next generation sequencing technology.
25 19. Uimari P, Sironen A, Sevon-Aimonen ML: Whole-genome SNP association analysis of
reproduction traits in the Finnish Landrace pig breed. Genet Sel Evol 2011, 43:42.
20. Onteru SK, Fan B, Du ZQ, Garrick DJ, Stalder KJ, Rothschild MF: A whole-genome
association study for pig reproductive traits. Anim Genet 2012, 43:18-26.
21. Grindflek E, Lien S, Hamland H, Hansen MH, Kent M, van Son M, Meuwissen TH: Large
scale genome-wide association and LDLA mapping study identifies QTLs for boar taint and related sex steroids.
BMC Genomics 2011, 12:362.
22. Gregersen VR, Conley LN, Sorensen KK, Guldbrandtsen B, Velander IH, Bendixen C:Genome-wide association scan and phased haplotype construction for quantitative
trait loci affecting boar taint in three pig breeds. BMC Genomics 2012, 13:22.
23. Boddicker N, Waide EH, Rowland RR, Lunney JK, Garrick DJ, Reecy JM, Dekkers JC:Evidence for a major QTL associated with host response to Porcine Reproductive
and Respiratory Syndrome virus challenge. J Anim Sci 2012.
24. Fan B, Onteru SK, Du ZQ, Garrick DJ, Stalder KJ, Rothschild MF: Genome-wide
association study identifies Loci for body composition and structural soundness traits in pigs.
PLoS One 2011, 6:e14726.
25. Darvasi A, Soller M: Selective genotyping for determination of linkage between a
marker locus and a quantitative trait locus. Theor Appl Genet 1992, 85:353-359.
26 26. Van Gestel S, Houwing-Duistermaat JJ, Adolfsson R, van Duijn CM, Van Broeckhoven
C:Power of selective genotyping in genetic association analyses of quantitative traits.
Behav Genet 2000, 30:141-146.
27. Zhang G, Nebert DW, Chakraborty R, Jin L: Statistical power of association using the
extreme discordant phenotype design.
Pharmacogenet Genomics 2006, 16:401-413.
28. Paternoster L, Evans DM, Nohr EA, Holst C, Gaborieau V, Brennan P, Gjesing AP, Grarup N, Witte DR, Jørgensen T, Linneberg A, Lauritzen T, Sandbaek A, Hansen T, Pedersen O, Elliott KS, Kemp JP, St Pourcain B, McMahon G, Zelenika D, Hager J, Lathrop M, Timpson NJ, Smith GD, Sørensen TI: Genome-wide population-based
association study of extremely overweight young adults - the GOYA study. PLoS One 2011, 6:e24303.
29. Wellcome Trust Case Control Consortium: Genome-wide association study of 14,000
cases of seven common diseases and 3,000 shared controls. Nature 2007, 447:661-683.
30. Lakics V, Karran EH, Boess FG: Quantitative comparison of phosphodiesterase mRNA
distribution in human brain and peripheral tissues. Neuropharmacology 2010, 59:367-374.
31. Chakrabarti SK, Wen Y, Dobrian AD, Cole BK, Ma Q, Pei H, Williams MD, Bevard MH, Vandenhoff GE, Keller SR, Gu J, Nadler JL: Evidence for activation of inflammatory
lipoxygenase pathways in visceral adipose tissue of obese Zucker rats. Am J Physiol Endocrinol Metab 2011, 300:E175-E187.
32. Heid IM, Jackson AU, Randall JC, Winkler TW, Qi L, Steinthorsdottir V, Thorleifsson G, Zillikens MC, Speliotes EK, Mägi R, Workalemahu T, White CC, Bouatia-Naji N, Harris TB, Berndt SI, Ingelsson E, Willer CJ, Weedon MN, Luan J, Vedantam S, Esko T, Kilpeläinen TO, Kutalik Z, Li S, Monda KL, Dixon AL, Holmes CC, Kaplan LM, Liang L,
27 Min JL, et al.: Meta-analysis identifies 13 new loci associated with waist-hip ratio and
reveals sexual dimorphism in the genetic basis of fat distribution. Nat Genet 2010, 42:949-960.
33. Foucaud-Vignault M, Soayfane Z, Ménez C, Bertrand-Michel J, Martin PG, Guillou H, Collet X, Lespine A: P-glycoprotein dysfunction contributes to hepatic steatosis and
obesity in mice.
PLoS One 2011, 6:e23614.
34. Ichihara S, Yamada Y, Kato K, Hibino T, Yokoi K, Matsuo H, Kojima T, Watanabe S, Metoki N, Yoshida H, Satoh K, Aoyagi Y, Yasunaga A, Park H, Tanaka M, Nozawa Y: Association of a polymorphism of ABCB1 with obesity in Japanese individuals.
Genomics 2008, 91:512-516.
35. Kim A, Park T: Diet-induced obesity regulates the galanin-mediated signalling cascade
in the adipose tissue of mice.
Mol Nutr Food Res 2010, 54:1361-1370.
36. Choquette AC, Bouchard L, Drapeau V, Lemieux S, Tremblay A, Bouchard C, Vohl MC, Pérusse L: Association between olfactory receptor genes, eating behaviour traits and
adiposity: results from the Quebec Family Study. Physiol Behav 2012, 105:772-776.
37. Kim KY, Stevens MV, Akter MH, Rusk SE, Huang RJ, Cohen A, Noguchi A, Springer D, Bocharov AV, Eggerman TL, Suen DF, Youle RJ, Amar M, Remaley AT, Sack MN: Parkin is a lipid-responsive regulator of fat uptake in mice and mutant human
cells.
J Clin Invest 2011, 121:3701-3712.
38. Lee KT, Byun MJ, Kang KS, Park EW, Lee SH, Cho S, Kim H, Kim KW, Lee T, Park JE, Park W, Shin D, Park HS, Jeon JT, Choi BH, Jang GW, Choi SH, Kim DW, Lim D, Park HS, Park MR, Ott J, Schook LB, Kim TH, Kim H: Neuronal genes for subcutaneous fat
28
thickness in human and pig are identified by local genomic sequencing and combined SNP association study.
PLoS One 2011, 6:e16356.
39. Balikova I, Lehesjoki AE, de Ravel TJ, Thienpont B, Chandler KE, Clayton-Smith J, Träskelin AL, Fryns JP, Vermeesch JR: Deletions in the VPS13B (COH1) gene as a
cause of Cohen syndrome.
Hum Mutat 2009, 30:E845-E854.
40. Dankel SN, Fadnes DJ, Stavrum AK, Stansberg C, Holdhus R, Hoang T, Veum VL, Christensen BJ, Våge V, Sagen JV, Steen VM, Mellgren G: Switch from stress response
to homeobox transcription factors in adipose tissue after profound fat loss. PLoS One 2010, 5:e11033.
41. Ragvin A, Moro E, Fredman D, Navratilova P, Drivenes O, Engström PG, Alonso ME, de la Calle Mustienes E, Gómez Skarmeta JL, Tavares MJ, Casares F, Manzanares M, van Heyningen V, Molven A, Njølstad PR, Argenton F, Lenhard B, Becker TS: Long-range
gene regulation links genomic type 2 diabetes and obesity risk regions to HHEX, SOX4, and IRX3.
Proc Natl Acad Sci USA 2010, 107:775-780.
42. Dina C, Meyre D, Gallina S, Durand E, Körner A, Jacobson P, Carlsson LM, Kiess W, Vatin V, Lecoeur C, Delplanque J, Vaillant E, Pattou F, Ruiz J, Weill J, Levy-Marchal C, Horber F, Potoczna N, Hercberg S, Le Stunff C, Bougnères P, Kovacs P, Marre M, Balkau B, Cauchi S, Chèvre JC, Froguel P: Variation in FTO contributes to childhood obesity
and severe adult obesity. Nat Genet 2007, 39:724-726.
43. Willer CJ, Speliotes EK, Loos RJ, Li S, Lindgren CM, Heid IM, Berndt SI, Elliott AL, Jackson AU, Lamina C, Lettre G, Lim N, Lyon HN, McCarroll SA, Papadakis K, Qi L, Randall JC, Roccasecca RM, Sanna S, Scheet P, Weedon MN, Wheeler E, Zhao JH, Jacobs
29 LC, Prokopenko I, Soranzo N, Tanaka T, Timpson NJ, Almgren P, Bennett A, Genetic Investigation of ANthropometric Traits Consortium, et al.: Six new loci associated with
body mass index highlight a neuronal influence on body weight regulation. Nat Genet 2009, 41:25-34.
44. Bradfield JP, Qu HQ, Wang K, Zhang H, Sleiman PM, Kim CE, Mentch FD, Qiu H, Glessner JT, Thomas KA, Frackelton EC, Chiavacci RM, Imielinski M, Monos DS, Pandey R, Bakay M, Grant SF, Polychronakos C, Hakonarson H: A genome-wide
meta-analysis of six type 1 diabetes cohorts identifies multiple associated loci. PLoS Genet 2011, 7:e1002293.
45. Numakawa T, Yagasaki Y, Ishimoto T, Okada T, Suzuki T, Iwata N: Evidence of novel
neuronal functions of dysbindin, a susceptibility gene for schizophrenia. Hum Mol Genet 2004, 13:2699-26708.
46. Lee SS, Chen Y, Moran C, Cepica S, Reiner G, Bartenschlager H, Moser G, Geldermann H:Linkage and QTL mapping for Sus scrofa chromosome 2.
J Anim Breed Genet 2003, 120(Suppl. 1):11-19.
47. Tortereau F, Gilbert H, Heuven HC, Bidanel JP, Groenen MA, Riquet J: Number and
mode of inheritance of QTL influencing backfat thickness on SSC2p in Sino-European pig pedigrees.
Genet Sel Evol 2011, 43:11.
48. Cepica S, Ovilo C, Masopust M, Knoll A, Fernandez A, Lopez A, Rohrer GA, Nonneman D:Four genes located on a SSC2 meat quality QTL region are associated with
different meat quality traits in Landrace × Chinese-European crossbred population. Anim Genet 2012, 43:333-336.
49. Fontanesi L, Buttazzoni L, Scotti E, Russo V: Confirmation of the association between a
single nucleotide polymorphism in the porcine LDHA gene and average daily gain and correlated traits in Italian Large White pigs.
30
Anim Genet 2012, 43:649-650.
50. Fontanesi L, Russo V: Nucleotide variability and haplotype heterogeneity at the
porcine fat mass and obesity associated (FTO) gene. Anim Genet
51. Fontanesi L, Davoli R, Nanni Costa L, Beretti F, Scotti E, Tazzoli M, Tassone F, Colombo M, Buttazzoni L, Russo V: Investigation of candidate genes for glycolytic potential of
porcine skeletal muscle: association with meat quality and production traits in Italian Large White pigs.
Meat Sci 2008, 80:780-787.
52. Steemers FJ, Gunderson KL: Whole genome genotyping technologies on the BeadArray
platform.
Biotechnol J 2007, 2:41-49.
53. Price AL, Patterson NJ, Plenge RM, Weinblatt ME, Shadick NA, Reich D: Principal
components analysis corrects for stratification in genome-wide association studies. Nat Genet 2006, 38:904-909.
54. R Development Core Team: R:
A language and environment for statistical computing.
http://www.R-project.org/
55. Aulchenko YS, Ripke S, Isaacs A, van Duijn CM: GenABEL: an R library for
genome-wide association analysis.
Bioinformatics 2007, 23:1294-1296.
56. Atkinson B, Therneau T:
kinship: mixed-effects Cox models, sparse matrices, and modeling data from large pedigrees.
31 57. Benjamini Y, Hochberg Y: Controlling the false discovery rate: a practical and
powerful approach to multiple testing. J Royal Stat Soc Series B 1995, 57:289-300.
58. Li H, Durbin R: Fast and accurate short read alignment with Burrows-Wheeler
transform.
Bioinformatics 2009, 25:1754-1760.
59. Huang DW, Sherman BT, Lempicki RA: Bioinformatics enrichment tools: paths toward
the comprehensive functional analysis of large gene lists. Nucleic Acids Res 2009, 37:1-13.
Figure 1. Manhattan plot of genome wide association results for backfat thickness in Italian Large White pigs.
Red line: threshold for significant (P<5.0E-07). Blue line: threshold for suggestively significant results (5.0E-07<P<5.0E-05).
32 Table 1 - Significant SNPs (P<5.0E-07), their chromosome positions and their closest genes in Sscrofa10.2 (Pre-Ensembl)
SNP CHR:position1 (Sscrofa10.2) CHR:position1 (Sscrofa10) CHR:position1 (Sscrofa9.2) P1 FDR1 SNP position/distance1 Closest gene coordinates
Closest gene protein in Pre-Ensembl Gene Symbol ALGA0098168 18:45408799 18:44540120 18:25516667 3.07E-11 1.51E-06 Intron 3 18:45404849-45567252 ENSSSCP00000017656 PDE1C
M1GA0010276 7:50272760 7:50024255 7:50440974 1.45E-8 3.58E-04 3657 7:50276417-50297466
ENSSSCP00000001892 CRISP1
ALGA0109557 15:107079255 15:102388547 - 3.81E-7 4.17E-3 4609542 15:102429318-102469713
ENSP00000351255 STAT4
ALGA0069549 13:37851945 13:37353675 13:23719928 3.87E-7 4.17E-3 20143 13:37872088-37876725
ENSSSCP00000012196 STAB1
1
Chromosome and nucleotide position in the different genome versions
2
P-raw value
3
False Discovery Rate
4
33 Table 2 - Results of the Gene Ontology (GO) analysis including closest genes to SNP with P<5.0E-05
Go sub-ontology GO term accession GO term description Number of involved genes
Involved genes DAVID P-value
Biological Process GO:0050767 regulation of neurogenesis 5 ACTR3, LINGO1, IRX3, XRCC2, DLL1 0.015 Biological Process GO:0006928 cell motion 8 ACTR3, CXCR4, SPOCK1, SCNN1G, IL12B, APBB2,
ELMO1, CTNNA2
0.018 Biological Process GO:0051960 regulation of nervous system
development
5 ACTR3, LINGO1, IRX3, XRCC2, DLL1 0.024
Biological Process GO:0060284 regulation of cell development
5 ACTR3, LINGO1, IRX3, XRCC2, DLL1 0.029
Biological Process GO:0030182 neuron differentiation 7 LINGO1, CXCR4, MTPN, APBB2, OLFM3, NTM, CTNNA2
0.038 Biological Process GO:0045664 regulation of neuron
differentiation
4 ACTR3, LINGO1, IRX3, DLL1 0.040
Biological Process GO:0048666 neuron development 6 LINGO1, CXCR4, APBB2, OLFM3, NTM, CTNNA2 0.044 Molecular Function GO:0031420 alkali metal ion binding 5 KCNK9, KCNT2, ATP1B3, SLC22A4, SCNN1G 0.031 Molecular Function GO:0000166 nucleotide binding 19 RBM24, XRCC2, SUCLG2, PKN2, ABCB1, ACTR3,
MAP3K5, KCNT2, HIPK1, ASCC3, PDE1C, CELF4, SLC22A4, CELF2, DPYD, RAB38, DOCK10, ARL4C, MOCS1
0.038
Cellular Component GO:0043005 neuron projection 7 NUMA1, CXCR4, MTPN, PARK2, APBB2, DTNBP1, CTNNA2
0.009 Cellular Component GO:0031252 cell leading edge 4 ACTR3, CXCR4, APBB2, CTNNA2 0.037
Additional files
Figure S1:
Two-dimensional graphical representation of relatedness among animals based on a multidimensional scaling representation of pedigree-based kinship matrix. Different symbols are used to denote pigs with positive or negative backfat thickness estimated breeding values.
Tables S1: Suggestively significant SNPs (5.0E-07< P≤5.0E-05), their chromosome positions and their closest genes in Sscrofa10.2 (Pre-Ensembl). Notes are the same as those reported for Table1
CHR:POSITION (Sscrofa10)
CHR:POSITION
(Sscrofa9.2) P FDR SNP position/distance Closest gene coordinates
Closest gene protein in
Pre-ensembl Gene Symbol
2:33084396 2:16685404 5.78E-7 0.004166020 24212 2:32547222-32721004 ENSSSCP00000014159 MPPED2 1:29091230 1:22692347 6.28E-7 0.004166020 44184 1:30747588-30883017 ENSSSCP00000004497 MAP3K5 0:0 0:0 6.69E-7 0.004166020 1636608 10:66363855-66585202 ENSSSCP00000011861 CELF2 0:0 0:0 9.01E-7 0.004166020 176391 8:122086037-122189190 ENSSSCP00000009755 LEF1 2:144447032 0:0 9.01E-7 0.004166020 168569 2:144721630-145255083 ENSP00000378401 SPOCK1 0:0 0:0 9.01E-7 0.004166020 Intron 24 9:102530763-102740603 ENSSSCP00000016317 ABCB1 18:14473279 0:0 9.70E-7 0.004166020 23921 18:14099822-14138480 ENSSSCP00000017509 MTPN 13:37839628 0:0 1.01E-6 0.004166020 42000 13:38213820-38288168 ENSP00000378235 SFMBT1 5:7170363 5:4993938 1.25E-6 0.004733860 Intron 2 5:7209683-7425562 ENSSSCP00000000125 GALR3 6:88826611 6:84170972 1.64E-6 0.005430940 70103 6:89419071-89434147 ENSP00000361834 COL9A2 6:6655662 6:787265 1.65E-6 0.005430940 Intron 7 6:7185321-7278279 ENSSSCP00000002903 CMIP 7:40806202 7:39630963 2.01E-6 0.005579550 Intron 1 7:40420291-40443740 ENSP00000362282 MOCS1
0:0 0:0 2.05E-6 0.005579550
0:0 0:0 2.05E-6 0.005579550
9:3876584 9:1636263 2.20E-6 0.005579550 2716 9:4381985-4382947 ENSSSCP00000015580 OR52N2 1:19076324 0:0 2.26E-6 0.005579550 396553 1:20543890-20705746 ENSP00000321826 STXBP5 8:34071238 0:0 2.59E-6 0.006084880 26261 8:33236813-33423156 ENSP00000427211 APBB2 6:140135176 6:38749591 3.01E-6 0.006241370 115725 6:140421919-140654461 ENSSSCP00000004142 FGGY X:5842394 X:1957529 3.05E-6 0.006241370 319535 X:57674949-57680848 ENSSSCP00000013164 ZC4H2 9:4132852 9:1885017 3.33E-6 0.006241370 3530 9:4689819-4695785 ENSSSCP00000015601 TRIM6 7:27941247 7:27559898 3.55E-6 0.006241370 Intron 13 7:27771735-27791629 ENSSSCP00000001520
4:1622309 0:0 3.70E-6 0.006241370 3814 4:16999359-17046727 ENSP00000287380 WDR67
0:0 0:0 3.70E-6 0.006241370
17:38522336 17:30701716 4.06E-6 0.006241370 26280 17:38009364-38021616 ENSSSCP00000007647
7:48384424 7:48680546 4.09E-6 0.006241370 70532 7:48466353-48497373 ENSSSCP00000001883 GPR110 9:6883156 9:3538170 4.31E-6 0.006241370 Intron 3 9:7354382-7382403 ENSSSCP00000015721 NUMA1 2:133309779 0:0 4.34E-6 0.006241370 635700 2:134893490-134898449 ENSSSCP00000015151 xxx 9:3801354 9:1561033 4.42E-6 0.006241370 9318 9:4300172-4301116 ENSSSCP00000015573 OR56A3
4:17175674 4:15308823 4.90E-6 0.006241370 473939 4:17236913-17252340 ENSP00000259512 DERL1 6:92512862 6:19249624 4.93E-6 0.006241370 463598 6:92352797-92436806 ENSSSCP00000003990 CCDC165 17:33362084 17:26260352 5.01E-6 0.006241370 87698 17:31797648-31806811 ENSSSCP00000007564 NAA20 1:45272366 0:0 5.26E-6 0.006241370 105862 1:47894988-48057459 ENSSSCP00000004583 MAN1A1 9:129569427 0:0 5.26E-6 0.006241370 377318 9:130733849-130819218 ENSSSCP00000016450 FAM5B 7:62574826 7:62259181 5.29E-6 0.006241370 21854 7:62377787-62379628 ENSSSCP00000002047 LINGO1 7:86475401 7:89262644 5.29E-6 0.006241370 115821 7:87588830-87598695 ENSSSCP00000002446 ARRDC4 1:5966847 0:0 5.48E-6 0.006241370 210444 1:7197052-8260240 ENSP00000355865 PARK2 4:135547432 4:124901359 5.57E-6 0.006241370 494069 4:139808249-139885772 ENSSSCP00000007385 PKN2 4:112488203 4:104404674 5.65E-6 0.006241370 8020 4:116713231-116742444 ENSSSCP00000007210 HIPK1 6:100615252 6:21686112 5.66E-6 0.006241370 Intron 3 6:100634610-100726475 ENSSSCP00000004012 CABLES1 9:85510638 0:0 5.69E-6 0.006241370 7196 9:85222169-85427470 ENSSSCP00000016269 COL28A1 3:66806262 0:0 5.72E-6 0.006241370 205347 3:67119262-67171441 ENSSSCP00000008813 CTNNA2 0:0 9:32928624 5.86E-6 0.006241370 70099 9:65008422-65418861 ENSSSCP00000016176 NTM 6:133887826 0:0 5.95E-6 0.006241370 185116 6:134871060-134913076 B3TNN4 PDE4B 4:103716327 4:96456312 6.07E-6 0.006241370 2911 4:107721372-107756757 ENSSSCP00000007091 GOLPH3L 13:122657370 13:71567378 6.98E-6 0.007033850 830315 13:124263010-124301092 ENSSSCP00000012530 TBL1XR1 4:110056273 4:101855616 7.14E-6 0.007054590 Intron 8 4:114119961-114213903 ENSSSCP00000007185 IGSF3 0:0 15:88200074 7.71E-6 0.007311480 Intron 7 15:139951470-140112107 ENSSSCP00000017201 DOCK10 4:110037486 4:101836829 7.74E-6 0.007311480 Intron 6 4:114119961-114213903 ENSSSCP00000007185 IGSF3 0:0 9:12097010 7.88E-6 0.007311480 5925 9:26044315-26060761 NP_001106917.1 CHORDC1 15:22820592 15:18937717 7.99E-6 0.007311480 401999 15:22725584-22786931 ENSP00000263238 ACTR3 16:84950193 16:50607024 9.09E-6 0.008165940 Intron 2 16:85607485-85996578 ENSSSCP00000018130 MRPL36 0:0 1:160101834 1.02E-5 0.009027780 51990 1:202935182-203018563 ENSSSCP00000005421 DDHD 16:68967125 16:40846554 1.16E-5 0.010080550 70256 16:69953974-69964216 ENSSSCP00000018057 IL12B 1:159037158 1:132208765 1.24E-5 0.010506940 388433 1:168992153-168993757 ENSSSCP00000005249 SOCS6 0:0 6:13199918 1.26E-5 0.010506940 92575 6:70488620-70538497 ENSP00000355060 ARHGEF10L 0:0 18:3519750 1.33E-5 0.010940450 159381 18:4937374-5046258 ENSSSCP00000017407 XRCC2 0:0 0:0 1.43E-5 0.011562550 654529 9:88556137-88562911 NP_001090937.1 NDUFA4 7:94085855 7:96295118 1.52E-5 0.012083440 31324 7:95175083-95190851 ENSSSCP00000002470 PLEKHG3 3:77487801 3:29947330 1.59E-5 0.012372110 345967 3:77679432-77683803 ENSSSCP00000008917 C1D 3:22987343 0:0 1.60E-5 0.012372110 3735 3:23445919-23476070 ENSSSCP00000008365 SCNN1G 6:63308009 6:12205604 1.67E-5 0.012457580 51348 6:65324504-65333801 ENSSSCP00000003702 LOC100523441 0:0 16:49935458 1.67E-5 0.012457580 308915 16:84598910-84600254 ENSSSCP00000018128
1:507934 1:79763 1.74E-5 0.012457580 276135 1:281894-289492 ENSP00000355718 DLL1 0:0 1:187582635 1.74E-5 0.012457580 178986 1:238795293-238950756 ENSSSCP00000005584 PTPRD
6:62987043 6:12099404 1.74E-5 0.012457580 10559 6:65091662-65093997 ENSSSCP00000003694
4:135647790 4:124999317 1.78E-5 0.012543920 592028 4:139808249-139885772 ENSSSCP00000007385 PKN2 4:2166585 4:1093405 1.84E-5 0.012784300 Intron 1 4:2362701-2385405 ENSSSCP00000006345 EIF2C2 8:120086170 8:55541534 1.95E-5 0.013407070 131407 8:121603244-121621973 ENSSSCP00000009750 AGXT2L1 1:205181858 1:171970180 2.05E-5 0.013661490 Intron 5 1:218678153-218721352 ENSSSCP00000005511 C9orf82 3:8609388 3:1421124 2.05E-5 0.013661490 49889 3:8461662-8832324 ENSP00000318234 EMID2 0:0 0:0 2.08E-5 0.013675650 17410 13:53693142-54030490 ENSP00000419325 SUCLG2 9:3443230 9:1405722 2.12E-5 0.013805320 32123 9:4067145-4077257 ENSSSCP00000015562 FAM160A2 6:118161553 6:28731790 2.16E-5 0.013849160 5811 6:119141320-119158448 ENSSSCP00000004062 CYP4A22 6:101630451 6:22306965 2.28E-5 0.014329510 Intron 13 6:101665088-101967594 ENSSSCP00000004019 OSBPL1A 2:71529148 2:33619289 2.34E-5 0.014329510 53137 2:60989514-61018267 ENSSSCP00000014730 AP1M1 5:62745013 0:0 2.36E-5 0.014329510 44102 5:64512420-64630474 ENSP00000394008
9:16279686 9:8293530 2.39E-5 0.014329510 674924 9:16491108-16491935 ENSSSCP00000012445 ATP1B3 7:101399631 7:103012134 2.41E-5 0.014329510 7309 7:101881462-102041577 ENSSSCP00000002531 DPF3 7:103079877 7:105149510 2.41E-5 0.014329510 29403 7:103608527-103800694 ENSSSCP00000002568 FCF1 3:134753808 3:62456911 2.51E-5 0.014773180 745117 3:135803385-135804164 ENSSSCP00000009215 ID2 0:0 11:50323734 2.57E-5 0.014773180 1488702 11:69611870-69632132 ENSSSCP00000010134 GPG6 9:10682988 9:5175148 2.57E-5 0.014773180 Intron 1 9:106872890-107132218 ENSP00000303212 SEMA3E 8:112863525 0:0 2.66E-5 0.014935630 484540 8:115058036-115074694 ENSSSCP00000009727 C4ORF21 5:2614484 5:1709451 2.69E-5 0.014935630 53502 5:2668477-2802118 ENSSSCP00000000029
15:87858348 15:96862419 2.69E-5 0.014935630 37532 15:91529100-91635557 ENSP00000249442 MTX2 15:16434289 15:9274593 2.87E-5 0.015766960 1016630 15:18125415-18128466 ENSSSCP00000016630 CXCR4 4:38407453 4:35314280 3.00E-5 0.016275000 Intron 11 4:40007864-40389295 ENSP00000351346 VPS13B 10:24904892 10:40777707 3.13E-5 0.016599120 Intron 20 10:23898728-24100299 ENSP00000294725 KCNT2 5:2363355 5:1569232 3.15E-5 0.016599120 Intron 6 5:2584675-2648147 ENSSSCP00000000028
2:65875152 2:31528235 3.16E-5 0.016599120 481 2:66652122-66665807 ENSP00000407182 TNPO2 9:24085776 9:11844447 3.27E-5 0.017010480 361423 9:23798576-23862377 ENSP00000243662 RAB38 0:0 0:0 3.33E-5 0.017130220 60643 1:251421046-251461799 ENSP00000366243 TMEM2 7:13276847 7:13211824 3.45E-5 0.017401510 92990 7:13741795-13752147 ENSP00000368341 RBM24 6:101115892 6:21946783 3.45E-5 0.017401510 102479 6:101061150-101103291 ENSP00000323387 ANKRD29 7:11267787 7:10833754 3.50E-5 0.017469850 755607 7:12191634-12309233 ENSP00000341680 DTNBP1 12:44714600 12:21841563 3.55E-5 0.017521270 3278 12:44259718-44287870 ENSSSCP00000018786 PSMD11 5:7711829 5:5536068 3.61E-5 0.017526790 18843 5:8010270-8012726 ENSP00000300147 ELFN2 16:37690744 16:20163875 3.64E-5 0.017526790 22141 16:37561961-37610054 ENSSSCP00000017924 IL31RA 14:147276707 14:142677189 3.66E-5 0.017526790 92379 14:147439203-147531465 ENSSSCP00000011457 C10orf90-like 6:28750 0:0 3.70E-5 0.017526790 168932 6:182073-196415 ENSSSCP00000002843 LOC100522374