1
10000-Fold Improvement In Protein Detection Using Nanostructured Porous Silicon Interferometric Aptasensors
Stefano Mariani1, Laura Pino2, Lucanos M. Strambini1, Lorena Tedeschi1, and Giuseppe Barillaro*1,2
1Dipartimento di Ingegneria dell’Informazione, Università di Pisa, via G. Caruso 16, 56122 Pisa, Italy
2Istituto di Fisiologia Clinica, Consiglio Nazionale delle Ricerche, via G. Moruzzi 1, 56124 Pisa, Italy
Abstract
On-field analysis (e.g. clinical and diagnostics) of nanostructured porous silicon (PSi) for label-free optical biosensing has been so far hindered by insufficient sensitivity of PSi biosensors.
Here we report on a label-free PSi interferometric aptasensor able to specifically detect Tumor Necrosis Factor alpha (TNFα, a protein biomarker of inflammation and sepsis) at
concentration down to 3.0 nM with signal-to-noise (S/N) ratio of 10.6 and detection limit (DL) of 200 pM. This represents a 10000-fold improvement with respect to direct label-free PSi biosensors and pushes PSi biosensors close to the most sensitive optical and label free transduction techniques, e.g. surface plasmon resonance (SPR) for which a lowest DL of 100 pM in aptasensing has been reported.
A factor 1000 in improvement is achieved by introducing a novel signal processing technique for the optical readout of PSi interferometers, namely Interferogram Average over
2
significantly improve both sensitivity and reliability of PSi biosensors with respect to commonly used Fast Fourier Transform (FFT) reflectance spectroscopy.
A further factor 10 is achieved by enabling preparation of PSi interferometer with enlarged pore sizes (up to a 3x increase in diameter) at constant current density (i.e. constant porosity and, in turn, constant refractive index). This method is in contrast to standard PSi preparation where pore size is increased by increasing etching current density (i.e. porosity), and allows tackling mass-limited diffusion of biomolecules into the nanopores without worsening PSi interferometer optical features.
Keywords: nanostructured porous silicon, aptamer, label-free biosensors, nanomolar detection, protein, interferometry
Porous silicon (PSi) is a nanostructured material extensively exploited in optical label-free biosensing (e.g. protein and DNA detection)1-4 and nanomedicine5,6 (e.g. drug delivery) applications. A number of features yield PSi unique for application in biosensing and nanomedicine, among which there are i) a good and tunable biocompatibility (e.g. deterioration over time in physiological condition can properly modulated to tune drug release),5 coupled with ii) a large and reactive specific surface (e.g. surface-to-volume ratio can be increased up to thousand m2/cm3 to host a massive number of bioreceptors),2 and iii) a flexible and cheap preparation process (e.g. PSi optical properties can be reliably and
effectively engineeredto create optical devices, such as bragg stacks, resonant cavities, and waveguides, in any lab through galvanostatic anodization in acidic aqueous electrolytes).7 The first report on label-free PSi optical biosensing was given by Sailor and coworkers (1997), which demonstrated the achievement of very low detection limits (DLs) (i.e. picomolar
3
antibodies) detection using a PSi interferometer.8 In spite of these exciting premises none has achieved comparable DLs using direct label-free PSi biosensors over the following 20-years, not even engineering both morphology and surface chemistry of PSi to prepare sophisticated optical structures (e.g. rugate filters, waveguides)2 combined with a wide range of chemical and biological modifications.3 Accordingly, Segal and coworkers recently (2015) emphasized the insufficient sensitivity of label-free PSi biosensors,9 still unable to target analytes (either DNA10 or proteins11) at concentration below the micromolar level in direct label-free manner, in spite of theoretical calculations predicting DL in the nanomolar level (e.g. for DNA).12 Such a poor experimental sensitivity yields label-free PSi optical biosensing unable to address applications in either clinical diagnosis or environmental monitoring fields, where high sensitivity is required to enable detection of analytes at sub-micromolar concentration.13 Mass-limited diffusion of analytes inside the nanopores was indicated as a major bottleneck of PSi optical biosensors towards the achievement of high sensitivity9 and, in turn, low DL values comparable to those of other state-of-the-art optical biosensing techniques, e.g. surface plasmon resonance (SPR) able to achieve sub-nanomolar DL already in direct label-free configuration.14
To improve PSi biosensor sensitivity and reduce, in turn, DL, label-free signal amplifications strategies have been proposed. In 2007, Sailor and coworkers tackled the problem of
biomolecule diffusion inside PSi by continuously circulating 4mL of IgG solution on a protein A covered nanopore surface.15 This strategy allowed decreasing the detection limit down to 50 nM,15 though the large volume (4 mL) of IgG solution required for recirculation might represent a problem for perspective clinical applications where lower volumes (few hundreds of µL) are usually sampled for point-of-care instruments.16 In 2014 Weiss and coworkers exploited DNA-induced corrosion of PSi waveguides to lower PSi biosensor detection limit down to 10 nM in DNA detection, though the approach requires a destructive measure based on the increase of PSi porosity upon corrosion.17 More recently (2015), Segal
4
and coworkers proposed a novel microfluidic platform that exploits electrokinetic focusing to enhance DNA diffusion and hybridization inside PSi.9 A detection limit of 1 nM was obtained using this strategy, though the high constant voltage (350 V) applied across the platform during operation poses important safety issues in real-world applications. Besides, non label-free amplification strategies have been also reported using enzyme,18 polymer,19 proteolitic polymer,20 fluorogenic peptide21 in combination with PSi, which allowed reaching sub-micromolar to sub-nanomolar DLs. Nonetheless, the higher sensitivity of this strategies is coupled with drawbacks typical of labeling approaches, which are reagent- and time-comsuming22 and lead to molecule alteration.23
In this work, we report on a non-amplified label-free PSi interferometric aptasensor for specific detection of Tumor Necrosis Factor alpha (TNFα, a protein biomarker of sepsis) at concentration down to 3.0 nM with signal-to-noise ratio (S/N) of 10.7, featuring a detection limit of 200 pM. This represents a 10000-fold improvement in protein detection with respect to prior non-amplified label-free PSi biosensors.11
A factor 1000 in improvement is achieved by using a novel, robust, and effective signal-processing technique for PSi interferometers, namely IAW reflectance spectroscopy. The IAW reflectance spectroscopy is based on the calculation of the average value over wavelength of spectral interferograms. Interferograms are obtained by subtracting
experimental reflection spectra acquired on PSi interferometers in buffer after and before binding of the target analyte. The IAW reflection spectroscopy has been recently proposed by our group as a higher sensitivity alternative to more conventional Fast Fourier Transform (FFT) reflection spectroscopy for PSi biosensors.23 In Ref. 23 we elucidated the IAW reflection spectroscopy technique by taking non-specific adsorption of BSA on PSi interferometers as case study, a simple model currently used as proof-of-concept for
5
reflection spectroscopy by reporting for the first time its dramatic impact on the performance of PSi biosensors taking PSi aptasensors as case study.
A further factor 10 in improvement is achieved by introducing a novel PSi preparation method that allows changing pore size (up to a 3x increase in diameter) at constant porosity. This is in contrast to standard PSi preparation methods, where enlargement of pore size is obtained though the use of an increased etching current density during PSi formation that leads to an increased porosity.24 As porosity increases the size of PSi skeleton reduces, which threatens PSi mechanical stability, and the effective refractive index of PSi diminishes, which reduces sensitivity of PSi interferometers due to a smaller signal-to-noise ratio. Here we show that removal of PSi sacrificial layers prepared using increasing current densities values results in a mosaic-like nanostructured surface with larger average tile sizes. This mosaic-like
nanostructured surface is used as a fingerprint to prepare a further PSi sensing layer at
constant current density and, in turn, with constant porosity value, though featuring pores with different average diameters (from 60 to 180 nm) consistently with the tile size of the surface texture. This allows improving diffusion and binding of bioanalytes into PSi by enlargement of pore diameter without reducing effective refractive index of PSi interferometer and, in turn, sensitivity of PSi biosensors.
Results and Discussion
Preparation of PSi interferometer with increased pore size (3x) and constant effective refractive index (porosity)
Preparation of PSi interferometer is carried out through a two-steps electrochemical etching process. In the first step, a PSi sacrificial layer is formed and immediately removed to avoid the presence of a top parasitic layer (pores with a few nmin diameter and ~80 nm in depth)25 restricting effective diffusion of large (tens of kDa) molecules in the PSi layer underneath; in
6
the second step, a PSi sensing layer is prepared aimed at subsequent biofunctionalization of the inner pore surface with suitable bioreceptors (i.e. aptamer) for targeting specific analytes (i.e. TNFα).
Two protocols differing for the current density values chosen to etch the PSi sacrificial layer, namely 200 and 700 mA/cm2 for 30s, are used. In both cases, the as-prepared PSi sacrificial layer is chemically dissolved by dipping the samples in NaOH aqueous solution for 5 minutes. Different physico-chemical approaches have been proposed to remove the PSi parasitic layer before etching of the next PSi sensing layer (e.g. H2SO4/H2O2 weak wet oxidation followed by silicon dioxide removal in HF solution; electropolishing of the silicon substrate before PSi formation; high-temperature thermal annealing of the silicon substrate).25 Nonetheless, chemical dissolution of PSi in NaOH aqueous solution is one of the most used, being fast, cheap, and effective.7,9,26 After removal of the PSi sacrificial layer, a PSi sensing layer is eventually prepared by using a constant etching current density, namely 500 mA/cm2 for 30 s. The same aqueous electrolyte HF:EtOH=3:1 (v/v) is used for both PSi sacrificial and sensing layer preparation.
Figure 1 reports typical outcomes of scanning electron microscopy (SEM) (Fig. 1a,b) and atomic force microscopy (AFM) analyses (Fig. 1c,d) performed on the sample surface after dissolution of the PSi sacrificial layer prepared at either 200 (Fig. 1a,c) or 700 mA/cm2 (Fig. 1b,d). SEM and AFM analyses consistently show a mosaic-like surface with nanostructured tiles featuring peak-to-peak height (average value) of about 70 nm regardless of the etching current density value. Conversely, the in-plane size of the nanostructured tiles strongly depends on the etching current density value used for the PSi sacrificial layer preparation. Average size of the tiles for the two mosaic-like surfaces is about 50 and 150 nm for the sample etched at 200 (Figure 1a,c) and 700 mA/cm2 (Figure 1b,d), respectively. A three-fold (3x) increase in the size of the nanostructured tiles is consistently achieved by changing the etching current density during PSi sacrificial layer preparation by a factor (roughly) 3. We
7
argue that such a nanostructured surface texturing represents the fingerprint of our PSi layer. In fact, it replicates to a certain extent the morphology of the PSi sacrificial layer at its bottom and sets the morphology of the next PSi sensing layer acting as a surface pre-patterning. Figure 1e,f shows typical outcomes of the SEM analysis performed on the cross-section of two PSi sensing layers prepared using same etching current density value (i.e. 500 mA/cm2) though starting from different mosaic-like surface textures with average tile size of 50 and 150 nm, respectively. The mosaic-like surface textures were obtained from dissolution of PSi sacrificial layers etched at 200 (Fig. 1a,c) and 700 mA/cm2 (Fig. 1b,d). The two PSi layers feature similar columnar-like morphology, with same thickness and porosity (as estimated from reflection spectra according to the procedure detailed in the Supporting Information, Experimental section), namely 5.14 and 5.16 µm ± 0.10 µm and 76.0 and 76.0 % ± 0.6% for nanostructured surface textures with for 50 and 150 nm tile size, respectively. These results are consistent with the etching parameters chosen to perform the experiments. In fact, both the PSi sensing layers are prepared using same current density and electrolyte composition, which mainly set porosity, and same etching time, which mainly sets thickness. Remarkably, the two PSi layers feature significantly different pore diameters, though etched at the same etching current density. PSi layers etched from mosaic-like surface with tile size of 150 nm feature pores with average diameter of 180 nm. This is 3 times larger that the diameter of pores of PSi layers etched from mosaic-like surface with tile size of 50 nm (i.e. 60 nm). Both the results are consistent with the average size of surface mosaic tiles and corroborates our hypothesis on the influence of the nanostructured surface textures resulting from the removal of PSi
sacrificial layer on the morphology of the next etched PSi sensing layer.
This is the first report showing that tuning of the current density value used for preparation of the PSi sacrificial layer allows changing pore size of the next etched PSi sensing layer while retaining PSi sensing layer porosity constant and, in turn, signal-to-noise ratio of PSi
8
and smaller pores features same refractive index neff=1.53 in spite of the 3x difference in pore size, in agreement with the effective medium approximation theory.27
Aptamer-functionalization of PSi interferometer for TNFα specific detection
A four-steps protocol is then used for the immobilization on the inner surface of both the two PSi interferometers, with smaller and larger pores, of aptamer probes able to selectively capture TNFα, a biomarker for late response to sepsis (Figure 2).28 Aptamers are synthetic oligonucletides (DNA, RNA29 or XNA30) binding, by affinity interaction, a wide range of targets such as drugs, peptide biomarkers, and organic or inorganic molecules of general interest.29-31 In the last 10-15 years32 aptamers have been successfully employed as therapeutics33 as well as probes in biosensing, replacing more conventional antibodies (Ab).34,35 Main advantages of aptamers with respect to Abs for biosensing are, a) tunable synthesis processes conditions, b) lower molecular dimension, and c) properly-oriented immobilization chemistry not affecting binding properties.34.35
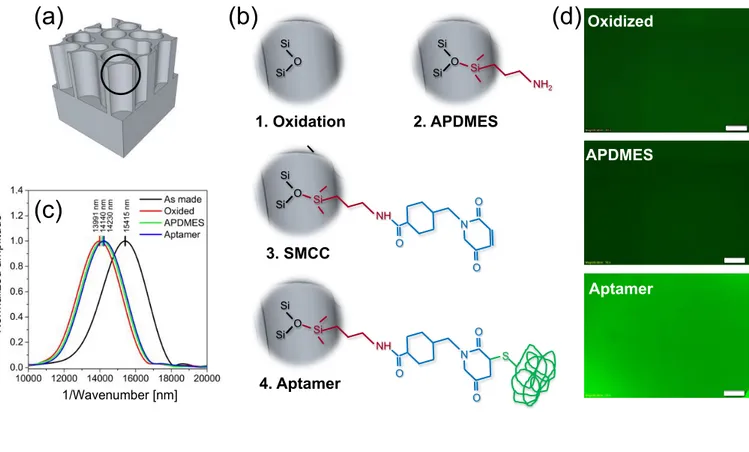
The accomplishment of the whole aptamer-functionalization protocol is verified through acquisition of reflection spectra of PSi interferometers in air both before and after each functionalization step (Fig. S1a), from which changes in the effective optical thickness (EOT) of PSi are calculated by Fast Fourier Transform (FFT) reflectance spectroscopy7 (Fig. 2c). As-prepared PSi interferometers are thermally oxidized at 500 °C for 1 h to partially convert silicon to silicon dioxide (1st step, Fig 2b-1). This allows having the inner surface of PSi interferometers covered with a stable hydrophilic oxide layer that is useful for subsequent aminosilanization. Oxidation also improves infiltration of aqueous buffer used during both biofunctionalization and biosensing steps. A blue-shift in the EOT value of oxidized with respect to as-prepared PSi interferometers ((EOTOx−EOTPSi)/EOTPSi≈-10± 1% for both smaller and larger pores) confirms successful oxidation of PSi (Fig. 3c), according to the equivalent medium approximation (EMA) theory.27 Aminosilanization of the inner surface of
9
oxidized PSi interferometers with APDMES ((3-aminopropyl)-dimethyl-ethoxysilane) is then performed (2nd step, Fig 2b-2). APDMES is preferred to other more conventional silanes, e.g. APTES((3-Aminopropyl)triethoxysilane), because of its ability to form a monomolecular, thinner silane layer with a more homogeneuos surface coverage with respect to APTES.36 A red-shift in the EOT value of aminosilanized with respect to oxidized PSi interferometers ((EOTApdmes−EOTOx)/EOTOx≈0.6± 0.1%) corroborates successful covalent binding of APDMES on the oxidized PSi surface. SMCC
(4-(N-Maleimidomethyl)cyclohexanecarboxylic acid N-hydroxysuccinimide ester) is then coupled to APDMES amine-group as a cross-linker for thiolic groups of aptamer (3rd step, Fig 2b-3). SMCC is an amine-to-thiol crosslinker largely used for PSi biosensors9,37 containing NHS-ester groups at one end able to bind amine groups and maleimide reactive groups at opposite end able to bind tothiolic groups. A thiolated anti-TNFα aptamer able to selectively bind TNFα protein is eventually linked to the maleimide reactive groups of SMCC (4th step, Fig 2b-4). A red-shift in the EOT value results from covalent binding of the aptamer to SMCC-functionalized PSi interferometers ((EOTAptamer−EOTox)/EOTox≈1± 0.5% and 4± 2.2% for smaller and larger pores, respectively). For both the PSi interferometer typologies, the whole aptamer-functionalization protocol is also repeated using a fluorescein-labeled aptamer (Aptamer 5’-FAM – 3’-THIO) (Fig. 2d). This allows confirming successful aptamer binding to SMCC via standard fluorescence microscopy.
It is interesting to note that whereas EOT changes of PSi interferometers with both smaller and larger pores are similar for thermal oxidation and APDMES linking steps, binding of anti-TNFα aptamer on PSi with larger pores results in a significantly larger EOT variation (≈4%) with respect to that on PSi with smaller pores (≈1%). We argue that such a difference is due to improved diffusion efficiency and binding yield of the anti-TNFα aptamer (10 KDa) in pores with a 3x increased diameter. On the other hand, it is reasonable that the pore size does not significantly affect either diffusion or binding of APDMES (161 Da) and SMCC (219 Da),
10
both of which have significantly lower molecular weight than the aptamer. This is consistent with similar EOT changes measured on the two PSi interferometer typologies after APDMES immobilization.
Detection of TNFα protein at nanomolar level using PSi aptasensor
Aptasensors based on aptamer-functionalized PSi interferometers with both smaller and larger pores are eventually used for detection of TNFα protein through bioaffinity interactions. Different TNFα concentrations ranging from 3 to 390 nM are tested after solubilization in PBS 1X (pH= 6.4) and injection (200 µL at 5.0 µL/min) into a flow-cell containing the PSi interferometer (Figure 3). PBS 1X is used as runner buffer during affinity interaction monitoring of TNFα. TNFα results to be globally neutral (pI=6.4) in PBS 1X and electrostatically shielded by high ionic strength (NaCl 137 mM), thus improving protein diffusion inside the nanopores.38 Reflection spectra are acquired both before and after injection of any tested TNFα concentration and used to calculate the IAW (Interferogram Average over Wavelength) output signal, according to the protocol detailed in the Supporting Information, Experimental section. Typical reflection spectra acquired in PBS before and after injection of TNFα 78.5nM are reported in Figure 3a. A small but clear change in the reflection spectrum is visible after injection of TNFα 78.5 nM, with respect the reference reflection spectrum in PBS. IAW signals are obtained as the average value of interferograms of any tested TNFα concentration calculated over the wavelength range 500-800 nm. For any given TNFα concentration, the spectral interferogram is obtained by subtraction of the reflection spectrum acquired in PBS after injection of TNFα from the reflection spectrum acquired in PBS before injection of TNFα (reference spectrum), and subsequent application of the absolute value function. A cartoon of the whole procedure for the analysis of PSi
interferometer by IAW reflectance spectroscopy is reported in Fig. S2. Typical interferograms obtained for PBS (reference interferogram) and TNFα 78.5nM are reported in Figure 3b. It is
11
apparent that the interferogram obtained after injection of TNFα 78.5nM has a significantly higher average value and, in turn, IAW value, than that in PBS.
Figure 3c reports IAW signals obtained over the whole range of TNFα concentrations tested for both the PSi interferometers with both smaller and larger pores, after removal of the blank IAW0 value in PBS. It is apparent that for both the PSi interferometer typologies it is possible to detect TNFα at concentrations down to 10 nM, which is 1000 times smaller than the lowest concentration detected so far using a PSi either biosensor or aptasensor in direct label-free mode.11 Interestingly, at any TNFα concentration, signal-to-noise ratio and sensitivity of PSi interferometer with larger pores are higher than those with smaller pores. The lowest detected concentration using PSi interferometers with smaller pores is 12 nM (IAW-IAW0=0.038 a.u.) with S/N=7.6, being the N evaluated as standard deviation σIAW0 of IAW0 values obtained for PBS. More specifically, σIAW0 is calculated from IAW0 values obtained for PBS before TNFα injection over a time interval of 40 minutes (IAW0=0.068± 0.005 a.u.), and results to be 0.005 a.u. both for small pores and large pores. Notice that such a small value of the standard
deviation σIAW0 clearly indicates good stability of the IAW signal over time and, in turn, of oxidized PSi functionalized with APDMES. On the other hand, PSi interferometers with larger pores are able to detect a TNFα concentration as low as 3.0 nM (IAW-IAW0=0.053 a.u.), which is four times smaller of PSi interferometer with smaller pores, with S/N=10.6. These results corroborate our hypothesis that larger pores improve diffusion of large biomolecules, i.e. aptamer and TNFα, into the PSi layer.
The two calibration curves IAW-IAW0 versus TNFα concentration reported in Figure 3c are best-fitted by logistic sigmoidal curves both for smaller (R2 = 0.999) and larger (R2=0.986) pores:
!"# − !"#! = !!+ !!!!! !! !
!!
12
where IAW-IAW0 is the signal recorded for each tested TNFα concentration (C), and A1, A2,
x0, and p are fitting parameters (A1= 1.49×10⁻⁵, A2= 0.197, Cm= 99.8 nM, p=0.672 for smaller
pores and A1= 1.19×10⁻³, A2= 1.18, Cm= 2370 nm, p=0.473 for larger pores). In particular, A1
and A2 representIAW-IAW0 values resulting from fitting for TNFα concentrations approaching zero and infinity, respectively, Cm is the concentration value of the logistic
midpoint, and p is the steepness of the logistic curve. Notice that A1 is within the noise level
(σIAW0=0.005 a.u) of the system for both the interferometers. Differences in parameters of logistic curves best-fitting experimental calibration curves of interferometers based on smaller and larger pores reflect the difference in sensitivity and limit of detection of the two types of biosensors based on smaller and larger pore interferometers. Theoretical detection limits for the two PS interferometer typologies are calculated from the calibration curves by
extrapolation of the concentration corresponding to the IAWDL-IAW0 value for which the signal-to-noise ratio is 3σIAW0.39 This yields a IAWDL-IAW0= 0.015 a.u. (boundary of the gray area in Fig. 3c) that corresponds to a concentration of 2.4 nM and 200 pM for PSi
interferometers with smaller and larger pores, respectively. Therefore, larger pores yield a further 10-fold reduction in DL with respect to smaller pores, thanks to an improved diffusion of TNFα inside the pores coupled to an improved aptamer immobilization onto the PSi
surface.
In order to further highlight the difference in sensitivity of larger over smaller pores PSi interferometers, sensitivity curves are calculated by taking the first derivative of the two calibration curves at TNFα concentrations ranging from DL to the highest tested
concentration value (Fig. S1b). There is a clear difference in sensitivity between the two PSi interferometer typologies over the whole range of TNFα concentrations. Remarkably, sensitivity values at TNFα concentration close to the DL are 0.03 and 0.004 nM-1 for PSi interferometer with larger and smaller pores, respectively. This corroborates the 10-fold reduction in DL of PSi interferometers with larger pores according to the equivalent definition
13
of DL=3σIAW0/S, being S the local sensitivity value obtained as the first derivative of the calibration curve in correspondence of the lower tested concentrations.
Finally, binding selectivity toward TNFα of aptamer-functionalized PSi interferometer with larger pores is investigated injecting pepsin (solubilized in PBS) at concentration of 390 nM (as negative control), which is the highest TNFα concentration tested in this work. Pepsin protein is chosen for selectivity study since its molecular weight (35kDa) is comparable to that of our target TNFα (25kDa). This allows ruling out effects on the biosensor response due to different diffusion kinetics in the nanopores of the two biomolecules, that is Pepsin and TNFα. As visible in Figure 3c, the signal recorded for pepsin (IAWpepsin-IAW0=0.015 a.u) is not significantly different from the 3x noise level (3σIAW0=0.015 a.u.) and it is 23-fold smaller than the signal recorded for TNFα at the same concentration (IAWTNFα-IAW0= 0.350 a.u.). This result confirms high selectivity in affinity interaction of the anti-TNFα aptamer/TNFα pair used in this work.
In order to infer into the analytical accuracy of the experimental calibration curve in Figure 3c, a further experiment on PSi interferometer with larger pores is performed, aimed at emulating detection of an unknown concentration of TNFα. A 200 µL of PBS solution containing TNFα 78.5 nM is injected, which is an intermediate concentration among those used for the
calibration experiments. Reflection spectra measured in PBS before and after injection of TNFα 78.5 nM yields IAWTNFα-IAW0= 0.208 a.u. (marker X in Fig. 3c). According to the calibration curve in Eq.1 this IAWTNFα value corresponds to a measured concentration of 87 nM, which results in a measurement accuracy A= 10% (by definition A = │Ct-Cm│/Ct ×100, with Ct and Cm being true (from stock dilution) and measured (from calibration curve) concentration values, respectively).40 Remarkably, the measure accuracy value is within the requirement of FDA for bioanalytical applications (lower than 15%).41
14
A conventional FFT reflectance spectroscopy analysis of the same set of reflection spectra used in Fig. 3c for the IAW reflectance spectroscopy analysis is carried out as a benchmark. This allows to directly compare EOT and IAW changes resulting from TNFα injection in the two PSi interferometer typologies. Figure 3d shows the calibration curves over the whole range of tested TNFα concentrations obtained using EOT values as output signal. The EOT values calculated for each TNFα concentration are firstly subtracted from the EOT0 value in PBS, thus obtaining EOT-EOT0. This latter is then divided by EOT0 value to calculate relative EOT changes (rEOT=(EOT-EOT0)/EOT0) in TNFα with respect to PBS. The limit of
detection achievable with FFT analysis is estimated as the TNFα concentration for which rEOT= 3σrEOT0= 7.11×10⁻⁴ (boundary of the gray area in Fig. 3d), being σrEOT0= 2.37×10⁻⁴ the standard deviation of rEOT0 calculated for PBS before TNFα injection over a time interval of 40 minutes. It is apparent that conventional FFT analysis does not allow to reliably
discriminate among the different TNFα concentrations used in this work. In fact, the rEOT values results either within or close to the noise level for both the PSi interferometer typologies. This is in agreement with the current literature on PSi label-free biosensors for which the nanomolar level is only targeted through the use of signal amplification strategies that allow increasing EOT changes upon biomolecule binding at the nanopore surface and to yield, in turn, the FFT signal processing strategy more effective and reliable.
Conclusions
Summarizing, in this work we have broken new ground on the nanostructured biosensor arena by reporting on a label-free nanostructured porous silicon (PSi) interferometric aptasensor able to specifically detect Tumor Necrosis Factor alpha (TNFα, a protein biomarker of sepsis) at concentration down to 3.0 nM with S/N=10.6 and DL=200 pM. This represents a 10000-fold improvement with respect to direct label-free PSi biosensors and pushes PSi biosensors
15
close to the most sensitive optical and label free transduction techniques, e.g. surface plasmon resonance (SPR).
We showed the dramatic effect of the IAW reflectance spectroscopy when applied to PSi biosensors, which gives a 1000-fold-improvement both in sensitivity and detection limit with respect to more conventional Fast Fourier Transform (FFT) reflection spectroscopy. The IAW reflectance spectroscopy promises to be game-changing in the optical biosensing world. Nonetheless, its impact will not be limited to this field because our results will pave the way towards applications of the IAW reflectance spectroscopy on different fields, from
nanophotonics to nanomedicine.
We introduced a novel PSi preparation method that allows changing pore size (up to a 3x increase in diameter) at constant porosity (and, in turn, constant effective refractive index). This allows tackling mass-limited diffusion of biomolecules inside the nanopores of PSi layers, whereas maintaining signal-to-noise ratio of PSi interferometer constant, resulting in a 10-fold improvement of both sensitivity and detection limit. The proposed method is in contrast to standard PSi preparation methods, where enlargement of pore size is targeted though the use of an increased etching current density during the PSi formation that leads, in turn, to an increased porosity and, in turn, to a reduction of effective refractive index of PS.
Experimental
Chemicals and materials
Silicon wafer boron doped, <100> oriented, resistivity of 0.8-1.2 mΩ·cm (Siltronix, Inc., France), aqueous hydrofluoric acid (HF, 48%), absolute ethanol (99.8%), sodium hydroxide (NaOH, >98%), isopropyl alcohol (99.7%), anhydrous pentane (98%), sodium chloride (NaCl 99%), (3-aminopropyl)-dimethyl-ethoxysilane (APDMES, 97%, ABCR, Germany), 4-(N-Maleimidomethyl)cyclohexane carboxylic acid N-hydroxy-succinimide ester (SMCC, Thermo Fisher Scientific, USA), N,N-dimetilformammide (DMF, 99,8% anhydrous),
anti-16 TNFα (Tumor necrosis factor alpha) Aptamer 5’-FAM–
GGAGUAUCUGAUGACAAUUCGGAGCUCC-3’-THIO (28 mer) 42 (synthetized in our lab), Aptamer 3’-THIO (same sequence without fluorescent label) (synthetized in our lab), (Tris(2-carboxyethyl)phosphine hydrochloride (TCEP·HCl, Thermo Fisher Scientific), sodium bicarbonate (NaHCO3), sodium phosphate monobasic (Na2HPO4), TNFα (Human TNF alpha Recombinant Protein MW=25kDa, pI=6.4) (eBioscience, USA), pepsin (P7000, 35 kDa). PBS 1X buffer is prepared dissolving 100 mM Na2HPO4 and 100 mM NaCl in deionized water (DIW), adjusted to pH = 6.4, filtered using syringe filters (Minisart® NML Syringe Filters 1.20 µm), and used both as a running buffer and as a solvent to TNFα and pepsin. Unless otherwise stated, reagents were purchased from Sigma-Aldrich (Milan, Italy). The anti TNFalpha aptamer was synthesized in our lab by an Applied Biosystems instrument using reagents and phosphoramidites from Glen Research (20-2933-41 3' thiol modifier C3 CPG,3003-05 ribo A (Bz-A-CE); 3025-05 G-CE TBDMS; 3415-052'F-Ac-C; 10-3430-05 2'F-U; 10-1039-02 Amino modifier C6 dT).
Preparation and oxidation of PSi samples
PSi layers are prepared by anodic etching of silicon wafers using a HF(48%):EtOH, 3:1 v/v electrolyte. A PSi sacrificial layer is initially formed and immediately removed to avoid the presence of a top parasitic layer, then a PSi sensing layer is prepared on the same silicon substrate after PSi sacrificial layer removal. Caution: HF is a highly corrosive acid, and it has to be handled with extreme care under safety work conditions! Silicon samples (area of 0.567 cm2) are etched in a two-electrodes configuration Teflon cell equipped with an aluminum flat anode and a platinum wire cathode and driven by a Keithley 2602A SourceMeter. Two protocols are used for the preparation of the PSi sacrificial layer only differing for the etching current density, namely 200 and 700 mA/cm2 for 30s. The PSi sacrificial layer is dissolved right after preparation in a NaOH (1M):EtOH,9:1 v/v electrolyte. The silicon samples are then
17
thoroughly rinsed in ethanol, and eventually dried under nitrogen flow. The thickness of the PSi sacrificial layer was measured using a high-resolution stylus profilometer (Veeko Dektak 150) right after dissolution in NaOH. A thickness of 2.3 and 7.8 µm was measured after etching with 200 and 700 mA/cm2, respectively, for 30 s, in agreement with theoretical calculations based on the total charge provided to the electrochemical system, with all other parameters kept unchanged.
The PSi sensing layer is prepared at etching current density of 500 mA/cm2 for 30s, regardless of the different preparation of the former PSi sacrificial layer. PSi samples are then rinsed in 2-propanol and pentane, and eventually dried under nitrogen flow.
After preparation of the PSi sensing layer, PSi samples are thermally oxidized in a muffle furnace (ZB 1, ASAL, Italy) at 500°C for 1h (ramp-up/ramp-down 12°C/min) in room atmosphere.
Morphological and optical characterization of PSi samples
Morphological characterization of silicon samples after PSi sacrificial layer removal is carried out both using a Scanning Electron Microscope (SEM, JSM-6390, JEOL, Italy) at an
accelerating voltage of 5 kV and an Atomic Force Microscopy (AFM, Icon Brucker, Italy). Morphological characterization of PSi samples is carried out using a Scanning Electron Microscope (SEM, JSM-6390, JEOL, Italy) at accelerating voltage of 5 kV. Porosity of PSi layers is computationally evaluated by fitting experimental reflection spectra of as-prepared PSi samples with a home-made software developed in Matlab (MathWorks, USA).43
Both as-prepared and thermally-oxidized PSi samples are optically characterized in air in the wavelength range 400-1000 nm using a fiber-optic setup consisting of a halogen lamp source (HL-2000), a bifurcated fiber-optic probe (QR200-7-VIS-BX), and a UV-VIS spectrometer (USB2000-VIS-NIR-ES) purchased from Ocean Optics (USA). Light exiting from the halogen lamp source is fed through one arm of the bifurcated fiber-optic probe orthogonally
18
onto the PS surface and the reflected light is collected through the other arm of the bifurcated fiber-optic probe into a UV-VIS spectrometer that yields the reflection spectra.
Acquisition parameters of reflection spectra are: integration time of 2ms, average scan number 5, boxcar width 5, with spectrometer working in photon counts mode.
Aptamer-functionalization protocol
After thermal oxidation, PSi samples are silanized with APDMES (1.0%) in EtOH (50 ml) for 30 minutes in vacuum (3 mbar = 300 Pa) and under gentle shaking (30 rpm) on a Polymax 1040 - waving Platform Shaker (Heidolph). After silanization, PSi samples are then
abundantly rinsed in ethanol (three washing step, 5.0 ml) and gently dried under nitrogenflow. Aminic groups of APDMES are linked with SMCC using 200 µL of SMCC 20 mM in DMF for 60 minutes in vacuum (3 mbar = 300 Pa) and under gentle shaking (30 rpm) on a Polymax 1040 - waving Platform Shaker (Heidolph). After SMCC linking, PSi samples are rinsed with both 300 µL DMF (3 times) and 300 µL of ethanol (3 times), and gently dried under nitrogen flow. Anti-TNFα aptamer 3’-THIO either with or without fluorescein label is eventually bound to SMCC using a solution of 200 µL of 10 µM aptamer and 12.5 mM of TCEP·HCl in NaHCO3 buffer (20 mM, pH = 7.4) for 120 minutes in vacuum (3 mbar = 300 Pa) and under gentle shaking (10 rpm) on a Polymax 1040 - waving Platform Shaker (Heidolph). The solution is pre-incubated for 30 minutes for aptamer reduction before using it on PSi samples. After aptamer binding, PSi samples are rinsed with 300 µL NaHCO3 (3 times), 300 µL of DIW (3 times), and with 300 µL of ethanol (6 times), then gently dried under nitrogen flow. Each step of aptamer-functionalization protocol is monitored by collection of reflection spectra in air using same optical setup and parameter setting described in Morphological and optical characterization of PSi samples of this document, for anti-TNFα aptamer 3’-THIO without fluorescein.
19
Aptamer-functionalization protocol steps for the case of anti-TNFα aptamer 3’-THIO with fluorescein is also carried out by standard fluorescence microscopy using an inverted Fluorescence microscope (Olympus IX81, FITC filter, 10X magnification) in reflected light observation setup.
Infiltration protocol of PSi interferometers with TNFα
A flow-cell system integrated with the fiber-optic setup previously described is used for the optical characterization of PSi samples in the presence of PBS 1X at different TNFα
concentrations. The PSi sample is secured into a home-made Plexiglas flow-cell with volume of 100 µL. The flow-cell is connected to a Nexus 3000 (Chemyx Inc., USA) syringe pump working in withdraw mode, through which solutions under test are injected in the flow-cell. PBS 1X is firstly injected at 5 µL/min for a warm-up time of 40 minutes during which reflection spectra are recorded every single minute. After the warm up time is elapsed, TNFα solutions with concentration in the range 3-390 nM are injected for 40 min at 5 µL/min (200 µL total volume) for each concentration value using PBS 1X as a carrier, starting with the lower concentration value. A 20-minutes-long rinsing step in PBS 1X at 20µL/min follows injection of each TNFα concentration value. Reflection spectra are all acquired in PBS, both before starting TNFα injection and after injection of each TNFα concentration value at the end the rinsing step.
The same protocol described above is applied for the detection of a 78.5 nM TNFα sample (for accuracy evaluation) and of a 390 nM pepsin sample (for selectivity evaluation). Acquisition parameters of reflection spectra are: integration time of 2 ms, average scan number 5, boxcar width 5, with spectrometer working in normalized reflection mode.
20
Reflection spectra are normalized with respect to a reference mirror before calculation of the interferograms, so as to compensate for non-idealities of the spectrometer (e.g. reduction of the sensitivity at the edge of the wavelength range under investigation). Interferograms are then calculated by subtraction (intensity wavelength by wavelength) of the reflection spectrum acquired for each TNFα concentration from the reference reflection spectrum acquired in PBS buffer. An interferogram is also calculated for PBS buffer (blank
interferogram) before injection of each TNFα concentration, by subtraction of the reflection spectrum acquired at the end of a 40-minutes-long warm-up period in PBS (t = 40 min) from the reflection spectrum acquired at the beginning of the warm-up period in PBS (t = 0 min). The average value of each interferogram is then removed to reduce possible artifacts on the spectral reflection intensity induced by unwanted (though unavoidable) TNFα adsorption on top of the PSi layer, as pointed out by Pacholski et al,44 and/or on the flow-cell quartz window through which optical measurements are carried out. Eventually, the output signal is extracted by applying the absolute value function to each filtered interferogram and then calculating the average value of the resulting interferogram over the whole spectral range of interest (500-800 nm), namely Interferogram Average over Wavelength (IAW). A schematic description of the whole IAW reflectance spectroscopy strategy is shown in Fig. S2.
Calibration by Fast Fourier Transform (FFT) reflectance spectroscopy
Effective Optical Thickness (EOT), namely 2nL with n effective refractive index and L thickness of the PS layer, respectively, is estimated by reflective interferometric Fast Fourier Transform spectroscopy using a home-made software developed in MatLab (MathWorks®, USA). The wavelength axis of each reflection spectrum is firstly inverted (x-axis changed from wavelength to 1/wavelength) to get a wavenumber axis, then a cubic-spline interpolation is applied to reflection data so as to have a dataset (reflection, wavenumber) spaced evenly (sample-to-sample distance 8.57 x 10⁻⁷ nm-1). A Hanning window is applied to the reflection
21
spectrum and it is zero-padded to a power of two, specifically 224. Eventually, the FFT algorithm is applied to the zero-padded reflection spectrum, which yields both Fourier transform amplitude and phase (y-axis in the Fourier transform domain) as a function of length, i.e. 1/wavenumber (x-axis in the Fourier transform domain), with spatial resolution of about 0.07 nm. The EOT value corresponds to the 1/wavenumber axis (x-axis) value in the Fourier transform domain for which the main peak in the Fourier Trasform amplitude (y-axis) occurs.
Associated Content
Supporting Information Available: the following files are available free of charge SupportinInformation_10102016.docx.
Brief Description: Further reflectance measurements, sensitivity analysis, and IAW reflectance spectroscopy visual description.
Corresponding Author
*E-mail: [email protected]
Acknowledgements
This research was funded by the Italian Minister for University and Research (MIUR) Futuro in Ricerca (FIR) programme, GrantNo. RBFR122KL1 (SENS4BIO).
References
[1] Stewart, B. M. P.; Buriak, J. M. Chemical and Biological Applications of Porous Silicon Technology. Adv. Mater. 2000, 12, 859–869.
22
[2] Jane, A.; Dronov, R.; Hodges, A.; Voelcker, N. H. Porous silicon on the advance. Trends Biotechnol. 2009, 27 (4), 230–239.
[3] Kilian, K. a; Böcking, T.; Gooding, J. J. Importance of Surface Chemistry in Mesoporous Materials: Lessons from Porous Silicon Biosensors. Chem. Commun. 2009, 6, 630–640. [4] Gupta, B.; Zhu, Y.; Guan, B.; Reece, P. J.; Gooding, J. J. Functionalised porous silicon as
a biosensor: emphasis on monitoring cells in vivo and in vitro. Analyst 2013, 138 (13), 3593–3615.
[5] Anglin, E. J.; Cheng, L.; Freeman, W. R.; Sailor, M. J. Porous silicon in drug delivery devices and materials. Adv. Drug Deliv. Rev. 2008, 60 (11), 1266–1277.
[6] Kafshgari, M. H.; Voelcker, N. H.; Harding, F. J. Applications of zero-valent silicon nanostructures in biomedicine, Nanomedicine 2015, 10 (16), 2553–2571.
[7] Sailor, M. J. Fundamentals of Porous Silicon Preparation In Porous Silicon in Practice; Wiley-VCH Verlag GmbH & Co. KGaA, 2011; pp 1–42.
[8] Lin, V. S.-Y.; Motesharei, K.; Dancil, K.-P. S.; Sailor, M. J.; Ghadiri, M. R. A Porous Silicon-Based Optical Interferometric Biosensor. Science 1997, 278 (5339), 840–843. [9] Vilensky, R.; Bercovici, M.; Segal, E. Oxidized Porous Silicon Nanostructures Enabling
Electrokinetic Transport for Enhanced DNA Detection. Adv. Funct. Mater.2015, 25 (43), 6725–6732.
[10] De Stefano, L.; Arcari, P.; Lamberti, A.; Sanges, C.; Rotiroti, L.; Rea, I.; Rendina, I. DNA Optical Detection Based on Porous Silicon Technology: from Biosensors to Biochips. Sensors 2007, 7 (2), 214–221.
[11] Urmann, K.; Walter, J.-G.; Scheper, T.; Segal, E. Label-Free Optical Biosensors Based on Aptamer-Functionalized Porous Silicon Scaffolds. Anal. Chem.2015, 87 (3), 1999–2006.
[12] Rong, G.; Najmaie, A.; Sipe, J. E.; Weiss, S. M. Nanoscale porous silicon waveguide for label-free DNA sensing Biosens. Bioelectron. 2008, 23 (10), 1572–1576.
23
[13] Rusling, J. F.; Kumar, C. V; Gutkind, J. S.; Patel, V. (1) Rusling, J. F.; Kumar, C. V; Gutkind, J. S.; Patel, V. Measurement of Biomarker Proteins for Point-of-Care Early Detection and Monitoring of Cancer. Analyst 2010, 135 (10), 2496–2511.
[14] Homola, J. Surface Plasmon Resonance Sensors for Detection of Chemical and Biological Species. Chem. Rev.2008, 108 (2), 462–493.
[15] Schwartz, M. P.; Alvarez, S. D.; Sailor, M. J. Porous SiO2 Interferometric Biosensor for Quantitative Determination of Protein Interactions: Binding of Protein A to Immunoglobulins Derived from Different Species 2007, 79 (1), 327–334.
[16] Tudos, A. J.; Besselink, G. A. J.; Schasfoort, R. B. M. Trends in miniaturized total analysis systems for point-of-care testing in clinical chemistry. Lab Chip 2001, 1 (2), 83– 95.
[17] Zhao, Y.; Lawrie, J. L.; Beavers, K. R.; Laibinis, P. E.; Weiss, S. M. Effect of DNA-Induced Corrosion on Passivated Porous Silicon Biosensors. ACS Appl. Mater. Interf. 2014, 6 (16), 13510–13519.
[18] Szili, E. J.; Jane, A.; Low, S. P.; Sweetman, M.; Macardle, P.; Kumar, S.; Smart, R. S. C.; Voelcker, N. H. Interferometric porous silicon transducers using an enzymatically amplified optical signal. Sensors Actuators B Chem. 2011, 160 (1), 341–348.
[19] Holthausen, D.; Vasani, R. B.; Mcinnes, S. J. P.; Ellis, A. V; Voelcker, N. H. Polymerization-Ampli fi ed Optical DNA Detection on Porous Silicon Templates. ACS. Macr. Lett. 2012, 1, 919–921.
[20] Gupta, B.; Mai, K.; Lowe, S. B.; Wakefield, D.; Di Girolamo, N.; Gaus, K.; Reece, P. J.; Gooding, J. J. Ultrasensitive and Specific Measurement of Protease Activity Using Functionalized Photonic Crystals. Anal. Chem. 2015, 87 (19), 9946–9953.
[21] Krismastuti, F. S. H.; Pace, S.; Voelcker, N. H. Porous Silicon Resonant Microcavity Biosensor for Matrix Metalloproteinase Detection. Adv. Funct. Mater. 2014, 24 (23), 3639–3650.
24
[22] Rapp, B. E.; Gruhl, F. J.; Länge, K. Biosensors with label-free detection designed for diagnostic applications. Anal. Bioanal. Chem. 2010, 398 (6), 2403–2412.
[23] Mariani, S.; Strambini, L. M.; Barillaro, G. Femtomole Detection of Proteins Using a Label-Free Nanostructured Porous Silicon Interferometer for Perspective Ultrasensitive Biosensing. Anal. Chem. 2016, 88 (17), 8502–8509.
[24] Janshoff, A.; Dancil, K. S.; Steinem, C.; Greiner, D. P.; Lin, V. S.; Gurtner, C.; Motesharei, K.; Sailor, M. J.; Ghadiri, M. R. Macroporous p-Type Silicon Fabry - Perot Layers. Fabrication, Characterization, and Applications in Biosensing. 1998, 18, 12108– 12116.
[25] Chamard V., Dolino G., and F. Muller. Origin of a parasitic surface film on p+ type porous silicon J. Appl. Phys. 1998, 84, 6659–6666.
[26] Secret, E.; Wu, C.-C.; Chaix, A.; Galarneau, A.; Gonzalez, P.; Cot, D.; Sailor, M. J.; Jestin, J.; Zanotti, J.-M.; Cunin, F.; Coasne, B. Control of the Pore Texture in Nanoporous Silicon via Chemical Dissolution. Langmuir 2015, 31 (29), 8121–8128.
[27] Heller, W. Remarks on Refractive Index Mixture Rules. J. Phys. Chem. 1965, 69 (4), 1123–1129.
[28] Cho, S.; Choi, J. Biomarkers of Sepsis. Infect. & Chem.2014, 46 (1), 1–12.
[29] Liu, J.; Cao, Z.; Lu, Y. Functional Nucleic Acid Sensors. Chem. Rev. 2009, 109 (5), 1948–1998.
[30] M. Kuwahara , S. Obika, In vitro selection of BNA (LNA) aptamers. Artificial DNA: PNA & XNA. 2013, 4(2), 39.
[31] Mayer, G. The Chemical Biology of Aptamers. Angew. Chemie Int. Ed. 2009, 48 (15), 2672–2689.
[32] Peveler, W. J.; Yazdani, M.; Rotello, V. M. Selectivity and Specificity: Pros and Cons in Sensing. ACS Sensors. 2016, DOI: 10.1021/acssensors.6b00564.
25
[33] Keefe, A. D.; Pai, S.; Ellington, A. Aptamers as therapeutics. Nat. Rev. Drug. Discov. 2010, 9 (7), 537–550.
[34] Tombelli, S.; Minunni, M.; Mascini, M. Analytical applications of aptamers. Biosens. Bioelectron. 2005, 20 (12), 2424–2434.
[35] Iliuk, A. B.; Hu, L.; Tao, W. A. Aptamer in Bioanalytical Applications. Anal. Chem. 2011, 83 (12), 4440–4452.
[36] De Stefano, L.; Oliviero, G.; Amato, J.; Borbone, N.; Piccialli, G.; Mayol, L.; Rendina, I.; Terracciano, M.; Rea, I. Aminosilane functionalizations of mesoporous oxidized silicon for oligonucleotide synthesis and detection. J. R. Soc. Interface 2013, 10 (83), 20130160.
[37] Rong, G.; Ryckman, J. D.; Mernaugh, R. L.; Weiss, S. M. Label-free porous silicon membrane waveguide for DNA sensing. Appl. Phys. Lett. 2008, 93 (16), 161109.
[38] Chen, M. Y.; Sailor, M. J. Charge-Gated Transport of Proteins in Nanostructured Optical Films of Mesoporous Silica. Anal. Chem. 2011, 83 (18), 7186–7193.
[39] Gustavo González, A.; Ángeles Herrador, M. A practical guide to analytical method validation, including measurement uncertainty and accuracy profiles. TrAC Trends Anal. Chem. 2007, 26 (3), 227–238.
[40] Guide for measures of precision and accuracy. Anal. Chem. 1969, 41 (14), 2139.
[41] “Guidance for Industry. Bioanalytical Method Validation”,"
http://www.fda.gov/downloads/drugs/guidancecomplianceregulatoryinformation/guidance s/ucm368107 (accessed 09/08/2016)%
[42] Yan, X.; Gao, X.; Zhang, Z. Aptamers: Problems, Solutions and Prospects Gen. Prot. Bioinf. 2004, 2(1), 32-42
[43] Ruminski, A. M.; Barillaro, G.; Chaffin, C.; Sailor, M. J. Internally Referenced Remote Sensors for HF and Cl2 Using Reactive Porous Silicon Photonic Crystals. Adv. Funct. Mater. 2011, 21 (8), 1511–1525.
26
[44] Pacholski, C. Photonic crystal sensors based on porous silicon. Sensors (Basel). 2013, 13 (4), 4694–4713.
27 Figures Figure 1
(a)
(c)
(d)
(b)
(e)
(f)
28 Figure 2
(b)
APDMES Aptamer(d)
Oxidized(a)
(c)
4 1 2 3Figure S3 (a, b) FFT amplitude spectra of as-made and oxidized PS samples in air, as well as of 4
oxidized PS samples in both pure acetate buffer and in acetate buffer after injection of BSA 15 µM,
5
these latter zoomed in (b) to highlight the EOT values. (c) Calibration curve EOT-EOT0 Vs BSA
6
concentration in semi-log scale experimentally measured over 5 replicates (same dataset used for
7
the IAW analysis). The grey area underneath the calibration curve indicates EOT–EOT0 values
8
corresponding to BSA concentrations below the instrumental detection limit (15 µM, i.e. 15 nM, 1
9 mL) 10 11
a)
b)
c)
5000 7500 10000 12500 15000 0 1 2 3 4 5 6x10³ As made Oxidized Acetate BSA 15 µM Am p lit u d e [ a .u .] 1/Wavenumber [nm] 6000 7500 9000 10500 12000 13500 0 200 400 600 800 9739 nm Acetate BSA 15 µM Am p lit u d e [ a .u .] 1/Wavenumber [nm] 9767 nm 1E-4 1E-3 0.01 0.1 1 10 -10 0 10 20 30 40 EO T EO T0 [n m ] BSA concentration [µM] 3.3σ Si Si O Si Si O Si NH2 Si Si O Si NH O N O O Si Si O Si NH O N O O S 1. Oxidation 2. APDMES 3. SMCC 4. Aptamer29 Figure 3
(a)
(c)
(b)
(d)
30 Captions
Figure 1. Preparation of PSi layers with increased pore size (up to 3x enlargment) and costant porosity (same etching current density) by mosaic-like nanostructured textuting of the silicon substrate. (a, b) top-view SEM images (100000X) of the silicon surface after dissolution of the PSi sacrificial layer prepared at 200 (a) and 700 mA/cm2 (b). Scale bar 400 nm. Insets in (a) and (b) provide higher magnification images (450000X) of the surface textures. Scale bar 100 nm. (c, d) AFM images of the silicon surface after dissolution of the PSi sacrificial layer prepared at 200 (c) and 700 mA/cm2 (d). (e, f) cross-section SEM images (20000X) of the of two PSi sensing layers etched with same current density value (i.e. 500 mA/cm2) starting from different mosaic-like surface textures obtained from dissolution of PSi sacrificial layers etched at 200 (e) and 700 mA/cm2 (f). Scale bar is 2.00 µm. Insets in (e) and (f) provide at higher magnification images (350000X) of the two cros-sections at their top. Scale bar is 100 nm.
Figure 2. Sketch of the four-steps protocol used for the immobilization on the inner surface of the two PSi interferometers, with smaller and larger pores, of aptamer probes able to selectively capture TNFα protein. (a) Cartoon of the columnar-like structure of as-prepared PSi sensing layers. (b) Protocol steps, (b-1) thermal oxidation, (b-2) silanization with APDMES, (b-3), linking of SMCC, and (b-4) aptamer binding. (c) FFT amplitude spectra of as-made PSi interfetometer (black trace) as well as after thermal oxidation (red trace), silanization (green trace), and aptamer binding (blue trace) steps. Position of the peak value represents the effective optical thickness (EOT) used for the accomplishment of the functionalization protocol. (d) Fluorescence microscopy images acquired for the aptamer-functionalization protocol using a fluorescein-labeled aptamer. This allows confirming successful aptamer binding to SMCC via standard fluorescence microscopy.
31
Figure 3. Calibration curves of PSi interferometers with larger and smaller pores obtained through IAW reflectance spectroscopy. (a) Reflection spectra acquired in PBS (black line) and after injection of TNFα 78.5 nM (red line). (b) Spectral interferograms obtained from (a) for PBS (black line, reference interferogram) and TNFα 78.5nM (red line). (c) IAW signals (calibration curves) obtained over the whole range of TNFα concentrations tested (3-390 nM) for PSi interferometers with smaller (black line) and larger (red line) pores, after removal of the blank IAW0 value in PBS. Blue cross in (c) is the IAWTNFα-IAW0 signal obtained for TNFα 78.5 nM. This test is performed on PSi interferometer with larger pores after calibration, so as to estimate analytical accuracy of the experimental calibration curve. Green triangle in (c) is the IAWpepsin-IAW0 signal recorded for pepsin 390 nM. This test is performed to investigate selectivity in detection of the anti-TNFα aptamer/TNFα protein pair. Gray region represents the 3σIAW0 noise level. (d) Calibration curve over the whole range of tested TNFα concentrations obtained using EOT values as output signal for PSi
interferometers with smaller (black dots) and larger (red dots) pores. This allows to directly compare EOT and IAW changes resulting from TNFα injection in the two PSi interferometers. Gray region represents the 3σrEOT0 noise level.
32 Table of Content