Underweighting Rare Events in Experience Based Decisions:
Beyond Sample Error
∗Greg Barron†and Giovanni Ursino‡ May 17, 2013
Abstract
Recent research has focused on the “description-experience gap”: while rare events are overweighted in description based decisions, people tend to behave as if they underweight rare events in decisions based on experience. Barron and Erev [2003] and Hertwig, Barron, Weber, and Erev [2004] argue that such findings are substantive and call for a theory of decision making under risk other than Prospect Theory for decisions from experience. Fox and Hadar[2006] suggest that the discrep-ancy is due to sampling error: people are likely to sample rare events less often than objective probability implies, especially if their samples are small. A strand of pa-pers has responded examining the necessity of sample error in the underweighting of rare events. The current paper extends the results of such contributions and further strengthens the evidence on underweighting. The first experiment shows that the discrepancy persists even when people sample the entire population of outcomes and make a decision under risk rather than under uncertainty. A reanalysis of Barron and Erev[2003] further reveals that the gap persists even when subjects observe the expected frequency of rare events. The second experiment shows that the gap exists in a repeated decision making paradigm that controls for sample biases and the “hot stove” effect. Moreover, while underweighting persists in actual choices, overweight-ing is observed in judged probabilities. The results of the two experiments strengthen the suggestion that descriptive theories of choice that assume overweighting of small probabilities are not useful in describing decisions from experience. This is true even when there is no sample error, for both decisions under risk and for repeated choices.
∗We would like to thank Jonathan Baron, Craig Fox and two reviewers for helpful comments. †Harvard Business School.
‡Catholic University of Milan. This paper was written while the author was fellow at the Department
JEL Classification Numbers: D81, C91
Keywords: Experience-based decisions, Prospect Theory, rare event, overweight-ing, underweighting
1
Introduction
A person in need of serious surgery must consent to undergo general anesthesia. In the days prior to the planned operation the scared patient googles for the associated risks and discovers that the number of deaths as a result of general anesthesia has reached the stunning figure of 5.4 deceased per 100,000 patients.1
Panicking, the patient calls the anesthesiologist for reassurance and. The doctor points out that 0.0054% is an extremely small chance and that he would no doubt take it if he was in need of such an intervention. Nevertheless, the patient seriously considers foregoing the operation altogether. The anesthesiologist can’t but remind himself that patients are really too concerned about anesthesia and that such an overreaction doesn’t add up with his longstanding practice!
Why do we observe so different reactions to the same risk? One immediate observation is that the information about the odds involved is received in two very different forms: while the patient evaluates a description of the problem at hand, the anesthesiologist evaluates the same chances based on his experience as a medical doctor. There appears to be a remarkable difference in the way people take risky decisions depending on whether the information they receive is gathered through experience or via a description of the problem.
Several recent papers have focused on the description-experience gap, the ob-servation that while people tend to overweight small probabilities in decisions from description, they appear to underweight small probabilities in decisions from ex-perience. Fox and Hadar [2006] note that, in Hertwig et al. [2004], behavior that appears to reflect underweighting can be explained by a statistical bias generated
1The figure is for France in 2006, seeLienhart, Auroy, P´equignot, Benhamou, Warszawski,
by short samples, which we call “sampling error”: it follows from the binomial distribution that, when the sample is small, people are more likely to under-sample rare events then to over-under-sample them. They also demonstrate that the two-stage choice model (Fox and Tversky[1998]) — that assumes that choice can be predicted from estimated probabilities — can account forHertwig et al.[2004]’s finding when observed frequencies are used instead of the underlying probabilities. Several papers, reviewed byHertwig and Erev[2009], have examined the usefulness of the view advanced byFox and Hadar[2006] in explaining underweighting of rare events beyond the Hertwig et al.[2004] paradigm. Taken altogether, they have es-tablished that the gap is not just a statistical phenomenon. Our main goal with this paper is to strengthen this finding introducing a design where decisions from experience are taken under risk, whereby previous contributions deal exclusively with uncertainty. Secondly, we investigate further the link between probability judgment and the experience-description gap observed in choices.
As Fox and Hadar [2006] point out, while decisions from description are deci-sions under risk (as the lotteries are known) decideci-sions from experience are often decisions under uncertainty when the lotteries are represented as unlabeled but-tons.2 Underweighting of rare events has been observed in two different paradigms under uncertainty. In the first, Repeated Decision Making (as in Barron and Erev [2003]; Erev and Barron [2005]), people repeatedly choose between two un-marked buttons, each representing a static lottery. After each choice one outcome is drawn from the chosen distribution and is added or subtracted from the subject
2To make things clear, in the present paper we adopt the distinction between risk and
un-certainty made byKnight [1921]. Risk holds whenever outcomes and odds are known for sure or measurable with a reasonable effort, while (Knightian) uncertainty holds when outcomes and probabilities are not knowable with certainty.
earnings. In the second paradigm, Free Sampling (as in Hertwig et al.[2004]), two unmarked buttons again represent static lotteries. However, subjects only make a single choice between the two options. Before they choose, subjects are allowed to sample outcomes from the two buttons as often as they wish without incur-ring actual gains or losses. Once satisfied with their search, subjects make a single choice and one outcome is drawn from that button’s associated distribution. These two paradigms, while different from each other, have in common the incremental acquisition of information over time about the underlying lotteries. Additionally, both paradigms demonstrate decision making under knightian uncertainty. They do not constitute decisions under risk since, no matter how many outcomes are sampled, there will be heterogeneous beliefs about the underlying distributions that remain unknown (Fox and Hadar [2006]).
This paper contributes to the existing literature on the description-experience gap in two main ways: as the underweighting of rare events has been observed in both the repeated choice paradigm and the free sampling paradigm we examine whether or not one can observe this phenomenon without statistical sampling error in both contexts.
First, in Experiment 1 we introduce a version of the sampling paradigm that specifically examines decisions under risk, where the underlying choice distribu-tions become known through the sampling process. This paradigm allows us to examine not only the predictions of the two-stage model, but also those of Prospect Theory since the decisions are made under risk.3 A similar study is that of Hau, Pleskac, Kiefer, and Hertwig[2008], where subjects are forced to sample 100 times two decks of cards with replacement. Because of replacement, however, their
subjects make a decision under uncertainty and their beliefs about the underlying lotteries are let free. A second study along these lines is that ofUngemach, Chater, and Stewart [2009] where subjects are forced to sample 40 times two unmarked buttons: the underlying samples are representative of the true lotteries, i.e. they are artificially unbiased, but this feature is not known to subjects. Thus, again, beliefs about the underlying lotteries are let free and the decision is under uncer-tainty while in our study we constraint beliefs and induce decisions under risk. Finally, Camilleri and Newell[2011a] propose a design which allows for both unbi-ased and free sampling: in this way the authors avoid the consequences of forcing long samples such as attention failures, short memory, etc., thereby attenuating recency problems. However, as in previous works, the decisions they study are decisions under uncertainty.
Secondly, we turn to the repeated choice paradigm. Here, in line with most of the literature, we study decisions under uncertainty. We first run a re-examination of the repeated choice data fromBarron and Erev[2003] while controlling for sam-ple error. Then, in Experiment 2 we examine a repeated choice task designed to be free of sampling error where we additionally collect frequency judgment data. In this way we can check whether underweighting is explained by underestima-tion of small probabilities as suggested by Fox and Hadar [2006]. Evidence in favor of the underweighting of rare events within the repeated choice paradigm has been recently provided by Jessup, Bishara, and Busemeyer [2008]. In their study, however, subjects are informed about stakes and probabilities before they start choosing so that there is no sampling4, which is a main ingredient of our
4By sampling we mean “imperfectly” learning the characteristics of a probability distribution
through the observation of a certain number of events from that distribution. From the Merriam-Webster’s definition — referred to populations rather than probability distributions — sampling
paper — but rather repeated choice between known bets. Camilleri and Newell
[2011b] study the difference between sampling and repeated choice paradigms and find strong evidence of underweighting only in the latter. As to the judgment issue, Ungemach et al. [2009] analyze judgment data from the sampling paradigm mentioned above. Their finding is that judgment is accurate, i.e. it is consistent with choice behavior; we find, instead, that it is biased towards overweighting. In both cases it does not explain underweighting in choices. The results of the two experiments and the new analysis of past data all demonstrate the underweighting of rare events in decisions from experience, i.e., the description-experience gap, even in the absence of statistical sample error. These results suggest that sam-ple error, while being sufficient for the observed underweighting in Hertwig et al.
[2004], is not necessary for underweighting to occur in decisions form experience. The results remain consistent withHertwig et al. [2004]’s explanation that under-weighting is due to over reliance on small samples drawn from memory (Kareev
[2000]; Barron and Erev [2003];Erev and Barron [2005]; Hertwig et al. [2004]). We should note that other studies found underweighting of rare events em-ploying different paradigms under which full information about probabilities and payoffs was given. Yechiam, Barron, and Erev [2005] present a repeated choice task between known lotteries. Yechiam and Busemeyer [2006] add information about foregone payoffs. While both studies observe underweighting of rare events, neither corrects for sampling bias, a crucial point of the present paper.
Finally, a recent work by Abdellaoui, L’Haridon, and Paraschiv [2011] has in-vestigated the experience-description gap within the Prospect Theory framework, is “the act, process, or technique of selecting a representative part of a population for the purpose of determining parameters or characteristics of the whole population.” Thus, if a subject knows ex-ante the parameters of the probability distribution he takes draws from, he is not sampling.
trying to elicit weighting functions for both description and experience based deci-sions. While they find no evidence of unedrweighting of rare events in experience based decisions, their data confirm the gap for lotteries in the gains domain and, importantly, for a larger set of decision problems than that ofHertwig et al.[2004]. Again, sampling error is not accounted for in Abdellaoui et al.[2011].
2
Experiment 1:
decisions under risk using a
sampling paradigm
Sampling error plays a role in the “free sampling” paradigm due to the paradigm’s uncertain nature. No matter how many outcomes are sampled, beliefs will remain heterogeneous as to the underlying distribution. One way to control for this, that we explore here, is to employ sampling without return from a finite population. In other words, the decision maker gets to see all the outcomes one at a time. Once the entire population of outcomes has been sampled the decision maker has full information about the prospects’ outcomes and their likelihoods. Any choice based on this information (about drawing a single outcome form two such populations) will be a decision under risk.5 If the description-experience gap is indeed driven by sample error, it should not be observed when the entire population has been exhaustively sampled. Alternatively, if the over reliance on small samples drawn from memory plays a significant role in decisions from experience, a gap should still be observed.
5In our design there is no ambiguity because payoffs are known with certainty and the
information necessary to calculate odds is provided. Yet we acknowledge that there may be some uncertainty for those subjects who did not keep a tally while sampling, resulting in a poor estimation of the true probabilities. In other words, beliefs are not free up to wrong probability estimation during the sampling stage.
2.1
Method
One hundred twenty one students of the Boston area served as paid volunteers in the experiment. Students were at the undergraduate or graduate school level and came from local universities (Harvard, Boston University and Boston College).
During each session participants went through two within-subjects conditions, “10%” and “20%”, that were identical with the exception of the risky lottery. The order of the two conditions was randomized. Each condition consisted of two phases.6 In the first phase, described below, we identified a pair of lotteries for which the participant was indifferent and in the second phase the participant made a single choice between the lotteries. The choice was made either from Description or from Experience (our two between-subjects conditions). Table 1 shows the overall design of the experiment. Participants were paid according to one of the four phases they went through, randomly chosen at the end of the experiment. Participants also received a $10 show up fee and the average total payment was $27.20.
TABLE 1
Phase 1 was a sequential procedure7 meant to elicit the value of X for which
participants were indifferent between the relatively safe (S) and risky (R) lotteries below:
6Notice that each phase of each condition was referred to as Experiment 1, 2, 3 or 4 in the
framing of our experiment, so that subjects did not see a logical connection between the phases of the overall design and perceived them as independent experiments. We use the terms Phases and Conditions here to clarify the logical structure of our design to the reader.
7This procedure echoes the procedure proposed byBecker, DeGroot, and Marschak [1964]
with the notable difference that in our experiment the indifference point is not reported directly but through a chain of decisions where we manipulate the value of X. A much closer method is the Bisection procedure employed by Abdellaoui et al. [2011], i.e. a series of binary choice questions designed to elicit certainty equivalents.
• S:($X, 0.9; 0) or R:($40, 0.1; 0) in Condition 10% • S:($X, 0.8; 0) or R:($20, 0.2; 0) in Condition 20%
The probabilities of 0.1 and 0.2 were chosen keeping with the values for which over and underweighting are typically observed in decisions from description and from experience. To arrive at the point of indifference, X indiff, each participant sequentially chose between pairs of lotteries, as above, with alternative values for X. The payoff X randomly started out at either 0 or 40 (0 or 20 for condition 20%) and then increased by half the range if R was preferred and decreased by half the range otherwise. After the thirteenth choice we were able to identify the implied indifference point for each subject.8
In an effort to make the sequential procedure as much incentive compatible as possible, we have employed a Random Lottery Incentive System: participants were told that their Phase 1 payoff would be an outcome drawn from their preferred lottery in a randomly selected pair, chosen from the 13 pairs they were presented with. The outcome was not shown until the end of entire session.9
We employed the sequential procedure described above in an effort to control for heterogeneity in preferences for risk. Thus, any difference in choices in the next
8Notice that in Phase 1 of each Condition (referred to either Experiment 1 or Experiment 3
in the framing of the experiment) subjects were simply asked to choose between the prospects they were presented. In particular, they were not told in any way that the procedure was meant to elicit an indifference point or, for that matters, that it was itself a procedure to achieve any goal. Almost surely nobody understood what we were after.
9For an excellent discussion of merits and limitations of such incentive schemes see Holt
[1986] andStarmer and Sugden[1991]. In particular notice that two of the necessary conditions for Holt’s critique to apply — (i) that subjects treat a random-lottery experiment as a single choice problem and (ii) that compound lotteries are reduced to simple ones by the calculus of probabilities — do not apply here because (a) instructions and framing of the experiments strongly attenuated the link between Phase 1 of each experiment and the payment stage; and, more importantly, (b) the probability of each pair being selected at the payment stage could not be calculated ex-ante.
phase can only be traced to the difference in the experience/description conditions in Phase 2 and will not be influenced by pre-existing preferences over particular lotteries. Put differently, Phase 1 filters out individual risk attitudes and let us concentrate on the experience vs. description effect.
In Phase 2 of each within condition participants were randomly allocated to a Description or an Experience condition, and made an actual decision between the gambles ($X indiff - 2¢, 0.9) and R:($40, 0.1) — or ($X indiff -2¢, 0.8) and R:($20, 0.2) for condition 20%. We subtracted 2 cents from X indiff as an additional precaution to avoid participants feeling committed to their previously indicated indifference point. We did not expect such a small amount to have a large effect on the choices in Phase 2 although it arguably induces a preference for the risky lottery.10 While we did our best to break the link between Phases 1 and 2 of each experiment and we are confident that decisions taken in Phase 1 had little bearing on those taken in Phase 2, we nonetheless recognize that this may be a limitation of our design.
Participants in the Description condition made a single choice between the two prospects that were described as in the previous paragraph. In the Experience condition participants were not shown the lotteries. Instead, they were presented with two unmarked buttons and were told that they corresponded to two boxes containing 100 balls each. Each ball was marked with one of only two possible outcomes for each box. They were then instructed to sample from each box (by clicking on the two buttons in any order they desired) all the balls and to observe their values, one by one until both boxes were empty. The boxes would then be
10Thus, while addition would have been in favor of the gap, by subtracting we play, if any,
refilled with the same balls and they would choose a box from which to draw a single ball for real money. They were provided with paper and pencil and could keep a tally throughout the experiment if they wished. After sampling all the outcomes subjects made a single choice based on their experience of the two distributions. Subjects did not receive feedback on the outcome until the end of the entire session. After both Phase 1 and 2 were completed, the procedure was repeated for the experiment not yet completed (10% or 20%). When all data collection had been completed subjects were shown their outcomes for Phases 1 and 2 of experiments A and B. Each outcome was a draw from the participants selected lottery for that phase (randomly selected among the thirteen pairs of the sequential procedure for Phase 1). One of these four outcomes was randomly chosen for the participants’ payoff. This rule allowed us to reduce incentive problems in the chained procedure of Phase 1 while keeping the experiment financially affordable.
2.2
Results
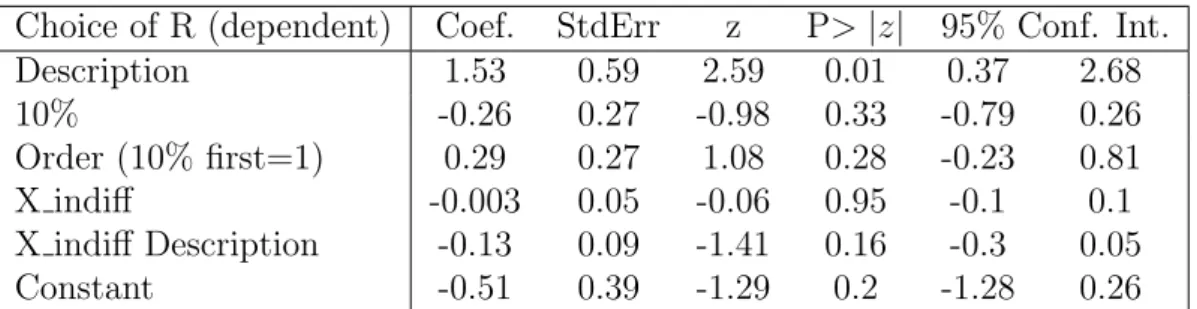
Table 2 shows the mean choice of the risky lottery R in all 4 conditions. Aggre-gating over both 10% and 20%, the proportion of Risky choices in the Experience condition (38%) was significantly lower than in the Description condition (56%) (β = 1.53, z=2.59, p<0.01, first row in logistic regression of Table 3). There was no significant difference between conditions 10% and 20% nor was there an effect of the order the conditions were presented or of the indifference point selected by the participant (rows 2-4 of Table3, all non significant). This result is consistent with the description-experience gap and implies underweighting of the rare event in a decision under risk and in the absence of sampling error. Notice further that most
subjects in the Experience condition took a tally of the balls sampled, confirming that there was little if at all ambiguity or uncertainty in the experiment.
TABLE 2
TABLE 3
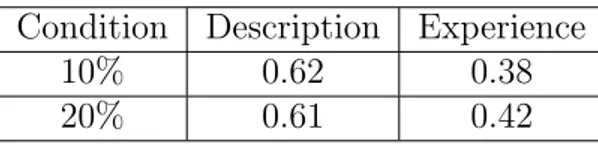
Table 4reports the proportion of choices correctly predicted by Prospect The-ory in all the conditions. The prediction was calculated per each subject using the parameters estimated in Tversky and Kahneman [1992] and the (modified) X indiff taken from the sequential procedure of Phase 1. The prediction was then compared to that subject’s behavior. While this is not a direct test of the theory11, the comparison suggests that Prospect Theory is more useful in predicting the de-cisions from description than those from experience even though both dede-cisions were decisions made under risk.
TABLE 4
2.3
Remarks
A couple of remarks on Experiment 1 are in order. First, the sequential procedure in Phase 1 employs description based decisions to reach an indifference point. While we can safely argue that subjects should be close to indifference in Phase 2 of the Description condition, the argument is weaker in the Experience condition because the format for eliciting the indifference point and the decision format are different. Still, while it would be difficult to implement an analogous sequential
11Experiment 1 is a proper test of Prospect Theory if we assume i ) the two-stage model,
ii ) judged probabilities are accurate and iii ) no ambiguity aversion. We thank Craig Fox for pointing this out.
procedure within an experience format, it remains an interesting topic for future studies focused on the asymmetry.
Secondly, in Phase 2 of the experiment, subjects are asked to express a pref-erence about two lotteries they value as (close to) indifferent by Phase 1. This may increase the volatility of decisions. On average, however, there is no reason to believe that choices should be biased in a particular direction. Moreover, in the Experience condition, because of sampling, there is a longer time lapse between indifference elicitation and choice. This, we think, should mitigate the volatility problem without biasing decision in a particular way.
3
Repeated choice vs. free sampling
Less clear is the role of sampling error in the repeated choice paradigm. The paradigm is arguably quite prevalent in real life settings where we learn from the outcomes of our previous choices and most learning models have been developed with the explicit goal of understanding this process. While sampling per se is not an issue in this paradigm, since outcomes are incurred and not merely sampled, the statistical phenomenon of sampling error and its effect on decision making remain an issue.
Simple learning models of repeated choice predict that underweighting of rare events will occur due to an over reliance on small samples (Barron and Erev[2003];
Erev and Barron [2005]) and/or due to the “hot stove” effect (Denrell and March
[2001]) where a bad outcome decreases choice from the same distribution again in the future. In both cases, while the models predict that sample error can increase the apparent underweighting of rare events, they also predict that underweighting
will persist even in the absence of sampling error.12 The remainder of this
pa-per examines this hypothesis in both a reanalysis of the Barron and Erev [2003] repeated choice data and a laboratory experiment.
3.1
Revisiting the Barron and Erev (2003) data
If sample error is the prime mechanism driving the gap between experience and description based decisions, the gap should disappear when we examine subjects who observed the rare event approximately the expected number of times. To evaluate this assertion we identified the six problems studied by Barron and Erev
[2003] for which the analysis is relatively straight forward. In that study subjects chose 400 times between two unmarked buttons each yielding a draw from the corresponding lottery. Subjects obtained immediate payoff feedback on the chosen option only. The six lottery pairs, and their problem number from theBarron and Erev [2003] paper, appear in Table 5. Each pair includes one risky two-outcomes lottery and one safe certain-outcome lottery. The lottery with the higher expected value (H) appears in second column and the lottery with the lower expected value (L) appears in the third column. The fourth column shows the proportion of H choices aggregated over subjects and over 400 trials. As noted inBarron and Erev
[2003], behavior in each of the problems is consistent with underweighting of the rare event and is inconsistent with Prospect Theory (assuming the parameters estimated in Tversky and Kahneman [1992]).
To examine the behavior of those subjects whose observed sample of outcomes
12Notice that a decision maker may stop choosing from a gamble after having experienced a
bad loss — the hot stove effect — and, at the same time, may have observed up to that point a sample biased in either direction or even unbiased. Put differently, the hot stove effect is related to, but does not imply undersampling.
was relatively unbiased we first computed, for each individual, the observed fre-quency of the rare event in the risky lottery. We then removed all subjects whose observed frequency of the rare event was greater or less then one standard devia-tion from the expected frequency. The remaining number of subjects appears in the right most column of Table 5: we filtered out of the original data set about half of the subjects.13
TABLE 5
As shown in column 5 of the table, in four of the six problems the proportion of H choices in the restricted data set did not change significantly. In two of the six problems, 8 and 9, the less biased subjects chose H significantly more often. However, even in these two problems the choice of the modal subject was the same as that in the unrestricted data set (i.e., they continued to choose L most of the time).
In summary, the reanalysis of the repeated choice paradigm in Barron and Erev (2003) confirms that what appears to be underweighting of rare events is not the result of sample error. Even when observed outcomes approximate ac-tual distributions, behavior remains consistent with the underweighting of small probabilities.
Three shortcomings of the above analysis need to be addressed. First, the analysis performed was not particularly sensitive. Observed frequencies of the rare event still fluctuated in the +1/-1STD range for individual subjects, each of
13The fact that many subjects observed outcome strings quite different from those one would
expect given the underlying lotteries, may be due to the already mentioned hot stove effect as well as to the fact that, under repeated choices, exploration is costly when a rare higher outcome is preceded by a long string of lower scores.
whom was incurring a different stream of payoffs from choosing safe and risky op-tions. Secondly, the stream of observed payoffs was path dependent since subjects only observed the outcome from the chosen option (i.e., forgone payoffs were not observed). Underweighting in this case can be the result of the “hot stove effect” which effectually leads to a biased sample as people cease to choose an option after an unlucky streak of bad outcomes. Thirdly, subjects were not asked to estimate the probability of the rare event. Thus, we still don’t know if any judgment er-ror has occurred and cannot directly test the predictions of the two-stage choice model that uses estimations to predict choice. We address all these limitations in an experiment using the repeated choice paradigm where all subjects observe the same stream of incurred and forgone payoffs. Additionally, the complete stream of payoffs is representative of the underlying payoff distributions and we elicit probability judgments of the rare event.
3.2
Experiment 2: repeated choice and judgment
3.2.1 Method
Each subject in the study performed both a binary choice task and a probability assessment task. The binary choice task was performed under uncertainty one hundred times (with immediate feedback on both obtained and forgone payoffs) with the probability assessment task following each choice in rounds 51-100. Upon completion, participants performed a one-time retrospective probability assess-ment task.
In the binary choice task, participants chose between two unmarked buttons presented on the screen. Each button was associated with one of two distributions
referred to here as S (for safe) and R (for risky). The S distribution provided a certain loss of 3 points while the R distribution provided a loss of 20 points with probability 0.15 and zero otherwise. Thus, the two distributions had equal expected value and the exchange rate was 100pts = 1 Shekels (about 29 US cents). To assure that all subjects experienced the same representative sequence of outcomes we first produced random sequences of 100 outcomes and the first se-quence with an observed frequency of 0.15 for the -20 outcome was used for all participants. The sequence provided the -20 outcome on rounds 12, 15, 19, 20, 21, 23, 25, 35, 40, 41, 60, 73, 80, 87, and 96.
In the probability assessment task, performed after each binary choice in tri-als 51-100, participants were prompted to estimate the chances (in terms of a percentage between 0 and 100) of -20 appearing (on the R button) on the next round.
After completing 100 rounds participants were asked to estimate (“end-of-game estimates”), to the best of their recollection, two conditional subjective probabil-ities (SP): (1) the chances of -20 appearing after a previous round with a -20 outcome [SP(-20|-20)] and (2) the chances of -20 appearing after a previous round with a 0 outcome [SP(-20|0)].
Twenty-four Technion students served as paid subjects in the study. Most of the subjects were second and third year industrial engineering and economics majors who had taken at least one probability or economics course. In addition to the performance contingent payoff, described above, subjects received 28 Shekels for showing up. The final payoff was approximately 25 Shekels (about 5 US dollars). Subjects were informed that they were operating a “computerized money ma-chine” but received no prior information as to the game’s payoff structure. Their
task was to select one of the “machine’s” two unmarked buttons in each of the 100 trials. In addition, they were told that they would be asked, at times, to estimate the likelihood of a particular outcome appearing the following round. As noted above, this occurred in trials 51-100.
Subjects were aware of the expected length of the study (10-30 minutes), so they knew that it included many rounds. To avoid an “end of task” effect (e.g., a change in risk attitude), they were not informed that the study included exactly 100 trials. Payoffs were contingent upon the button chosen; they were produced from the predetermined sequence drawn from the distribution associated with the selected button, described above. Three types of feedback immediately followed each choice: (1) the payoff for the choice, which appeared on the selected button for the duration of 1 second, (2) payoff for the forgone option, which appeared on the button not selected for the duration of 1 second and (3) an update of an accumulating payoff counter, which was constantly displayed.
3.2.2 Results
The mean probability assessment from trials 51-100, aggregated over trials and over subjects, was 0.27. This value is significantly larger than 0.163, the mean running average of the observed probability of the -20 outcome (t[23] = 3.11, p <.01). Thus, the results reflect overestimation of the rare event.14
14One may be concerned that two thirds of the occurrences of the rare event are in the first
half of the series (see Section 3.2.1). On the one hand this may cause the build up from the beginning of a high probability weight on the rare event leading to the observed overestimation; on the other hand, though, the probability judgment was performed in the trials of the second half and at the end of the series, after a sequence of stimuli where the rare event occurred indeed less often. Reliance on small samples from memory (recency) leads us think that, if any, the uneven distribution of rare events in the series should bias the judged probabilities towards underestimation rather than overestimation.
As shown in Table 6, participants’ aggregate proportion of R choices was 0.74 (significantly larger than 0.5, t[23] = 7.47, p <.001). This result is consistent with the assertion of underweighting of rare events in choice. The rate of R choice over trials 51-100 was 0.80 (significantly larger than 0.5, t[23] = 6.78, p <.001).
TABLE 6
Comparison of the judgment and the choice data for trials 51-100 is incon-sistent with the hypothesis that underweighting may be caused by misjudgment. While subjects’ choices are consistent with underweighting the rare event, they consistently overweighted the rare event in their probability estimations. While the objective probability of the rare event was 0.15 and its mean observed pro-portion (recalculated after each trial) was 0.16, subjects mean estimation was 0.27 reflecting significant overweighting. This pattern cannot be predicted by the two stage choice model that applies Cumulative Prospect Theories weighting func-tion.15 Applying that function, which assumes overweighting of small probabilities,
to the objective, the observed or the estimated probabilities leads to a prediction of overweighting in choice, and not underweighting as was observed.
In order to confirm that the different reactions occur at the level of individual subjects a pair-wise within-subjects analysis was performed. For 63% (15/24) of the participants, assessment and choice results were not consistent in terms of the implied weighting of the -20 outcome: in all these cases we have observed
15There are parameters for which Prospect Theory’s weighting function will imply
under-weighting of rare events. However, such parameterization is a contradiction to the fourfold pattern of risk attitudes observed in decisions from description. It is this pattern that the model was offered to elegantly quantify in the first place. As Craig Fox pointed out “Technically, the two-stage model could accommodate the pattern reported if the weighting function is depressed for this domain of uncertainty — i.e. if there is ambiguity seeking for losses”, which, however, is a strong assumption.
overestimation and underweighting of rare events at the same time.
4
Discussion
This paper offers two main contributions to the existing literature and a method-ological innovation. With the first contribution we address the issue of sampling bias in the “free” sampling paradigm of Hertwig et al. [2004] using for the first time a design where experience-based decisions are taken after sampling under risk rather than uncertainty — as is the case in the studies appeared to date (Hau et al.[2008],Ungemach et al.[2009],Camilleri and Newell[2011a,b]). We examine the hypothesis that decisions reflecting the underweighting of rare events may be the result of a sampling bias due to reliance on small samples. As Hertwig et al.
[2004] point out, when samples are small rare events are more likely to be under sampled than oversampled due to the skewness of the binomial distribution. To see if sample error is a necessary condition for underweighting to occur, we present two experiments and one re-analysis of past data that control for, or eliminate the possibility of sample error. In all three data sets behavior continued to be con-sistent with the underweighting of rare events in decisions form experience. In particular, while the reanalysis and Experiment 2 confirm underweighting when decisions are taken under uncertainty, Experiment 1 extends the result to the case of experience based decisions taken under risk. This paper’s first contribution is in showing that while sample error may be sufficient for implied underweighting to occur, it is clearly not a necessary condition, even in the absence of uncertainty. The findings shed also some light on the distinction between decisions form experience and from description. It is tempting to classify the former as a decision
under uncertainty and the latter as a decision under risk. However, in Experiment 1 we examine a hybrid paradigm where a decision from experience is taken under risk as all the outcomes and their frequencies were known by the decision maker. The significant description-experience gap that was observed is inconsistent with models that assume overweighting of rare events under risk (i.e., Prospect Theory). The second major contribution of the paper regards judgment. Once sam-pling bias is accounted for, a remaining possibility is that people are making a judgment error, even if the sample is unbiased, and are underestimating the rare event. Experiment 2 examined this possibility by eliciting probability estimates throughout the experiment. While there was indeed a judgment error, it was in the opposite direction. Contrarily to whatUngemach et al.[2009] reported, people in our study were overestimating the rare event while their choices (within sub-ject) reflected underweighting. Again, this pattern of results cannot be predicted by models that assume Prospect Theory’s weighting function such as the Two-stage choice model (Fox and Tversky[1998]). Overweighting of estimations (e.g.,
Viscusi [1992]; Erev, Wallsten, and Budescu [1994]) and underweighting in choice have both been demonstrated in other research, but never concurrently and within subject. While we find this pattern intriguing, we do not have a clear explanation for it. Indeed, we believe the connection between judgment and choices deserves further investigation.
Finally, the methodological innovation (Experiment 1) consists in using a se-quential procedure to filter out idiosyncratic preferences prior to the “actual” ex-periment. With this technique we guarantee that different choice patterns can be solely attributed to relevant design features like the mode of presentation. The use of this procedure has been for us an experiment within the experiment and
we believe it has made our results cleaner. We also believe that the use of simi-lar filtering techniques may be helpful in those very common settings where risk attitudes have a decisive impact on choices and may interact with relevant design characteristics.
Decisions from experience remain qualitatively different than decisions from description in ways beyond subjects’ tendency to under sample lotteries, as was the case inHertwig et al. [2004] sampling paradigm. All the data presented in the current paper are consistent with the assumption that decisions from experience rely on small samples drawn from memory and can be described by simple learn-ing and sampllearn-ing models that quantify this assumption. Interestlearn-ingly, however,
Rakow, Demes, and Newell [2008] have founded that underweighting disappears when subjects do not actively sample the lotteries but rather are passively ex-posed to sampling. This last finding calls for future research to dig deeper into uncovering the nature and causes of underweighting of rare events in experience based decisions as well as to better understand and define what we mean by “ex-perience”. Efforts in this direction have been made (see e.g. Erev, Glozman, and Hertwig [2008] and Hau, Pleskac, and Hertwig [2010]) but more remains to be done.
References
Mohammed Abdellaoui, Olivier L’Haridon, and Corina Paraschiv. Experienced vs. Described Uncertainty: Do We Need Two Prospect Theory Specifications? Management Science, 57(10):18791895, October 2011.
Greg Barron and Ido Erev. Small feedback-based decisions and their limited corre-spondence to description-based decisions. Journal of Behavioral Decision Mak-ing, 16:215–233, 2003.
G. M. Becker, M. H. DeGroot, and J. Marschak. Measuring utility by a single-response sequential method. Behavioral Science, 9:226–232, 1964.
Adrian R. Camilleri and Ben R. Newell. Description- and experience-based choice: Does equivalent information equal equivalent choice? Acta Psychologica, 136: 276–284, 2011a.
Adrian R. Camilleri and Ben R. Newell. When and why rare events are under-weighted: A direct comparison of the sampling, partial feedback, full feedback and description choice paradigms. Psychonomic Bulletin & Review, 18:377–384, 2011b.
Jerker Denrell and J. G. March. Adaptation as information restriction: The hot stove effect. Organization Science, 12:523–538, 2001.
Ido Erev and Greg Barron. On Adaptation, Maximization, and Reinforcement Learning Among Cognitive Strategies. Psychological Review, 112(4):912–931, October 2005.
Ido Erev, T. S. Wallsten, and D. V. Budescu. Simultaneous over- and under-confidence: the role of error in judgment processes. Psychological Review, 101: 519–527, 1994.
Ido Erev, Ira Glozman, and Ralph Hertwig. What impacts the impact of rare events. Journal of Risk and Uncertainty, 36:153–177, 2008.
Craig R. Fox and Liat Hadar. “Decisions from Experience”=Sampling Er-ror+Prospect Theory: Reconsidering Hertwig, Barron, Weber & Erev (2004). Judgment and Decision Making, 1:159–161, 2006.
Craig R. Fox and Amos Tversky. A Belief-Based Accound of Decision Under Uncertainty. Management Science, 44:879–895, 1998.
Robin Hau, Timothy J. Pleskac, J¨urgen Kiefer, and Ralph Hertwig. The Description-Experience Gap in Risky Choice: The Role of Sample Size and Ex-perienced Probabilities. Journal of Behavioral Decision Making, 21:1–26, 2008. Robin Hau, Timothy J. Pleskac, and Ralph Hertwig. Decisions From Experience and Statistical Probabilities: Why They Trigger Different Choices Than a Priori Probabilities. Journal of Behavioral Decision Making, 23:48–68, 2010.
Ralph Hertwig and Ido Erev. The description-experience gap in risky choice. Trends in Cognitive Science, 13:517–523, 2009.
Ralph Hertwig, Greg Barron, Elke U. Weber, and Ido Erev. Decisions from expe-rience and the effect of rare events in risky choices. Psychological Science, 15: 534–539, 2004.
Charles A. Holt. Preference Reversals and the Independence Axiom. American Economic Review, 76(3):508–515, June 1986.
Ryan K. Jessup, Anthony J. Bishara, and Jerome R. Busemeyer. Feedback Pro-duces Divergence From Prospect Theory in Descriptive Choice. Psychological Science, 19(10):1015–1022, 2008.
Yaakov Kareev. Seven (indeed, plus or minus two) and the detection of correla-tions. Psychological Review, 107(2):397–402, April 2000.
Frank H. Knight. Risk, Uncertainty, and Profit. Boston: Houghton Mifflin Co., 1921.
Andr´e Lienhart, Yves Auroy, Fran¸coise P´equignot, Dan Benhamou, Josiane Warszawski, Martine Bovet, and Eric Jougla. Survey of Anesthesia-related Mor-tality in France. Anesthesiology, 105(6):1087–1097, December 2006.
Tim Rakow, Kali A. Demes, and Ben R. Newell. Biased samples not mode of presentation: Re-examining the apparent underweighting of rare events in experience-based choice. Organizational Behavior and Human Decision Pro-cesses, 2:168–179, 2008.
Chris Starmer and Robert Sugden. Does the Random-Lottery Incentive System Elicit True Preferences? An Experimental Investigation. American Economic Review, 81(4):971–978, September 1991.
Amos Tversky and Daniel Kahneman. Advances in Prospect Theory: Cumulative Representation of Uncertainty. Journal of Risk and Uncertainty, 5:297–323, 1992.
Christoph Ungemach, Nick Chater, and Neil Stewart. Are Probabilities Over-weighted or UnderOver-weighted When Rare Outcomes Are Experienced (Rarely)? Psychological Science, 20(4):473–479, Apr 2009.
W. Kip Viscusi. Smoking: Making the risky decision. New York: Oxford University Press, 1992.
Eldad Yechiam and Jerome R. Busemeyer. The Effect of Foregone Payoffs on Un-derweighting Small Probability Events. Journal of Behavioral Decision Making, 19:1–16, 2006.
Eldad Yechiam, Greg Barron, and Ido Erev. The role of personal experience in contributing to different patterns of response to rare terrorist attacks. Journal of Conflict Resolution, 49:430–439, 2005.
Table 1: Design of Experiment 1 Condition Description (between) Experience (between) 10% (within) Phase 1 and Phase 2 Phase 1 and Phase 2 20% (within) Phase 1 and Phase 2 Phase 1 and Phase 2
Table 2: Mean Choice of R Condition Description Experience
10% 0.52 0.35
20% 0.59 0.4
Table 3: Logistic Regression
Choice of R (dependent) Coef. StdErr z P> |z| 95% Conf. Int.
Description 1.53 0.59 2.59 0.01 0.37 2.68 10% -0.26 0.27 -0.98 0.33 -0.79 0.26 Order (10% first=1) 0.29 0.27 1.08 0.28 -0.23 0.81 X indiff -0.003 0.05 -0.06 0.95 -0.1 0.1 X indiff Description -0.13 0.09 -1.41 0.16 -0.3 0.05 Constant -0.51 0.39 -1.29 0.2 -1.28 0.26
Table 4: Proportion predicted by PT Condition Description Experience
10% 0.62 0.38
20% 0.61 0.42
Table 5: Barron and Erev (2003) decision problems Proportion of maximization (H) choices, P(H) Problem H (high EV) L (low EV) B&E (2003) P(H) +/- 1std. P(H)§ N (from 24)† 4 4, .8 3 0.63 0.64 10 6 -3 -4, .8 0.6 0.56 15 7 10, .9 9 0.56 0.63 20 8 -10, .9 -9 0.37 0.47* 17 9 32, .1 3 0.27 0.43* 11 11 -3 -32, .1 0.4 0.33 11 * p<0.05
§ Proportion of H choices in the unbiased subjects pool
† Number of subjects in the unbiased pool. N is 24 in the original study
Table 6: A summary of the aggregate results of Experiment 2
Statistic Trials 1-100 Trials 51-100
P(R) proportion of R choices 0.74 (0.5*)† 0.8 (0.5*)† SP(-20) Mean subjective
assessment of the probability − 0.27 (0.16*)†
of a -20 outcome *p<0.01
† The numbers in parenthesis denote the null hypotheses for the test