POLITECNICO DI MILANO
Scuola di Ingegneria dei Sistemi
POLO TERRITORIALE DI COMO
Master of Science in Management, Economics and Industrial Engineering
Antecedents of Adopting Emerging Energy
Efficient Technologies: The Case of Iran’s
Energy-‐Intensive Industries
Supervisor: Prof. Federico Frattini
Co-‐Supervisor: Marco Chiesa
Master Graduation Thesis by: Ali Samei
Student ID: 776806
© Copyright by Ali Samei, 2014.
All rights reserved
ACKNOWLEDGEMENT
It would not have been possible to write this thesis without the help and support of the kind people around me, to only some of whom it is possible to give particular mention here.
I would first like to thank my family for the love and support I have received throughout my life. Without the numerous sacrifices you have made for me over
years, I would not be what I am today.
Second, I profusely thank and express my deep sense of gratitude to my supervisors, Professor Federico Frattini and Marco Chiesa, and to my local advisor, Professor Abbas Maleki, for their helping hand without which I would
not have completed the project.
Third, I would also like to thank the numerous people in Iran and Italy without whose help this thesis would not be possible. They provide me with a tremendous amount of key anecdotal data, which were invaluable in helping me develop the various conclusion of this thesis. Specifically I thank Siavash
Farahbakhsh, Omid Maghazei, Mahdi Ghaderi and Morteza Zamanian who provided me stimulating suggestions and helped me in different phases of this research.
Finally, I would like to dedicate this thesis to my B.Sc. professor, Dr. Alireza Safikhani, who changed the course of my life and brought me to the point I am today.
ABSTRACT
The main purpose of this research is to investigate the energy efficiency adoption process in Iranian firms, which have been experiencing two shocks that are an extensive energy subsidies reform and harsh international economic sanctions. Furthermore, I examine how Iranian firms’ responses to emerging energy efficient technologies are characterized by sectoral and firm level features.
This research is built on explorative and empirical case studies. This methodology has been carefully selected to discover and examine how Iranian energy-‐intensive firms adopt and implement emerging energy efficient technologies and practices. For this purpose, I conducted semi-‐structured
interviews of energy management practices within six firms in three energy-‐ intensive industrial sectors including Cement, Metal and Petrochemical.
The results show that all six companies opted only short-‐term plans to survive from consequences of subsidies reform. Moreover, while some Iranian firms have responded to economic sanctions by purchasing lower quality energy-‐
efficient technologies, the others have burdened higher cost of technology acquisition.
Key words: Barriers to energy efficiency, Case study research, Economic sanctions, Subsidy reform, Technology adoption, Industrial energy efficiency, Energy efficiency in Iran.
Key words (Italian Language): Barriere all'efficienza energetica, la ricerca Caso di studio, le sanzioni economiche, riforma dei sussidi, l'adozione della tecnologia industriale, l'efficienza energetica, l'efficienza energetica in Iran.
Table of Contents
1 LITERATURE REVIEW ... 16
1.1 DEFINITION OF ENERGY EFFICIENCY ... 16
1.1.1 Types of Energy Efficiency Improvement ... 17
1.1.1.1 Substitution ... 17
1.1.1.2 Technical Change ... 18
1.1.2 Energy Efficiency Indicators ... 19
1.1.2.1 Economic-‐Thermodynamic Indicators ... 21
1.1.2.2 Economic Indicators ... 21
1.1.3 Economic Efficiency Vs. Energy Efficiency ... 22
1.1.4 Energy Conservation Vs. Energy Efficiency ... 23
1.1.5 Jevons’ Paradox ... 24
1.1.6 Rebound Effect, Tack-‐Back And Backfire ... 25
1.1.7 Conclusion And Implications For Next Steps ... 30
1.2 DEFINITION OF ENERGY EFFICIENCY GAP ... 33
1.2.1 Introduction ... 33
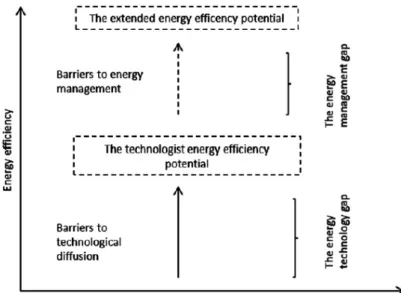
1.2.2 The Extended Energy Efficiency Gap ... 35
1.3 BARRIERS TO ENERGY EFFICIENCY ... 36
1.3.1 Introduction ... 36
1.3.2 The Blumstein et al. Taxonomy (1980) ... 37
1.3.3 The Jaffe-‐Stavins Framework (1994) ... 38
1.3.4 The Sorrell et al. Taxonomy (2000) ... 39
1.3.4.1 The economic perspective ... 43
1.3.4.2 The behavioral perspective ... 48
1.3.4.3 The organizational theory perspective ... 51
1.3.5 Cagno et al. Taxonomy (2013) ... 52
1.3.6.1 Kounetas & Tsekouras (2010) ... 54
1.3.6.2 Balachandra et al. (2010) ... 54
1.3.6.3 Levine et al. (1995) ... 55
1.3.6.4 Dyer et al. (2008) ... 55
1.3.6.5 Fleiter et al. (2012) ... 56
1.3.6.6 Sarkar & Singh (2010) ... 57
1.3.6.7 Apak et al. (2012) ... 57
1.3.6.8 Griffin et al. (2012) ... 58
1.3.6.9 De Beer et al. (1998) ... 58
1.3.6.10 Apak et al. (2012a) ... 58
1.3.6.11 De la Tour et al. (2011) ... 59
1.3.6.12 Shum & Watanabe (2009) ... 59
1.3.6.13 Klagge et al. (2012) ... 59
1.3.6.14 Løvdal & Neumann (2011) ... 60
1.3.6.15 Hirst & Brown (1990) ... 61
1.3.6.16 Brown (2001) ... 61
1.3.6.17 Brown (2004) ... 62
1.3.6.18 Summary of recent papers ... 62
1.3.7 Conclusion And Implication For Next Steps ... 64
1.4 EMERGING ENERGY-‐EFFICIENT TECHNOLOGIES ... 65
2 RESEARCH METHODOLOGY ... 70
2.1 INTRODUCTION AND RESEARCH QUESTIONS ... 70
2.2 RESEARCH APPROACH: QUALITATIVE VS. QUANTITATIVE RESEARCH ... 71
2.2.1 Creswell Research Design Framework ... 71
2.2.1.1 Step 1: Theoretical Perspective and Philosophical assumptions ... 72
2.2.1.2 Step 2: Strategy of Inquiry ... 74
2.2.1.3 Step 3: Techniques and Methods ... 75
2.2.1.4 Approaches to Research ... 76
2.2.1.5 Thesis’s Research Structure ... 77
2.3 CASE STUDY RESEARCH DESIGN ... 80
2.3.2 Step 2: Selecting Cases (And Unit of Analysis) ... 85
2.3.2.1 Iran; An Exceptional Case For Energy Efficiency Research ... 89
2.3.2.2 Selected Industries And Firms ... 133
2.3.3 Step 3: Crafting Instruments And Protocols ... 150
2.3.3.1 Interview Structure ... 151
2.3.3.2 Interview Approach ... 152
2.3.3.3 Interview Quality ... 153
2.3.3.4 Interview Partners ... 154
2.3.4 Step 4: Entering the Field ... 154
2.3.5 Step 5: Analyzing Data ... 155
2.3.6 Step 6: Shaping Hypotheses ... 158
2.3.7 Step 7: Enfolding Literature ... 160
2.3.8 Step 8: Reaching Closure ... 161
3 DATA ANALYSIS AND SUMMARY OF RESULTS ... 162
3.1 CASE STUDIES OF ENERGY EFFICIENCY BARRIERS IN THE IRANIAN ENERGY-‐INTENSIVE INDUSTRIES ... 163
3.2 EXPERIENCES FROM ADOPTED ENERGY EFFICIENCY INTERVENTIONS ... 165
3.3 ENERGY EFFICIENCY TRAINING PROGRAM IN SELECTED CASES ... 167
3.4 EVIDENCES OF IMPACTS OF SANCTIONS, SUBSIDIES REFORM AND NATIONAL STANDARDS ON ENERGY EFFICIENCY ... 168
3.4.1 Sanctions And Adoption Of Energy Efficient Technologies ... 168
3.4.2 Subsidies Reform And Adoption Of Energy Efficient Technologies ... 169
3.4.3 National Standards And Adoption Of Energy Efficient Technologies ... 171
3.5 EVIDENCES OF BARRIERS TO ENERGY EFFICIENCY ... 172
4 CONCLUSION AND SUGGESTION FOR FUTURE STUDIES ... 175
5 APPENDIXES ... 177
5.2 INTERVIEW PROTOCOL ... 179 5.3 INTERVIEWS’ TRANSCRIPTS ... 184 5.3.1 Company A ... 184 5.3.2 Company C ... 190 5.3.3 Company D ... 208 5.3.4 Company E ... 219 5.3.5 Company F ... 225 6 REFERENCES ... 241
6.1 ARTICLES IN JOURNALS ... 241
6.2 OFFICIAL DATASETS AND STATISTICS ... 249
6.3 NEWS AND ONLINE DATA ... 250
List of Figures
Figure 1 Energy efficiency improvements isoquants. Source: Sorrell (2007). ... 18
Figure 2 Measures and indices of energy efficiency performance. Source: Tanaka (2008). ... 20
Figure 3 Illustration of rebound effects for producers. Source: Sorrell (2007). ... 27
Figure 4 Rebound effect classification scheme. Source: Sorrell (2007). ... 28
Figure 5 Rebound effect range. ... 28
Figure 6 Conditions under which rebound effect may be large or small. Source: Sorrell (2009). ... 30
Figure 7 A framework for energy efficiency gap. Source: Jaffe & Stavins (1994). ... 35
Figure 8 The extended energy efficiency gap. Source: Backlund et al. (2012) ... 36
Figure 9 Barriers to energy efficiency investments in developing countries. Source: Sarkar & Singh (2010) ... 57
Figure 10 Creswell's framework for research design. Source: Creswell (2013). ... 72
Figure 11 Deductive research. Source: Blackstone, (2012). ... 73
Figure 12 Inductive research. Source: Blackstone, (2012). ... 73
Figure 13 Geographical map of Iran. Source: Source: U.S. Energy Information Administration ... 90
Figure 14 Iran Populations. Source: Central Bank of Iran's statistics ... 90
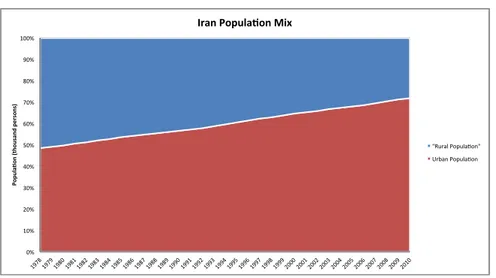
Figure 15 Mix of Rural and Urban Population of Iran. Source: Central Bank of Iran's statistics. ... 91
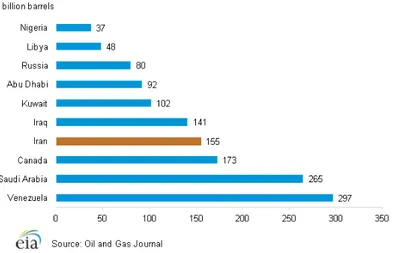
Figure 16 Largest proven reserve holders of oil, January 2013. Source: U.S. Energy Information Administration ... 92
Figure 17 Largest proven reserve holders of natural gas, January 2013. Source: U.S. Energy Information Administration ... 92
Figure 18 Map of Iran wind energy density at 80 meters above the ground level. Source: Deputy for Power & Energy Affairs of Iran, 2010. ... 93
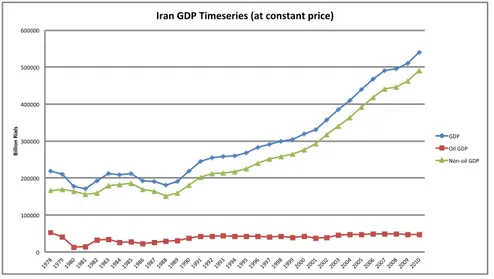
Figure 19 Iran solar radiation potential. Source: Deputy for Power & Energy Affairs of Iran, 2010 . 93 Figure 20 Iran GDP from 1978 to 2010. Source: Central Bank of Iran's statistics, 2012. ... 94
Figure 21 Iran GDP’s growth rate. Source: International Monetary Fund -‐ 2011 World Economic Outlook ... 94
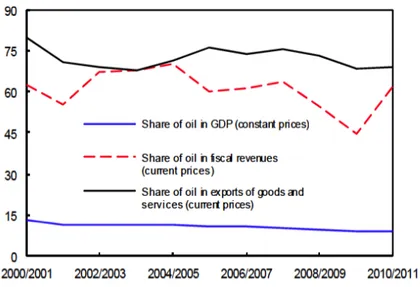
Figure 22 Share of oil in Iran's GDP, fiscal revenues, and exports (In Percent). Source: Guillaume, Zytek, & Farzin, 2011. ... 95
Figure 23 Iran's exports revenues from 1997 to 2010. Source: Central Bank of Iran's statistics, 2012.
... 95
Figure 24 Iran's exports mix from 1997 to 2010. Source: Central Bank of Iran's statistics, 2012. ... 96
Figure 25 Iran's imports from 1997 to 2010. Source: Central Bank of Iran's statistics, 2012. ... 96
Figure 26 Iran's imports mix from 1997 to 2010. Source: Central Bank of Iran's statistics, 2012. ... 97
Figure 27 GDP vs. Energy Efficiency (Top 40 economies by GDP). Source: Corless, 2005. ... 97
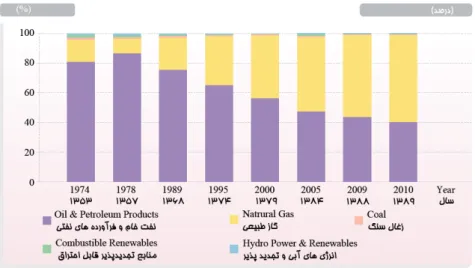
Figure 28 Share of energy carriers in total primary energy supply of Iran. Source: Deputy for Power & Energy Affairs of Iran, 2010. ... 98
Figure 29 Total final consumption of Iran by carriers. Source: Deputy for Power & Energy Affairs of Iran, 2010. ... 99
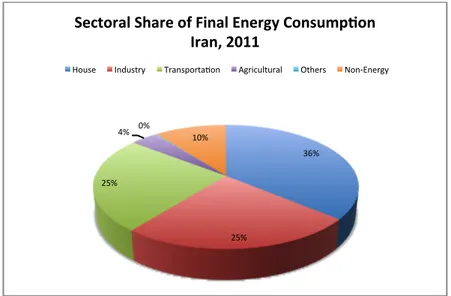
Figure 30 Sectoral share of final energy consumption of Iran, 2011. Source: Iran Energy Balance 2011. ... 99
Figure 31 Final consumption of petroleum products in Iran by sectors. Source: Deputy for Power & Energy Affairs of Iran, 2010. ... 100
Figure 32 Natural gas final consumption in Iran by sectors. Source: Deputy for Power & Energy Affairs of Iran, 2010. ... 101
Figure 33 Electricity final consumption in Iran by sectors (Ref. Deputy for Power & Energy Affairs of Iran, 2010) ... 101
Figure 34 Iran Energy Flow, 2010. Source: Deputy for Power & Energy Affairs of Iran, 2010. ... 103
Figure 35 Indicators and elements of the energy security spectrum. Source: Kruyt et al. (2009). ... 105
Figure 36 Energy intensity index of some selected countries, 2010. Source: International Energy Agency, 2014. ... 106
Figure 37 Comparison of energy intensity indicator using purchasing power parities (1997!100). Source: Deputy for Power & Energy Affairs of Iran, 2010. ... 106
Figure 38 Demand-‐side indicators of Iran's energy security. Source: International Energy Agency, 2012. ... 107
Figure 39 Self-‐sufficiency indicators in some selected countries, 2009. Source: Deputy for Power & Energy Affairs of Iran, 2010. ... 108
Figure 40 Iran gas supply and consumption (1990-‐2010). Source: Central Bank of Iran's statistics, 2012. ... 109
Figure 41 Share of energy carriers in total final consumption (TFC) of Iran and World, 2009. Source:
Deputy for Power & Energy Affairs of Iran, 2010. ... 110
Figure 42 Average retail prices for gasoline and diesel in selected MENA-‐, OECD-‐ and non-‐OECD
Countries (in US$/liter), 2010. Source: Fattouh & El-‐Katiri (2013). ... 111
Figure 43 Average subsidization rates for domestic fuels in selected countries (in %), 2010. Source:
Fattouh & El-‐Katiri (2013). ... 111
Figure 44 Iran: Domestic and International Oil Prices. Source: Guillaume, Zytek, & Farzin (2011).
... 112
Figure 45 Government budget, Construction budget and Energy Subsidies' expenses of Iran, 2005.
Source: Government of Iran. ... 113
Figure 46 Energy prices (For residential sector) in Iran before and after Subsidy Reform. Source:
Moshiri (2013). ... 113
Figure 47 Natural gas price increase -‐ IRR/M3. Source: Hassanzadeh (2012). ... 115
Figure 48 Electricity price increase -‐ IRR/KWH. Source: Hassanzadeh, 2012. ... 115
Figure 49 The Iranian crude oil exports projects a 40% decline in 2012 oil revenues. Source:
Mirsaeedi, 2013. ... 121
Figure 50 Iran's total supply and consumption of oil (1982-‐2012). Source: U.S. Energy Information
Administration, 2013. ... 123
Figure 51 Iranian industries production (1978-‐2010). Source: Central Bank of Iran's statistics. .... 124
Figure 52 Sectoral energy consumption trend of Iran (2005-2011). Source: Central Bank of Iran's
statistics. ... 125
Figure 53 Iran's industry energy consumption for each type of carriers, 2011. Source: Iran Energy
Balance, 2011. ... 125
Figure 54 Trend of consumption of energy carriers in Iranian industries (2005-‐2011). Source: Iran
Energy Balance, 2011. ... 126
Figure 55 Energy saving potential due to energy efficiency standards in some selected industries by
Iranian Fuel Conservation Co., 2010. Source: Deputy for Power & Energy Affairs of Iran, 2010. ... 127
Figure 56 Total final energy demand by sectors, BAU scenario (2005-‐2030). Source: Moshiri et al.,
2011. ... 128
Figure 58 Energy Consumption Share in the industrial workshops of 10 or more employees, 2010.
Source: Iran Statistics Center. ... 129
Figure 59 Energy consumption share of Iranian industries, 2006-‐2007. Source: Iran Energy Balance, 2007. ... 130
Figure 60 The amount of the energy consumption in the industrial workshops more than 10 staff members, 2010. Source: Iran Statistics Center. ... 132
Figure 61 Geographical maps of selected companies for interview (The locations are approximate). Source: Google Maps, 2014. ... 134
Figure 62 A view of Company A. ... 135
Figure 63 A view of Company B, 2014. ... 137
Figure 65 A view of Company C. ... 140
Figure 66 Pots line in new reduction cells technology, Company C. ... 141
Figure 67 Power station of Company C. ... 142
Figure 68 Simple organizational structure of Company C. ... 143
Figure 69 A view of Company D, 2014. ... 143
Figure 70 Schematic of production cycle in Company D (Some lines are under development, see table 4). ... 145
Figure 71 Simple organizational structure of Company D. ... 147
Figure 72 A view of Company E. ... 147
List of Tables
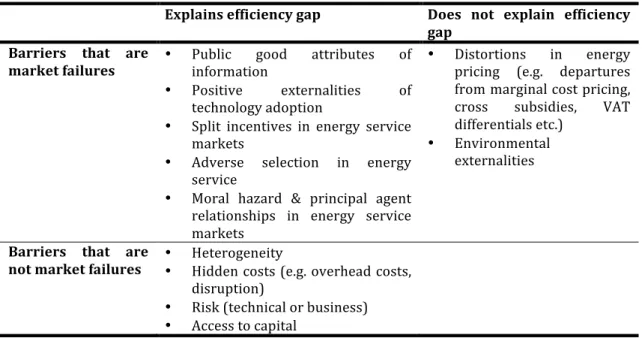
Table 1 Barriers and market failures based on Jaffe & Stavins (1994). Source: Sorrell et al. (2000). 39
Table 2 Different perspectives of energy efficiency barriers according to Sorrell et al. (2000). _____ 39
Table 3 Sorrell et al.’s (2000) taxonomy of barriers to energy efficiency. Source: Sorrell et al. (2000).
____________________________________________________________________________________________________________ 41
Table 4 Possible components of hidden costs. Source: Sorrell et al. (2000). ___________________________ 44
Table 5 Possible categories of Risks. Source: Sorrell et al. (2000). ____________________________________ 45
Table 6 The new taxonomy, with a clear distinction of the origin (external, or internal, with respect
to the firm), and the actors affected by the barriers. Source: Cagno et al. (2013) ___________________ 52
Table 7 Industry barriers rated by the respondents (%). Source: Løvdal & Neumann (2011). ______ 60
Table 8 Summary of recent papers on energy efficiency barriers. ____________________________________ 62
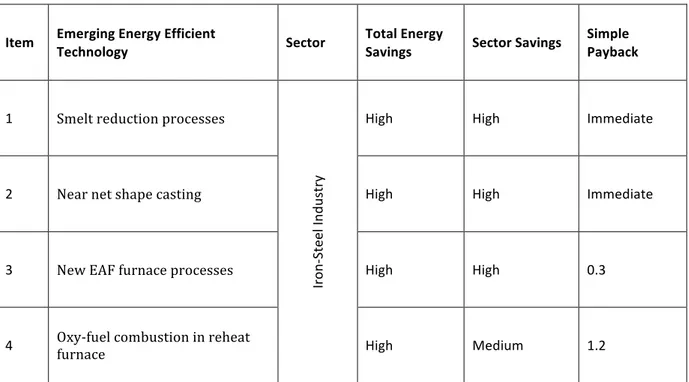
Table 9 List of emerging energy efficient technologies. Source: (Hasanbeigi, Price, & Lin, 2012;
Worrell, 1995; Worrell et al., 2002) ____________________________________________________________________ 65
Table 10 Alternative knowledge claims positions. Source: Creswell (2013). _________________________ 73
Table 11 Alternative strategies of inquiry. Source: Creswell (2013). _________________________________ 74
Table 12 Quantitative, Qualitative and Mixed Methods Procedures. Source: Creswell (2013.) ______ 75
Table 13 Qualitative, Quantitative, and Mixed Methods Approaches. Source: Creswell (2013). _____ 76
Table 14 Elements of Our Research’s Structure ________________________________________________________ 77
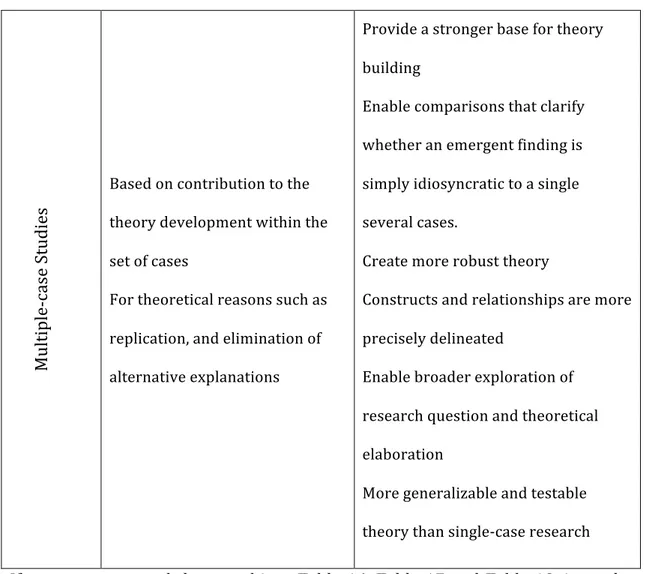
Table 15 Process of Building Theory from Case Study Research (Eisenhardt, 1989) ________________ 80
Table 16 Research Question Typology (Eisenhardt & Graebner, 2007) _______________________________ 82
Table 17 Unit of Analysis Design (Yin, 2009) ___________________________________________________________ 85
Table 18 Choice of Type of Case Study Research (Eisenhardt & Graebner, 2007) ____________________ 86
Table 19 Possible combinations of features of Case Study Researches (Yin, 2009; Eisenhardt &
Graebner, 2007) _________________________________________________________________________________________ 87
Table 20 List of major imposed sanctions on Iran during last years. Source: UN Security Council; U.S.
Center for Arms Control and Non-‐Proliferation. ______________________________________________________ 118
Table 21 Total final energy consumption of Iranian industries (in tons of oil equivalent), 2006-‐2007.
Source: Iran Energy Balance, 2007. ___________________________________________________________________ 130
Table 23 Energy consumption report of Company A (From April 2013 to April 2014). _____________ 136
Table 24 Company B's specifications. __________________________________________________________________ 137
Table 25 Energy consumption report of Company B, 2013. __________________________________________ 138
Table 26 Comparison of new and old smelters of Company C. _______________________________________ 142
Table 27 Production lines of Company D. _____________________________________________________________ 144
Table 28 Summary of Company D's energy consumption ____________________________________________ 146
Table 29 Eisenhardt's analytic strategies for theory building thru case study researches. Source:
Eisenhardt, 1989. _______________________________________________________________________________________ 156
Table 30 Yin's analytic strategies and techniques for case study researches. Source: Yin, 2009. ___ 158
Table 31 Summary of key features of Iranian energy-‐intensive industries case studies. ____________ 163
Table 32 Summary of adopted EE interventions in cases. ____________________________________________ 166
Table 33 Summary of interviewees' responses about EE training programs. _______________________ 167
Table 34 Summary of impacts of imposed sanctions on Iran on energy efficiency of six cases. ____ 168
Table 35 Summary of impacts of subsidies reform on energy efficiency of six cases. _______________ 170
Table 36 Summary of impacts of national EE standards on energy efficiency of six cases. _________ 172
1 LITERATURE REVIEW
1.1 Definition Of Energy Efficiency
Energy efficiency has had a key place in the public policy agenda of most countries in the past decades. This importance is associated to the national competitiveness and energy security benefits, together with to perceived environmental benefits such as reducing damaging emissions. But as Patterson
(1996) mentioned, in spite of the ongoing policy concentration on the ‘energy efficiency’ and abundant literature on this hot topic, there are rare precise definitions of the ‘energy efficiency’ term.
The critical fact about energy efficiency is the relative nature of this issue and
this nature can create ambiguity about it. For example nowadays energy efficiency can be interpreted differently in developed courtiers and developing countries. In many cases technologies, which are still energy efficient in developing countries, cannot be considered as energy efficient technologies
compare to the available innovative technologies in the developed countries’ market. This example also will stand for the time, technologies that were energy efficient in the past, will not be considered energy efficient now. So it is necessary to have clear definition of energy efficiency in hand when discussing about energy efficiency topics.
According to the Patterson’s definition (1996):
“ Energy efficiency is a generic term, and there is no one unequivocal quantitative measure of 'energy efficiency'. Instead, one must rely on a series of indicators to quantify changes in energy efficiency.”
Based on this definition energy efficiency generally means producing the equivalent useful output by consuming less energy input. Therefore energy efficiency has been usually broadly expressed by the simple ratio (Patterson, 1996):
𝑈𝑠𝑒𝑓𝑢𝑙 𝑜𝑢𝑡𝑝𝑢𝑡 𝑜𝑓 𝑝𝑟𝑜𝑐𝑒𝑠𝑠
𝐸𝑛𝑒𝑟𝑔𝑦 𝑖𝑛𝑝𝑢𝑡 𝑖𝑛𝑡𝑜 𝑎 𝑝𝑟𝑜𝑐𝑒𝑠𝑠
Equation 1 Energy efficiency. Source: Patterson (1996).
Jaffe, Newell, & Stavins (2004), Herring (2006) and Gillingham, Newell, & Palmer, (2009) defined similarly ‘energy efficiency’ as “energy services provided per unit
of energy input.”
Brookes (2000) distinguished three different definition of ‘energy efficiency’.
• First law efficiency (enthalpic efficiency).
• Second law efficiency (entropic or thermodynamic efficiency).
• Economic efficiency.
Brookes argued that in situations like our today critical situation, “when the chips
are down”, it is the economic efficiency of energy use definition, which will
dominate the scene (Brookes, 2000).
1.1.1 Types of Energy Efficiency Improvement
There are two possible types of energy efficiency improvement, substitution of capital (or labour) or/and technical change (Sorrell & Dimitropoulos, 2008)
(Sorrell, 2007).
1.1.1.1 Substitution
Substitution here means replacing capital or labour inputs with energy to improve energy efficiency of a system. This situation usually happens when
energy prices increase, and if any thing else remains unchanged, the total cost of production of the same amount of output will increase.
1.1.1.2 Technical Change
Technical change may improve both energy efficiency and total factor productivity. This can happen independently of any change in input prices and
desirably occurs without any loss of economic output.
Figure 1 Energy efficiency improvements isoquants. Source: Sorrell (2007).
This conceptualization of the types of energy efficiency improvement could be mapped directly into a production function in which capital (and other inputs) (X) and energy (E) are viewed as inputs into the production of the maximum
possible energy services (Y) (Figure 1). Along an isoquant describing a given level of energy services produced by different combination of inputs, the ‘optimal’ combination of factors input depends upon the relative prices of all inputs. When substitution is the action, it could be demonstrated as a movement along an isoquant to reflect change in relative prices (other inputs price/energy
technology, which can works with different combination of inputs. But in the case of technical change, which denotes emergence of new technologies and methods of organisation, the isoquant will in favor of energy efficiency shift to the left. This means that the same level of output can be produced from a lower
level of inputs (Gillingham, Newell, & Palmer, 2009; Sorrell, 2007).
Sorrell (2007) interprets three important implications from this distinction between substitution and technical change.
1-‐ Although it seems that substitution is a ‘frictionless’ change from one existing technique to another, in reality it has costs and will take time. 2-‐ The process of technical change is not an independent process, but it is
influenced by changes in relative price of inputs.
3-‐ The production function, as mentioned, illustrates the most efficient combination of factor inputs that is rare in practice. In this case, customer’s Investment to improve energy efficiency can be showed as a move form less efficient to more efficient combinations within the
identical production function ‘frontier’ (Overcoming inefficiency’ arrow in the diagram).
1.1.2 Energy Efficiency Indicators
The next step of defining ‘energy efficiency’ is defining accurately the useful output of process or provided energy service, and the energy input, which in turn gives rise to a number of important methodological concerns that are often
overlooked in the literature (Patterson, 1996).
Patterson categorized four main groups of indicators to monitor changes in energy efficiency (1996):
(1) Thermodynamic indicators
(2) Physical-‐thermodynamic indicators (3) Economic-‐thermodynamic indicators (4) Economic indicators
The first two groups of indicators are scientific and primary indicators that more rely on the essence of the energy sources. But the last two groups are more market-‐oriented indicators that try to measure the input and output of the process in terms of market prices. Especially the fourth group of indicators considers both numerator and denominator of the energy efficiency in monetary terms (Patterson, 1996).
Figure 2 Measures and indices of energy efficiency performance. Source: Tanaka (2008).
Each of abovementioned sets of indicator of energy efficiency performance can be used for an appropriate purpose (Tanaka, 2008). For instance an industrial facility operator who wants to use energy economically can utilize thermodynamic measures, or a company who wants to check the trend of energy consumption in different factories and compare their productivity per unit of
As Tanaka (2008) discussed inappropriate use of measures of energy efficiency performance (MEEP) could mislead the political direction or decision. Hence, because of the strategic purposes of this research that is looking more for the economic consequences of adopting energy efficient technologies in Iranian
firms, the last two groups of indicators will be used in the following sections. So it is necessary to introduce these indicators in detail beforehand.
1.1.2.1 Economic-‐Thermodynamic Indicators
Patterson named these indicators as hybrid indicators, which use thermodynamic units for the measurement of energy input and monetary units for the quantity of output. This group of indicators can be used by different level
of aggregation of economic activities. The main indicators of this group are:
• Energy:GDP ratio
• Sectoral Energy:Output ratios
• Energy productivity ratio (reciprocal of the Energy:GDP ratio)
1.1.2.2 Economic Indicators
When it comes to the economic benefits of energy efficiency or more precisely “economic productivity” of energy, we need a pure economic indicator that
measure both input and output of the process in the market value. As Joint Economic Committee of the Congress of the United States (1981) stated the energy dollars:GDP ratio is “more accurate reflection of the economic productivity of energy, provided that energy prices reflect energy supply and demand forces.” (Patterson, 1996)
However there are serious doubts about the effectiveness of these indicators,
by constant thermodynamic measurement, economic indicator tends to be unstable over time to measure energy in monetary units. Meantime it could be true that these indicators are more economic efficiency indicators than energy efficiency indicators (Patterson, 1996).
The main indicators of this group are:
• National energy input ($)/national output ($ GDP)
• Energy consumer cost savings
1.1.3 Economic Efficiency Vs. Energy Efficiency
After defining energy efficiency, there are some other terms that should be defined to have a clear image of their relation with ‘energy efficiency’; one of these terms is ‘economic efficiency’. Concept of economic efficiency is one of the
complicated and disputed economics’ concepts, which its review is totally out of scope and patient of this research. But still because there is the threat of considering it equal to the energy efficiency, explaining the differences between energy efficiency and economic efficiency will help us to better understand the
path of decision making of different actors toward energy efficiency solutions. Despite energy efficiency, which is a technical and demand-‐side issue, economic efficiency is more a social and market-‐side matter (Gillingham et al., 2009; Gunn, 1997).
Energy efficiency, as a technical efficiency, occurs when there is no prospect to
have more energy service by keeping the input energy constant. Economic efficiency, as a market-‐side issue, happens when the production cost of a product is the lowest possible amount; it is clear that energy cost is one of the components of production cost.
So maximizing energy efficiency is not necessary going to result in maximizing economic efficiency and vice versa (Gillingham, Newell & Palmer, 2009), but as Rosenberg indicated (1983), energy efficiency should appropriately be considered as just part of general economic efficiency (Brookes, 2000).
Meantime there are empirical evidences that show improvements in overall productivity in all production inputs, resulted in energy efficiency increases (Rosenberg, 1983; Sutherland, 1998).
Relation between energy efficiency and economic efficiency is vague. Here the critical concern is that whether individual economic decisions about energy efficiency solutions are really economically efficient or not. To answer to this
question, at the one hand the economic efficiency of the market condition (e.g., market failures), which customer faces, must be investigated, and at the other hand the economic behavior of the customer (e.g., behavioral failures) should be analyzed (Gillingham, Newell & Palmer, 2009).
1.1.4 Energy Conservation Vs. Energy Efficiency
The next controversial concept is “Energy conservation” that often wrongly is
considered as the other face of “energy efficiency” coin in energy policy discussions (Herring, 2006).
Gillingham, Newell & Palmer (2009), and Herring (2006) defined energy conservation as a reduction in the total amount of energy consumed through lowering quality of provided energy service. Energy conservation would not
often save money or energy; actually the amount of conserved energy comes from undone energy service, e.g. lower heating levels, through turning down
thermostat levels (Herring, 2006). Energy conservation’s main drivers are typically regulation, consumer behavior and life style changes (Herring, 2006). But in the very contrary, energy efficiency, as defined previously, is more a technical (and economic) measure that will definitely save money and energy,
while keep quality of energy service. Herring (2006) stated that energy efficiency is a by-‐product of other social goals: productivity, comfort, monetary savings, or fuel competition.
Therefore, energy conservation may or may not has a relation with energy efficiency, because energy consumption will not necessarily decrease by an increase in energy efficiency and even it may increase. The importance of this
issue will be well understood when issues like “rebound effect” are up for discussion (Gillingham et al., 2009; Herring, 2006).
1.1.5 Jevons’ Paradox
Jevons (1866) criticized common belief about energy efficiency, which advocates that new efficient and economical methods of using energy redeem the decline in energy supply. In other word, based on this belief, it is accepted that energy
efficient applications will increase the useful output, while decrease or keep constant the total fuel consumption. He points out that by this way of thinking, “we have thus the means of completely neutralizing the evils of scarce and costly fuel” (Jevons, 1866).
Jevons in his famous book entitled “The Coal Question” wrote “it is wholly a
confusion of ideas to suppose that the economical use of fuel is equivalent to a diminished consumption. The very contrary is the truth.” Although Jevons took coal as a general agent of energy, but interestingly he claimed that more efficient
use of fuel (coal) will leads to its substantial consumption not just in past, but also in future (Jevons, 1866).
There is no doubt that despite huge enhancements in the energy efficiency or as Jevons called ‘economy of the use of fuel’, the world's energy consumption have
been boosted tremendously since Jevons wrote his book. But this fact does not necessary means Jevons’ opinion on energy efficiency is completely true. As Brookes (2000) mentioned, the opponent view discusses that energy consumption’s trend has followed rising trends of populations and associated demand and supply. So logically we would experience greater energy consumption today, if the very large advances in the efficiency of use of energy
have not occurred over the years since the beginning of the industrial revolution (Brookes, 2000).
Therefore, Jevons’s criticism does not mean that we should not pursue energy efficiency. As he truly mentioned:
“It is very economy of the use of coal that makes our industry what it is; and the
more we render it efficient and economical, the more will our industry thrive, and our works of civilization grow.”
1.1.6 Rebound Effect, Tack-‐Back And Backfire
As Herring (1999) mentioned in his paper, several energy economists have argued that improved energy efficiency at the microeconomic level while causing a reduction of energy use at this level, leads not to a reduction, but instead to an
increase in energy consumption, at the macroeconomic level. In reality parts of savings from efficiency enhancements will be used for additional energy consumption, which called ‘take-‐back’ or ‘rebound effect’ (Herring, 2006).
‘Rebound effect’ in short means that by having more energy efficient technologies the cost of energy services will fall and consequently the consumers will have more money in pocket to consume more energy than before (Berkhout, Muskens, & W Velthuijsen, 2000). Logically the rebound effect that comes from
declines in marginal cost of energy services in response to the energy efficiency improvements (Gillingham, Newell & Palmer, 2009), may decrease the expected ‘energy conservation’. Nonetheless magnitude of rebound effect has not been identified yet; Herring (2006) outlined range of 10–20% as a more accepted magnitude. It is strongly argued that the magnitude of rebound effect is much less than 100% (Herring, 2006), but when rebound effect exceeds this threshold
and energy efficiency gains lead to an overall increase in energy consumption, it will be named ‘backfire’ (Saunders, 2000; Sorrell, 2009).
There are three different effects of take-‐back phenomena (Herring, 2006):
1. Direct rebound effect: as a consequence of reduction in the price energy services caused by higher efficiency, the use of these services like any
other commodity will escalate.
2. Indirect rebound effect: By lower cost of energy services, consumers will have more money in pocket to pay for other goods and services, which will add to the energy consumption of those consumers.
3. General equilibrium (economy-‐wide) effect: Changing in the cost of
energy services will result in numerous adjustments of supply and demand in all sectors, which eventually both producers and consumers will consume more energy that before.
Figure 3 Illustration of rebound effects for producers. Source: Sorrell (2007).
Sorrell (2007) introduced similar categorization of rebound effect that in his scheme each of direct and indirect rebound effect (Figure 3) is divided to two subcategories, and he considered economy-‐side (general equilibrium) effect as
the sum of direct and indirect effect. He classified direct effect for the producers into:
a) Substitution Effect: As a consequence of decrease in the cost of energy service, the cheaper energy service replaces for the usage of other production factors to keep the level of output constant.
b) Output Effect: Higher energy efficiency, by reducing costs, allows the producer to produce a higher level of output, which in turn increases consumption of all production’s inputs.
And he decomposed the indirect rebound effect into:
a) Embodied Effect: The energy efficiency improvement itself consumes energy, for illustration the energy that is needed for producing and installing thermal insulation.
b) Secondary Effect: Energy efficiency improvements in one sector result in a set of changes in the users’ purchase power as well as energy prices,
Sorrell (2007) also provided a diagrammatic representation for his categorization (Figure 4). ‘E n gi n ee ri n g’ E st im at e O f E n er gy S av in g
Actual Energy Saving
Ec on omy -‐Wi de Re bo und Ef fe ct Ind ir ect Rebound Ef fect Secondary Effect Embodied Effect Dir ect Reb ound Effect Income/Output Effect Substitution Effect
Figure 4 Rebound effect classification scheme. Source: Sorrell (2007).
Obviously the relative size of each component of Sorrell’s scheme can be different form one case to another, and even it is possible that in some
circumstances individual component of rebound effect turns negative. The total economy-‐wide effect theoretically can be negative, which is called ‘super conservation’, or more than engineering estimate of energy saving, which is named ‘backfire’ (Figure 5) (Sorrell, 2007).
Super Conservation Rebound effect Backfire
Negative 0 50 100 >100%
Rebound effect (% of estimate of energy saving) Figure 5 Rebound effect range.
But when rebound effect is going to become backfire and when there is the chance of achieving to a condition close to the super conservation? As Jevons showed in his book, ‘The Coal Question’, energy efficiency improvements of technologies such as steam engines and smelting iron, which have wide range of
application, may have large rebound effect. Sorrell (2009), based on the Jevons’ scholarship, argued that energy efficiency improvements related to the general-‐ purpose technologies (GPTs), which have a broad range for development and expansion and are applicable across a wide variety of applications, particularly when these technologies are used by producers, can have such long term and significant effect on innovation, productivity and economic growth that as a
consequence economy-‐wide energy consumption intensifies. In contrary to the GPTs, emergence of dedicated energy-‐efficiency technologies that have minor effects on productivity and economic growth, can result in decline in economy-‐ wide energy consumption, specifically when these technologies are used by consumers or when energy service is an ‘inferior good’. Not surprisingly, the first
case (GPTs) is more likely to occur in the developing countries as result of their technological transitions (technology catch-‐up) toward modern productive technologies, and the second case is more likely to occur in developed countries that have productive industry (Sorrell, 2009).
Figure 6 Conditions under which rebound effect may be large or small. Source: Sorrell (2009).
1.1.7 Conclusion And Implications For Next Steps
Despite the ongoing policy concentration on the ‘energy efficiency’ and abundant literature on this hot topic, there are rare precise definitions of the ‘energy efficiency’ term. Energy efficiency is a generic and relative term, and there is no one definite quantitative measure for energy efficiency, which can cause ambiguity about it. Energy efficiency typically defined as energy services
provided per unit of energy input. This definition can be viewed from physical perspective or economic perspective, however in today volatile condition of the global energy market, it is the economic efficiency of energy use definition, which will dominate the scene and will help policy makers to understand the ongoing trends in the market.
There are two possible types of energy efficiency improvement, substitution or technical change. Logically technical change will bring more desirable economic outcomes and occur independent of any change in production factors’ price. However economic outcomes of energy efficiency improvements of technical
change, particularly when these changes occur for general-‐purpose technologies (GPTs), can be offsets by increase in overall economy-‐wide energy consumption. The next step of defining ‘energy efficiency’ is defining accurately the useful output of process or provided energy service, and the energy input. Patterson
categorized four main groups of indicators to monitor changes in energy efficiency, thermodynamic indicators, physical-‐thermodynamic indicators, economic-‐thermodynamic indicators, and economic indicators. The first two groups of indicators are scientific and primary indicators that more rely on the essence of the energy sources, but the last two groups are more market-‐oriented indicators that try to measure the input and output of the process in terms of
market prices.
There are several myths about energy efficiency that should be explained at the beginning. First of all energy efficiency is not equal to the economic efficiency, and maximizing energy efficiency is not necessary going to result in maximizing economic efficiency and vice versa. Energy efficiency is just part of general
economic efficiency and improvements in overall productivity in all production inputs will result in energy efficiency increases.
Second, energy conservation may or may not has a relation with energy efficiency, because energy consumption will not necessarily decrease by an increase in energy efficiency and even it may increase. Jevons also showed that
the accepted belief, which energy efficient improvements will increase the useful output while decrease or keep constant the total fuel consumption, does not always occur in practice and even in some cases by introducing energy efficient improvement the overall fuel consumption can increase.