Bioinspired Citrate
−Apatite Nanocrystals Doped with Divalent
Transition Metal Ions
Francisco Javier Martínez-Casado,
*
,†,‡Michele Iafisco,
§José Manuel Delgado-López,
†Carla Martínez-Benito,
∥Catalina Ruiz-Pe
́rez,
∥Donato Colangelo,
⊥Francesca Oltolina,
⊥Maria Prat,
⊥and Jaime Gómez-Morales
*
,††Laboratorio de Estudios Cristalográficos, IACT (CSIC-UGR), Avda. Las Palmeras, no. 4, 18100 Armilla, Granada ‡MAX IV Laboratory, Lund University, Ole Römers väg 1, 223 63, Lund, Sweden
§Institute of Science and Technology for Ceramics (ISTEC), National Research Council (CNR), Via Granarolo 64, 48018 Faenza (RA), Italy
∥Laboratorio de Rayos X y Materiales Moleculares (MATMOL), Departamento de Física, Facultad de Ciencias (Sección Física), Universidad de La Laguna, Tenerife, Spain
⊥Dipartimento di Scienze della Salute, Università del Piemonte Orientale, , Via Solaroli, 17, 28100 Novara, Italy
*
S Supporting InformationABSTRACT: Bioinspired citrate−carbonate−apatite (cAp) nanocrystals doped with divalent transition metal (M) ions, i.e., Mn2+, Co2+, and Ni2+, were prepared by batch thermal
decomplexing of Ca2+/M/citrate/phosphate/carbonate solu-tions at 80 and 37°C, with initial Ca2+/M molar ratios of 9:1
and 5:5, and at different crystallization times ranging from 1 to 96 h. A thorough chemical, crystallographic, and morpho-logical characterization was carried out on the doped nanocrystals revealing that (i) using similar crystallization conditions the amount of incorporated M normally followed the order Mn2+> Co2+> Ni2+; (ii) the growth of nanocrystals
was clearly enhanced at 80°C and when a lower amount of M was incorporated in the crystal structure; (iii) the increase of
the M content increased the aspect ratio (length/width) of the M-doped cAp nanocrystals compared to undoped ones, (iv) the incorporation of the 6.5 wt % of M is a threshold for the long-range order of the nanocrystal; in fact, with a higher M content, amorphous materials were mainly produced. Additionally, we found that citrate controlled the activity of hydrated M ions in solution, the extension of the doping process, and protected the M ions against oxidation in solution as well as in the outermost layer of doped nanocrystals. Preliminary in vitro cytotoxicity studies on the murine MS1 endothelial cell line showed that the produced Mn2+- and Co2+-doped nanocrystals were highly biocompatible at doses comparable to those of undoped ones, with
the exception of the nanocrystals substituted with the highest Co2+content at the higher doses.
1. INTRODUCTION
Apatite (Ap) nanocrystals are widely used in orthopedics, dentistry, and more recently also for other exciting nano-technological applications as drug nanocarries, nanocatalysts, and fertilizers due to their well-known properties of biocompatibility, biodegradability, osteoinductivity, and ability to link a wide range of molecules to a high extent.1−4 In addition, it is well reported that Ap nanocrystals having features very close to those present in bone in terms of size, chemical composition, and morphology, the so-called“biomimetic” Ap, display enhanced biological and technological performances.5−7 Therefore, many synthetic methodologies to prepare “bio-mimetic” Ap nanocrystals have been developed in the last few years,1,8−10and in most of them organic templates or additives were used tofinely control nucleation and crystal growth.10−12
Recently Delgado-López et al. prepared bioinspired citrate− carbonate−apatite (cAp) nanocrystals having mean lengths ranging from 20 to 100 nm by batch thermal decomplexing of calcium/citrate/phosphate/carbonate solutions.13 Citrate was employed as an organic additive during the Ap synthesis because it was found that it is strongly bound to bone Ap surface, and it accounts for about 5.5 wt % of the total organic component of bone tissue.14 The presence of citrate in the reaction environment enables the formation of homogeneous metastable solutions at pH > 8.3, avoiding the instantaneous nucleation of calcium carbonate or calcium phosphate.13,15At the same time, the increase of the temperature produces a
Received: July 22, 2015 Revised: October 2, 2015 Published: November 11, 2015
gradual and homogeneous release of Ca2+ ions leading to the
formation of amorphous calcium phosphate (ACP) that transforms to nanocrystalline carbonate apatite platelets with citrate adsorbed on the surface.16Citrate plays the dual role of driving a growth pathway via an amorphous precursor and controlling the size of the nanocrystals by the nonclassical oriented aggregation mechanism.17Moreover, cAp nanocrystals display excellent biocompatibility properties in cell biological systems,13 and it was demonstrated that they can be used as pH-responsive delivery system of the anticancer drug doxorubicin inside cells.18
Ap nanocrystals doped with foreign ions have also recently attracted remarkable attention, since the ionic substitution is a powerful tool to improve their performances for different applications.19 Substitution of doping ions (i.e., cations and anions) in the Ap crystal lattice can commonly occur. Indeed, bone Ap nanocrystals are substituted with several foreign ions such as CO32−, HPO42−, SiO44−, Na+, Mg2+, Mn2+, and other
minor elements.1 Because of its highflexible structure, Ap can host monovalent, divalent, and even trivalent cations, as well as simple monovalent anions or oxoanions.19,20
The aim of this work is the preparation and characterization of bioinspired cAp nanocrystals doped with different functional metal (M) ions by the method of thermal decomplexing of calcium/M/citrate/phosphate/carbonate metastable solu-tions.13,15−17 Three divalent M cations, such as Mn2+, Co2+ and Ni2+, were selected as doping ions to modify the crystal
structure of the nanocrystals and to improve their features for novel or better biological and technological applications.
Mn2+ion plays an important role in bone metabolism since it influences regulation of bone remodeling, and its deficit causes reduction of organic matrix synthesis and retards endochondral osteogenesis.21 Mn2+-doped carbonate-Ap nanocrystals pro-mote human osteoblasts proliferation, activation of their metabolism and thereby bone growth.22 The presence of Mn2+ in the crystalline structure of Ap was also found to
positively influence the adhesion of bone cells to an implant material, their spread and viability.23In view of this, the Mn2+ ion can be considered as an optimal agent to improve the osteoconductivity and osteointegration of cAp-based materials for bone tissue engineering.
Co2+ ion is well reported as an antibacterial and antiviral agent in various organic complexes.24 Nanocrystalline Ap doped with Co2+presents antibacterial activity against different strains, i.e., Staphylococcus aureus, Micrococcus luteus, and Shigella f lexneri.20Moreover Ap enriched with a large content of Co2+ions was found to display a highly beneficial effect for osteoporotic bone tissue regeneration.25As a result, Co2+can
be effective to provide antimicrobial and antibacterial properties to cAp nanocrystals with the final aim to manufacture multifunctional materials for bone and dental applications.
Furthest from the biomedical field, Ni2+is one of the most active M ions able to catalyze many interesting reactions,26,27 and also Ap has been reported as a recyclable low-cost material to support catalysts for organic synthesis.28 Recently, Ni2+
-substituted Ap has revealed good catalytic activity in the process of methane dry reforming.29Therefore, the addition of Ni2+ ions in the cAp structure can be useful to prepare not-hazardous and biodegradable “green” material as a heteroge-neous nanocatalyst.
In this work, the physical−chemical and crystallographic properties of the prepared M-doped cAp nanocrystals have been thoroughly characterized to assess the influence of the
selected ions on the chemical and structural properties of the cAp. Moreover, the biocompatibility of Mn2+- and Co2+-doped nanocrystals has been characterized in the murine MS1 endothelial cell line to evaluate their possible use for biomedical applications.
2. MATERIALS AND METHODS
2.1. Reagents. Calcium chloride dihydrate (CaCl2·2H2O, Bioxtra, ≥ 99.0% pure), nickel chloride hexahydrate (NiCl2·6H2O, ACS reagent, purity = 99.999%), manganese chloride tetrahydrate (MnCl2· 4H2O, ACS reagent, purity), cobalt chloride hexahydrate (reagent grade), sodium citrate tribasic dihydrate (Na3(Cit)·2H2O where Cit = citrate = C6H5O7, ACS reagent,≥ 99,0% pure), sodium phosphate dibasic (Na2HPO4, ACS reagent, ≥ 99.0% pure) and sodium carbonate monohydrate (Na2CO3·H2O, ACS reagent, 99.5% pure), and hydrochloric acid (HCl, ACS reagent, 37 wt % in H2O) were provided by Sigma-Aldrich. All solutions were prepared with ultrapure water (0.22μS, 25 °C, Milli-Q, Millipore).
2.2. Crystallization Methods. The experiments were carried out by thermal treatment of metastable solutions containing Ca2+ /M-citrate complexes in the presence of phosphate and carbonate ions, at pH = 8.5 (where M is Mn2+, Co2+, or Ni2+). Materials were synthesized on the basis of the procedure reported elsewhere.13Briefly, two solutions of (a) x CaCl2+ y MCl2(x = 0.09 or 0.05 M and y = 0.01 or 0.05 M, to get 9:1 and 5:5 molar ratios, respectively) + 0.4 M Na3(Cit) and (b) 0.12 M Na2HPO4, + 0.2 M Na2CO3were mixed (1:1 v/v, 200 mL total) at 4°C, and the pH was adjusted to 8.5 with diluted HCl. The undoped sample (cAp) was obtained using a 0.10 M CaCl2 M-free solution in the aforementioned procedure. The mixed solution was introduced in a 250 mL round-bottomflask, sealed with a glass stopper and, without delay, immersed in a water bath at 80°C. A set of experiments using an initial 9:1 Ca/M ratio was also carried out at 37°C to assess the influence of the temperature. The crystallization experiments were stopped at different maturation times ranging from 1 to 96 h. Once finished, the precipitates were subjected to three consecutive cycles of washing by centrifugation with ultrapure water. Afterward they were freeze-dried overnight at−50 °C under a vacuum (3 mbar).
2.3. Characterization Methods. The study of the speciation of Ca2+-citrate and M-citrate aqueous solutions as a function of the temperature was carried out to assess the stability of these complexes in solution prior the crystal precipitation and to correlate their activities with the amount of metal incorporated in the crystalline structure of the precipitates. Calculations were performed with Phreeqc speciation software30with the minteq v4.dat database using the initial Ca/M ratio 9:1 at pH 8.5. The aqueous species considered in the calculations are shown inSupporting Information.
The M, Na, Ca, and P contents were determined by inductively coupled plasma-optical emission spectrometry (ICP-OES) using a PerkinElmer Optima 8300 spectrometer. Samples were dissolved in 1 wt % ultrapure nitric acid and analyzed in triplicate. The crystallo-graphic characterization and the microstructural analysis (average crystal size and shape) were carried out by powder X-ray diffraction (PXRD). PXRD patterns were collected in reflection mode (on a Si flat sample holder), using a Cu Kα radiation (Kα2/Kα1= 0.476) on a PANalytical X’Pert PRO MPD diffractometer equipped with a PIXcel RTMS detector operating at 45 kV and 40 mA. For the incident beam, fixed antiscatter and divergence slits of 1° and 0.5°, respectively, were used. The 2θ range varied from 5° to 104° with a step size of (2θ) 0.013°. The Rietveld refinement of collected X-ray diffraction (XRD) data was accomplished by using the Fullprof software package.31 Transmission electron microscopy (TEM) observations as well as selected area electron diffraction (SAED) and energy-dispersive X-ray spectroscopy (EDS) analysis were performed with a STEM Philips CM 20 microscope operating at 80 kV. The powder samples were ultrasonically dispersed in ethanol (absolute,≥99.8%), and then a few droplets of the slurry were deposited on conventional copper microgrids prior to observation. The analysis of the electrophoretic mobility (ζ-potential) of samples was performed in a Zetasizer Nano
analyzer (Malvern, UK) using disposable folded capillary cells at 25 °C. Samples were prepared by suspending particles in deionized water with pH∼ 6.5.
2.4. Cytotoxicity Tests. The murine MS1 endothelial cell line was maintained in Dulbecco’s modified Eagle’s medium (DMEM), 10% fetal calf serum, 50 U/mL penicillin, and 50 μg of streptomycin (complete medium), by transplanting them twice a week. For toxicity tests, cells were incubated (10× 103/0.4 cm2microwell) for 24 h; then different concentrations of M-doped and control undoped nano-particles were added in 100 μL of complete medium. Soluble doxorubicin hydrochloride (DOXO, C27H29NO11HCl, 98.0−102.0% HPLC grade) was used as a control toxic reagent. After 2−3 days incubation, cells viability was evaluated by the 3-(4,5-dimethylthiazol-2-yl)-2,5-diphenyltetrazolium bromide) (MTT) colorimetric assay. Briefly, 20 μL of MTT solution (5 mg mL−1in a PBS solution) was added to each well. The plate was then incubated at 37°C for 3 h, and then the supernatants were carefully aspirated. Afterward, 125μL of 0.2 M HCl isopropanol was added to dissolve formazan crystals. A 100 μL aliquot was then removed carefully, and the optical density was measured in a multiwell reader (2030 Multilabel Reader Victor TM X4, PerkinElmer) at 570 nm. Viability of parallel cultures of untreated cells was taken as 100% viability, and values obtained from cells undergoing the different treatments were referred to this value. Experiments were performed four times using three replicates for each sample.
2.5. Statistical Analysis. Experiments were carried out in triplicate, and data are expressed as mean± standard error. Statistical analyses were performed using independent t tests for two groups comparisons and a one-way analysis of variance (ANOVA), after checking homogeneity of variance using Levene’s test, in the case of multiple comparisons. ANOVA was followed by postdoc Scheffé’s test. Differences at p < 0.05 were considered to be statistically significant.
3. RESULTS
3.1. Thermal Destabilization of Metal-Citrate Com-plexes and Metal Substitution in the cAp Nanocrystals.
Figure 1shows the evolution of the calculated ionic activities of M-citrate complexes and the free solvated M cations as a function of temperature. Ca(citrate)− revealed higher activity than Co(citrate)−, Mn(citrate)−, and Ni(citrate)24−, respec-tively. Similarly, free Ca2+ displayed higher activity in comparison to the other free solvated ions (i.e., Mn2+, Co2+,
and Ni2+). The fact that the activities of all M-citrate complexes
decrease as a function of the temperature, because of their thermal destabilization, validates the application of the thermal decomplexing method for precipitating M-doped apatites in the presence of citrate.
On the basis of these data, only in the case of Ni2+, whose
activity was very low, the Ca2+ions within the apatite structure could be replaced with a low efficiency. The calculations also suggest that the different stability of the M-citrate complexes and their evolution with the temperature can be a key factor influencing the doping of the apatitic structure.
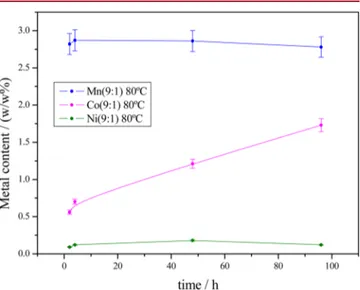
The M content of the doped nanocrystals is shown inFigure 2, for (9:1) initial Ca/M molar ratio at 80°C, and inFigure S1
for samples prepared in the rest of studied conditions. At 80 and 37°C the higher M content was found in samples prepared in the presence of Mn2+, rather than in those precipitated in the
presence of Co2+ and Ni2+, in agreement with the order in which the activities of these ions decreased in solution. At 80 °C, the Ca/M ratio 5:5 significantly favored the incorporation of M irrespective of its nature, and, in this regard, it is worth noting that in some samples the Mn2+content was almost twice of that of Ca2+(Table S1, Supporting Information).
In the cases of Mn2+ and Co2+ the doping process is controlled by the thermal evolution of the ionic activities in solution, which are temperature-dependent. In fact, Mn-doped cAp crystals showed less Mn2+content at 80°C than at 37 °C
in agreement with the decrease of Mn2+ activity with temperature. In contrast, Co-doped crystals showed a higher Co2+ content at the highest temperature, since the activity of free Co2+increased with temperature. Differently, the amount
of Ni2+inside the apatitic structure did not follow a trend as a function of temperature because of its very low activity in solution. The time evolution of M content shows that Mn2+ and Ni2+are incorporated during thefirst 4 h of reaction, and
then the content of these elements remains almost constant (Figure 2). Only in the case of Co2+ a linear increase in the
amount of M incorporated as a function of time has been found.
The full elemental composition including the weight percentage of Ca, P, and Na, and the (Ca+M)/P and Ca/M molar ratios, is shown in Table S1 ofSupporting Information. Figure 1. Calculated ionic activities of Ca(citrate)−, M-citrate
complexes, and the free solvated cations as a function of the temperature, for the (9:1) initial Ca/M molar ratio.
Figure 2. Transition metal content (w/w%) as a function of maturation time in the M-doped cAp nanoparticles prepared at 80 °C with an initial Ca/M ratio of 9:1.
The (Ca+M)/P molar ratio of all the studied samples did not significantly vary as a function of maturation time revealing only slight changes in the structural composition of M-doped cAp nanocrystals. Conversely, the Ca/M molar ratio was signi fi-cantly affected by the different M content that is able to enter and substitute for Ca2+ions in the apatitic structure.
It was already reported that cAp nanocrystals obtained by the thermal decomplexing technique are covered by adsorbed citrate and counterions.14 Herein we show that this layer (composed of citrate and Na+) can be removed by washing the crystals in a basic solution (NaOH 0.1 M). In fact, FTIR spectroscopy revealed that the characteristic asymmetric stretching mode of − COO− groups of citrate ions at 1595 cm−113,15practically disappears after this treatment (Figure S2 of Supporting Information). FTIR spectra of M-doped cAp nanoparticles (Figure S2) also showed the main broad band at ∼1030 cm−1 with a shoulder at around 1074 cm−1
corresponding to the asymmetric stretching mode of PO43−
groups and the bands at∼962 cm−1and∼603 cm−1ascribed to the symmetric stretching and bending mode of PO4 groups,
respectively. The presence of CO32−bands at∼1465 cm−1and
∼880 cm−1(shoulder) indicated that CO
32−ions replaced the
−OH groups (A-type carbonation).13
The absence of bands at 3567 and 631 cm−1 corresponding to the stretching and librational modes of OH groups confirmed the A-type carbonate substitutions. Additionally the presence of the bands at 1415 and 873 cm−1proved also the existence of B-type carbonate substitutions (CO32−replacing PO43−groups). The elemental analysis (Table S1, Supporting Information) revealed that the Na+content in the washed samples decreased
significantly with respect to the unwashed precipitates indicating that the major part of Na+ was entrapped in the
surface layer. On the contrary, the M content remained almost unantered when the citrate layer was removed, proving that most of M was incorporated into the apatite structure. An additional result found in the washed samples was that the Na+ content was similar regardless of the nature of the transition metal (Mn or Co) and the initial Ca/M ratio (see Table S2 of
Supporting Information). The amount of Na+ and M in the
analyzed samples suggests that the metal composition for the M-doped nanoparticles can be represented by the general chemical formula: Ca5‑x‑yNa2xMy.
Interestingly, the formation of M-citrate complexes in solution prevents the oxidation of Mn2+ at basic pH, and,
moreover, the citrate coating around the crystals avoids metal oxidation of the doped nanocrystals. In fact, after removing the citrate coating with 0.1 M NaOH a change of color from white to brown occurred, indicating the oxidation from Mn2+ to
Mn3+/4+ (Figure 3a). The structure and sizes of the doped
apatites, however, remained unaltered after this treatment since the XRD patterns of the as-synthesized and washed samples were similar (Figure 3b). This fact indicates that oxidation of manganese took place at the outermost layer of the doped nanocrystals.
3.2. Microstructure of M-Doped cAp Nanocrystals. The XRD diagrams of the samples prepared at the different conditions (Figure S3, Supporting Information) showed the diffraction peaks of hydroxyapatite single phase. Concerning the interpretation of our experimental XRD patterns, we adopted the hexagonal symmetry for this phase, according to (JCPDS 9-432), for the sake of practice and simplicity. Thus, the characteristics reflections appear at 2θ 25.87° (plane 00.2), the broad peak due to the triplet at 31,77°, 32.19°, and 32.90°, which correspond to planes 21.1, 11.2, and 30.0 and other main peaks at 39.81°, 46.71°, 49.46°, and 53.14°, which correspond to the planes 31.0, 22.2, 21.3, and 00.4 respectively.32
The Rietveld refinements were performed using the FullProf program.31The unit cell parameters, obtained from the most crystalline samples by DICVOL04,33belong to the hexagonal system, space group P63/m, and they were the same as those reported for hydroxyapatite. The refinements started from the atomic positions reported by Wilson et al.34(in which structure the carbonate groups are included), constraining the composition of transition M and Ca according to the M content calculated by ICP-OES. The peak profiles were described by a Thompson−Cox−Hastings (TCH) pseudo-Voigt profile function, whereas a Chebychev polynomial was used for the background description.
The parameters that were systematically refined included the unit cell (a and c; 2), preferred orientation (1), size and shape (anisotropic Lorentzian size broadening by spherical harmonics in the Laue class 6/m; 3), isotropic strain (1), background (15), and overall B-factor (1). The refinements presented great robustness and repeatability for all samples (see Figure 4
showing thefitting for two of the samples: Mn(9:1)-Ap-2h-80 °C and Co(9:1)-Ap-48h-80 °C).
The microstructural analysis provided the average crystallite size, i.e., the mean size of the diffractive crystal domains Figure 3.(a) Picture showing the effect of the metal oxidation when removing the citrate coating in a Mn-doped cAp sample (Mn(9:1)-96h-80 °C): samples before (white powder) and after washing (brown powder) with 0.1 M NaOH solution; (b) XRD diagrams of the samples before and after washing with 0.1 M NaOH.
(referred to the volume of these domains). The standard deviation in those values corresponds to the anisotropy of the crystal domains, since anisotropic size broadening corrections were applied.
The average crystallite sizes for the different samples are reported inTable 1. The largest crystallites were found for cAp, and then the average sizes decreased gradually from Ni-, Co-, and Mn-doped samples. Temperature and Ca/M ratio affected significantly the crystallite sizes. In fact, the samples prepared at
37 °C showed lower values than those obtained at 80 °C. Similarly, samples prepared with the Ca/M ratio of 5:5 were smaller than those prepared with the Ca/M ratio of 9:1.
The dimensions of the crystal domains were estimated also in the different directions of the crystals, besides the average crystallite size. The cAp crystals, with a hexagonal unit cell (Laue group 6/m), show two main dimensions, D00.land Dhk.0,
that are the longest and the shortest, respectively. The average size of crystal domains reported inTable 2are related to the samples prepared at 80°C using a Ca/M initial ratio of 9:1 (see Table S3 in Supporting Information for data relative to the other M-doped cAp nanocrystals).
The values of D00.l are clearly higher than those of Dhk.0
indicating that the crystal domains were elongated along the c-axis.
3.3. Crystal Growth of M-Doped cAp Nanocrystals. The growth behavior of the nanocrystals as a function of time is shown in Table 1 and in Figure S4 of the Supporting Information. Crystal growth is faster during the first crystallization stages, whereas growth cessation is observed at the longer times of each run.
The growth of nanocrystals is clearly enhanced when temperature increased and the M content decreased, Ni-doped cAp nanocrystals showing the highest growth while those doped with Co and Mn the lowest. In the absence of M, i.e., undoped cAp, the growth is even faster. Thus, the doping process directly affected the final size and shape of the nanocrystals in the sense that a lower M content yielded longer and wider crystals. The plot of the average crystallite size versus the percentage of M content for crystallization times of 2, 4, 48, and 96 h graphically reports this trend (Figure 5). Interestingly, a crystal size of around 20 Å (2−3 unit cells) was found above 6.5% of M content, in all the cases. This size can be considered the frontier between crystalline and amorphous structures.
On the other hand, we found that the higher the M content the more difficult the growth is in the (10.0) and equivalent planes of cAp nanocrystals. The reason is likely due to the stronger (shorter) bond of the citrate molecules with M than with Ca in the outermost apatite layer, i.e., d(Ca(II)−O) ≈ 2.4 Å; d(Mn(II)−O) ≈ 2.2 Å; d(Co(II)−O) ≈ 2.1 Å; d(Ni(II)− O) ≈ 2.1 Å. In a thorough study about the Co-doped hydroxyapatite particles produced in the absence of carboxy-lated molecules by Veselinovic et al.,35the authors showed that samples with higher Co2+content display not only smaller sizes but also lower aspect ratio than undoped particles. In agreement with these results, herein we prove that citrate plays a decisive role in shaping the M-doped nanocrystals, avoiding the growth in the (hk.0) planes and yielding nanoparticles with greater aspect ratios.
Another interesting result of the microstructural study is that the volume of the unit cell varies between different samples and decreases with crystallization time (Figure 6a). This can be explained by the crystal size, which, in fact, presents an indirect relationship with the unit cell volume: the smaller the crystals, the bigger the cell volume (Figure 6b). In all cases the variation of the unit cell is more pronounced in the a than in the c parameter (Table S4, Supporting Information). This suggests that the citrate anions bind more strongly to the outermost (hk.0) planes as the transition M content increases, and then, the few unit cells in the nanocrystals are more deformed than in the bulk of bigger crystals. In fact, the strain is bigger in smaller crystals, and therefore, in crystals that were precipitated at shorter reaction times (Figure S6,Supporting Information). Figure 4. Examples of Rietveld refinements of the samples (a)
Mn(9:1)-Ap-2h-80°C and (b) Co(9:1)-Ap-48h-80 °C, showing the excellent agreement between the observed and calculated diffraction patterns. The average crystallite size (isotropic), the calculated sizes (D00.land Dhk.0), and the shape of the crystalline domains are shown in the inset.
Table 1. Average crystallite size (Å) and relative standard deviation (as Anisotropy, in parentheses), of cAp and M-doped cAp nanocrystals synthesized at 80°C using the initial Ca/M molar ratio of 9:1
time/h cAp Mn-cAp Co-cAp Ni-cAp
1 68.8(39.9) 35.9(22.3) 52.5(66.1) 43.6(21.3) 2 67.3(38.0) 45.6(26.8) 61.9(36.0) 64.8(30.6) 4 70.8(39.4) 47.5(25.6) 66.3(35.3) 71.6(31.9) 48 110.6(36.6) 66.2(35.1) 92.1(35.6) 106.5(40.6) 96 127.1(46.6) 77.3(41.8) 97.7(39.1) 118.7(48.0)
3.4. Size and Shape Distribution by TEM. TEM analyses were carried out on the samples prepared with the longest crystallization time (96 h). The mean length (L) along the longest axis, the mean width (W), and the mean aspect ratio (R, ratio between L and W) were determined from TEM micrographs of samples precipitated with Ca/M ratio 9:1 using 40−50 particles in each micrograph (Figure 7a−c).
The L and W values of the nanocrystals (which correspond to the dimensions in the [00l] and [hk0] directions, respectively) decreased gradually from the undoped cAp to Ni-, Co-, and Mn- doped cAp nanoparticles (in this order), showing a correlation with the content of transition M (Table 3). It is worth noting that W values are strongly affected by the presence of transition M in the cAp structure. The values of the aspect ratio R, which correspond to the anisotropy in the shape of the crystals, increased in the opposite order, so the higher the M content the more pronounced the anisotropy is, yielding more elongated morphologies. This can be clearly observed, for example, when comparing Mn- and Ni-doped nanoparticles (Figure 7a,c).
The results for the average sizes and shapes obtained from TEM observations were in rather good agreement with the average crystallite sizes calculated by microstructural analysis (Table 3), suggesting that individual particles correspond to single crystals. On the other hand, samples with a higher M content show much smaller sizes, and the particles appear agglomerated, so their size could not be estimated, as is the case of the Mn(5:5) sample (Figure S5 ofSupporting Information).
3.5. ζ-Potential of M-Doped cAp Suspensions. cAp suspensions showed the most negativeζ-potential (−51.4 mV) followed by the suspensions of Mn- and Ni-doped cAp nanocrystals, whose values were −21.7 and −19.9 mV respectively. Thisfinding indicated a decrease of the colloidal stability when cAp was doped with transition metals. A higher ζ-potential of −6.9 mV was measured in Co-doped cAp, indicating that this was the less stable suspension.
Table 2. Average size (D) of crystal domains along the [00.l] and [hk.0] directions of cAp and M-doped cAp nanocrystals synthesized at 80°C using the initial Ca/M molar ratio of 9:1
cAp Mn-Ap Co-Ap Ni-Ap
time/h D00.l/Å Dhk.0/Å D00.l/Dhk.0 D00.l/Å Dhk.0/Å D00.l/Dhk.0 D00.l/Å Dhk.0/Å D00.l/Dhk.0 D00.l/Å Dhk.0/Å D00.l/Dhk.0 1 254.63 46.63 5.5 128.52 25.25 5.1 202.29 34.55 5.9 124.25 31.94 3.9 2 231.14 44.07 5.2 168.9 30.5 5.5 220.8 40.7 5.4 188.2 45.2 4.2 4 241.13 46.48 5.2 161.7 32.6 5.0 213.1 44.2 4.8 193.8 50.1 3.9 48 229.46 81.79 2.8 218.8 45.3 4.8 221.6 67.1 3.3 257.1 78.6 3.3 96 305.26 94.73 3.2 260.2 52.7 4.9 251.6 70.5 3.6 289.6 84.3 3.4
Figure 5.Average crystallite size versus M content of the cAp and the M-doped cAp nanocrystals synthesized at different times and at 80 °C using the initial Ca/M molar ratio of 9:1.
Figure 6.(a) Unit cell volume and D00.l/Dhk.0(= L/W) ratio (in the inset) as a function of the reaction time and (b) unit cell volume versus average crystal size of the undoped cAp and the M-doped cAp nanocrystals synthesized at 80°C using the initial Ca/M molar ratio of 9:1. The lines are simply included to show the tendencies.
3.6. Cytotoxicity of M-Doped cAp Nanocrystals. The toxicity of Mn2+- and Co2+-doped nanocrystals was tested in a
MTT assay on murine MS1 endothelial cells, after incubation at different concentrations ranging from 100 to 0.1 μg/mL. No significant toxicity was observed in the case of Mn2+-doped
nanoparticles at any nanoparticle concentration (Figure 8). Indeed their values were superimposable to the ones of nai ̈ve undoped cAps, and in all cases cell viability was always higher than 85%. In both cases, Mn-doped and undoped cAp nanoparticles, the low toxicity observed displayed a
dose-dependent relationship. Nanoparticles doped with Co2+
displayed a certain level of cytotoxicity, especially at the 5:5 ratio (maximum 40% at the highest concentration), but toxicity was still significantly low at the 9:1 ratio, cell survival being around 80%. Also in this case, a dose-dependent relationship was observed. Thus, since nai ̈ve undoped nanoparticles displayed already some cytotoxicity, the activity due to the doping is insignificant for Mn-doped nanoparticles and limited in the case of the Co (9:1) samples. On the other side these cells were sensitive to the toxic activity of doxorubicin, which reduced their viability to less than 40%.
4. DISCUSSION
In this work the precipitation of doped cAp nanocrystals with some divalent transition metals has been carried out by thermal decomplexing of Ca2+/M-citrate/phosphate/carbonate
solu-tions. According to our data, citrate plays different roles during the doping process. First, the use of citrate as M-complexing agent enables the preparation of metastable Ca2+/M/citrate/ phosphate/carbonate solutions at slightly basic pH that can be easily destabilized by increasing the temperature, thus releasing the M ions and leading to the precipitation of almost monodisperse M-doped cAp nanoparticles. Second, owing to the different stability of the M-citrate complexes (M = Mn2+,
Co2+, and Ni2+) and its dependence with temperature, citrate controls the activity of hydrated cations in solution and therefore the extension of the doping process. Third, citrate protects the M ions against oxidation in solution as well as those present in the outermost layer of doped nanocrystals.
During the doping process M substitutes Ca positions in the cAp structure. We do not have enough data to properly assign the substitution either in Ca(I) or Ca(II) positions, since these Figure 7.TEM micrographs of doped-Ap crystallized after 96 h: (a)
Mn (9:1); (b) Co (9:1); and (c) Ni (9:1). Insets show the SAED pattern and the point analysis collected for each sample.
Table 3. Mean length (L), width (W), and aspect ratio (R) of the cAp and the M-doped cAp nanoparticles synthesized at 80°C using the initial Ca/M molar ratio of 9:1 and after a maturation time of 96 ha
sample M contentb/ % Lc/ Å Wc/ Å Rc(= L/W) D 00l/ Å Dhk0/ Å D00l/Dhk0 Mn(9:1)-96h 2.78 243± 93 47± 13 5.17± 0.66 260± 7.4 52.7± 0.21 4.93± 0.03 Co(9:1)-96h 1.73 245± 154 73± 15 3.35± 0.83 252± 3.7 70.5± 0.20 3.57± 0.02 Ni(9:1)-96h 0.12 275± 170 85± 22 3.23± 0.94 289± 4.8 84.3± 0.27 3.42± 0.02 cAp-96h 292± 107d 123± 28d 2.5± 1.0d 305± 6.2 94.7± 0.38 3.22± 0.03
aAverage size (D) of crystal domains along the [00.l] and [hk.0] directions calculated from the microstructural analysis (XRD).bTransition metal
content (w/w).cMeasured from TEM micrographs.dValues from ref13.
Figure 8.Cell viability of undoped cAp, Co-doped, and Mn-doped cAp (prepared at 80°C, crystallization time of 96 h).
two positions are not equivalent. Site Ca(I) is smaller in volume than site Ca(II). As the ionic radii of Mn2+(0.080 nm), Co2+ (0.0745 nm), and Ni2+(0.069 nm) are lower than ionic radius of calcium of site (I) (0.099 nm), by simple reasoning one can consider that Ca(I) positions are the preferred substitution site. Nevertheless, M substitution in one or another position or in both depends not only on the ionic radii but also on the number (concentration) of doping M ions and the type and amount of anions (as in this case CO32−) simultaneously
incorporated in the structure.19
Another interesting observation is the capability of all doping metals to inhibit the growth of cAp nanocrystals. The inhibiting effect of crystal growth is enhanced with the increase in M content, irrespective of the nature of the M (Figure 5). Amorphous calcium phosphates (ACP) are expected at higher M contents. The trend of yielding ACP with the increase at high levels of the M content has been also observed when hydroxyapatite was doped with other metals, i.e., Mg2+.36 Unlike other works35 reporting the precipitation of Co-hydroxyapatite particles in carboxylated free solutions in which not only smaller sizes but lower aspect ratios were found, in our experiments the average sizes decrease, whereas the aspect ratio increases due of the strongest inhibition of the growth in the (hk.0) caused by adsorption of citrate in these planes. Thisfinding proves the key role of citrate in shaping the doped nanoparticles.
The growth mechanism of biomimetic nanocrystalline apatites in the presence of citrate has been thoroughly characterized in previous papers.13,16,17Following this mecha-nism, citrate drives the growth pathway via an amorphous precursor stabilizing ACP at the early stage, controlling the amorphous to apatite transformation and the nanocrystal size by adsorption on the (10.0) face and equivalent planes. Then, citrate influences the growth of nanocrystals by a nonclassical oriented aggregation mechanism. The citrate molecule is too large to be incorporated into the cAp crystal lattice. Therefore, it remains bound to the crystal surface, preferably in the (10.0) face and equivalent faces. This occurs because Ca2+ions in the
(10.0) face, at the two different surface profiles or sublevels, (10.0)1and (10.0)2, are arranged with a spacing similar to the
distance between the centers of the carboxylate groups in citrate.14The incorporation of the studied divalent transition metals, as well as Na+ and A-, B- carbonate ions substituents
most probably takes place during the formation of the amorphous precursor and the progressive amorphous to apatite transformation (from the core to the surface hydrated layer containing the citrate and structural water molecules13). In most cases M incorporation occurred in the first 4 h of the experiment, and then the amount of M was kept constant, while in the case of Co2+ (Figure 2) the M content increased with
time, likely during amorphous to cAp transformation, along the whole maturation period. When the M content exceeds a certain threshold (6.5 w/w% calculated in this work) the amorphous calcium phosphate becomes stable. It is worth noting the formation of Mn-doped cAp (Figure S1 of
Supporting Information), in which the content of Mn2+ after the initial precipitation period decreases instead of increasing. The release of M from the solid containing Na+and A- and
B-carbonate ion substituents must be a mechanism to facilitate charge compensation and spatial accommodation into the crystalline structure.
The in vitro cell toxicity data confirm that the chemical/ electronic modification of these nanocrystals does not
significantly affect cell viability, with the exception of the nanoparticles doped with a high ratio of Co2+. Indeed the low toxicity levels are comparable with those observed in the case of cell treatment with undoped nanoparticles. These data, taken together, demonstrate the high biocompatibility degree of these doped nanocrystals and sustain their use as possible biodegradable supports for drug delivery, possibly enhanced by active targeting mediated by probes recognizing specific cell markers.
5. CONCLUSIONS
In this paper we have studied the incorporation of Mn2+, Co2+,
and Ni2+in citrate−carbonate−apatite nanocrystals obtained by precipitation from Ca/M//citrate/phosphate//carbonate sol-utions as well as their influence on crystal growth, micro-structure, colloidal stability, and cytotoxicity of precipitated solids.
Besides its influence on the nucleation and crystal growth of biomimetic nanocrystalline apatites, already reported, citrate plays an active role also during the doping process. First, citrate acts as M-complexing agent; second, it controls the activity of hydrated M ions in solution and therefore the extension of the doping process, and third, it protects the M ions against oxidation in solution as well as in doped nanocrystals.
Different trends have been found during our study. First, the growth of nanocrystals is clearly enhanced when temperature is increased and M content is decreased. Second, for similar crystallization conditions the amount of M incorporated normally follows the order Mn2+ > Co2+> Ni2+. Third, the higher the M content, the higher is the aspect ratio (L/W) of M-doped compared to undoped cAp nanoparticles. Fourth, when the M content is higher than 6.5 w/w%, the crystallinity (long-range order) of the nanoapatites is lost. Fifth, the colloidal stability of nanoaparticles suspensions decreased in the order: undoped, Mn-, Ni-, and Co-doped cAp. Moreover, the cytotoxicity evaluation revealed that the produced Mn- and Co-doped cAp are highly biocompatible at doses comparable to those of undoped cAp, with the exception of those nano-particles doped with the higher Co2+ content at the higher doses.
■
ASSOCIATED CONTENT*
S Supporting InformationThe Supporting Information is available free of charge on the
ACS Publications websiteat DOI:10.1021/acs.cgd.5b01045. Table S1: Elemental content of Ca, P, Na, Mn, Co, and Ni (% w/w) in the different samples measured by ICP-OES. Table S2: Molar composition of the cationic content in the cAp structure, according to the following formula: Ca5‑x‑y Na2x My. Table S3: Average size (D) of
crystal domains along the [00l] and [hk0] directions, calculated from the microstructural analysis, for all the samples analyzed by PXRD. Table S4: Cell parameters and volume of the hexagonal unit cells of all the samples measured by PXRD. Table S5: Concentrations (mol/L) of the aqueous species considered in the calculations of the activities in Phreeqc. Figure S1) Transition metal content (w/w%) of doped nanoapatites crystallized at Ca/M = 9:1, 37°C and Ca/M = 5:5, 80 °C. Figure S2: FTIR spectra of the sample Mn(9:1)-96h-80°C at RT, before and after washing with 0.1 M NaOH solution. Figure S3: Diffractograms of crystallized doped Ap
nanoparticles. Figure S4: Crystal growth of M-doped cAp nanoparticles versus crystallization time. Figure S5: TEM micrograph of the Mn(5:5)-Ap-96h-80 °C sample. Figure S6: (a) Strain versus crystallization time, and (b) strain versus average crystal size. Figure S7: Calculated ionic activities of Ca(citrate)−, M-citrate complexes and of the free solvated cations as a function of the temperature, for the (5:5) initial Ca/M molar ratio (PDF)
■
AUTHOR INFORMATION Corresponding Authors *(F.J.M.-C.) E-mail:[email protected]. *(J.G.-M.) E-mail:[email protected]. NotesThe authors declare no competingfinancial interest.
■
ACKNOWLEDGMENTSWe greatly acknowledge the project Crysfunbio MAT2011-28543 supported by Spanish MINECO and cofunded by FEDER. F.J.M.C. also acknowledges CSIC for his JAE-DOC contract cofunded by European Social Fund. C.M.-B. thanks the ACIISI (Gobierno de Canarias) for a predoctoral fellowship.
■
REFERENCES(1) Gómez-Morales, J.; Iafisco, M.; Delgado-López, J. M.; Sarda, S.; Drouet, C. Prog. Cryst. Growth Charact. Mater. 2013, 59, 1−46.
(2) Iafisco, M.; Margiotta, N. J. Inorg. Biochem. 2012, 117, 237−247. (3) Gruselle, M. J. Organomet. Chem. 2015, 793, 93.
(4) Liu, R.; Lal, R. Sci. Rep. 2014, 4, 5686.
(5) Zhou, H.; Lee, J. Acta Biomater. 2011, 7, 2769−2781. (6) Cai, Y.; Tang, R. J. Mater. Chem. 2008, 18, 3775−3787. (7) Uskoković, V.; Uskoković, D. P.J. Biomed. Mater. Res. B Appl. Biomater. 2011, 96B, 152−191.
(8) Ferraz, M. P.; Monteiro, F. J.; Manuel, C. M. J. Appl. Biomater. Biomech. 2004, 2, 74−80.
(9) Dorozhkin, S. V. Acta Biomater. 2010, 6, 715−734.
(10) Sadat-Shojai, M.; Khorasani, M.-T.; Dinpanah-Khoshdargi, E.; Jamshidi, A. Acta Biomater. 2013, 9, 7591−7621.
(11) Bleek, K.; Taubert, A. Acta Biomater. 2013, 9, 6283−6321. (12) Newcomb, C. J.; Bitton, R.; Velichko, Y. S.; Snead, M. L.; Stupp, S. I. Small 2012, 8, 2195−2202.
(13) Delgado-López, J. M.; Iafisco, M.; Rodríguez, I.; Prat, M.; Gómez-Morales, J.; Tampieri, A. Acta Biomater. 2012, 8, 3491−3499. (14) Hu, Y.-Y.; Rawal, A.; Schmidt-Rohr, K. Proc. Natl. Acad. Sci. U. S. A. 2010, 107, 22425−22429.
(15) López-Macipe, A.; Gómez-Morales, J.; Rodríguez-Clemente, R. Adv. Mater. 1998, 10, 49−53.
(16) Delgado-López, J. M.; Frison, R.; Cervellino, A.; Gómez-Morales, J.; Guagliardi, A.; Masciocchi, N. Adv. Funct. Mater. 2014, 24, 1090−1099.
(17) Iafisco, M.; Ramírez-Rodríguez, G. B.; Sakhno, Y.; Tampieri, A.; Martra, G.; Gómez-Morales, J.; Delgado-López, J. M. CrystEngComm 2015, 17, 507−511.
(18) Rodríguez-Ruiz, I.; Delgado-López, J. M.; Durán-Olivencia, M. A.; Iafisco, M.; Tampieri, A.; Colangelo, D.; Prat, M.; Gómez-Morales, J. Langmuir 2013, 29, 8213−8221.
(19) Šupová, M. Ceram. Int. 2015, 41, 9203−9231.
(20) Kolmas, J.; Groszyk, E.; Kwiatkowska-Rózýcka, D. BioMed Res. Int. 2014, 2014, No. 178123.
(21) Burnell, J.; Teubner, E.; Miller, A. Calcif. Tissue Int. 1980, 31, 13−19.
(22) Boanini, E.; Gazzano, M.; Bigi, A. Acta Biomater. 2010, 6, 1882− 1894.
(23) Mayer, I.; Jacobsohn, O.; Niazov, T.; Werckmann, J.; Iliescu, M.; Richard Plouet, M.; Burghaus, O.; Reinen, D. Eur. J. Inorg. Chem. 2003, 2003, 1445−1451.
(24) Tank, K. P.; Chudasama, K. S.; Thaker, V. S.; Joshi, M. J. J. Nanopart. Res. 2013, 15, 1644−1655.
(25) Ignjatović, N.; Ajduković, Z.; Savić, V.; Najman, S.; Mihailović, D.; Vasiljević, P.; Stojanović, Z.; Uskoković, V.; Uskoković, D. J. Mater. Sci.: Mater. Med. 2013, 24, 343−354.
(26) Finiels, A.; Fajula, F.; Hulea, V. Catal. Sci. Technol. 2014, 4, 2412−2426.
(27) Chan, F. L.; Tanksale, A. Renewable Sustainable Energy Rev. 2014, 38, 428−438.
(28) Gruselle, M. J. Organomet. Chem. 2015, 793, 93−101. (29) Boukha, Z.; Kacimi, M.; Pereira, M. F. R.; Faria, J. L.; Figueiredo, J. L.; Ziyad, M. Appl. Catal., A 2007, 317, 299−309.
(30) Parkhurst, D. L.; Appelo, C. A. J. in U.S. Geological Survey Techniques and Methods 2013, Book 6, Chapter A43, 497 pp, available only athttp://pubs.usgs.gov/tm/06/a43/.
(31) (a) Rodríguez-Carvajal, J. Phys. B Condens. Matter 1993, 192, 55−69. (b) Rodríguez-Carvajal, J. Commission on Powder Diffraction (IUCr) Newsl. 2001, 26, 12.
(32) Iafisco, M.; Marchetti, M.; Gómez-Morales, J.; Hernández-Hernández, M. A.; García-Ruiz, J. M.; Roveri, N. Cryst. Growth Des. 2009, 9 (11), 4912−4921.
(33) Boultif, A.; Louer, D. J. Appl. Crystallogr. 2004, 37, 724−731. (34) Wilson, R. M.; Elliott, J. C.; Dowker, S. E. P.; Smith, R. I. Biomaterials 2004, 25, 2205−2213.
(35) Veselinovic, L.; Karanovic, L.; Stojanovic, Z.; Bračko, I.; Markovic, S.; Ignjatovic, N.; Uskokovic, D. J. Appl. Crystallogr. 2010, 43, 320−327.
(36) Tampieri, A.; Celotti, G.; Landi, E.; Sandri, M. Key Eng. Mater. 2004, 264−268, 2051−2054.

![Table 2. Average size ( D) of crystal domains along the [00.l] and [hk.0] directions of cAp and M-doped cAp nanocrystals synthesized at 80 °C using the initial Ca/M molar ratio of 9:1](https://thumb-eu.123doks.com/thumbv2/123dokorg/4921107.51302/6.938.90.469.147.586/table-average-crystal-domains-directions-nanocrystals-synthesized-initial.webp)

