Circulating VEGF and eNOS
variations as predictors of outcome
in metastatic colorectal cancer
patients receiving bevacizumab
Giorgia Marisi
1, Emanuela Scarpi
2, Alessandro Passardi
3, Oriana Nanni
2, Angela Ragazzini
2,
Martina Valgiusti
3, Andrea Casadei Gardini
3, Luca Maria Neri
4, Giovanni Luca Frassineti
3, Dino
Amadori
3& Paola Ulivi
1Novel predictive biomarkers are needed to improve patient selection and optimize the use of bevacizumab (B) in metastatic colorectal cancer. We analyzed the potential of five circulating biomarkers to predict B efficacy and monitor response. Peripheral blood samples collected at baseline, at the first clinical evaluation and at progression were available for 129 patients enrolled in the prospective multicentric ITACa trial and randomized to receive FOLFOX4/FOLFIRI (CT) with (64 patients) or without B (65 patients). VEGF-A, eNOS, EPHB4, COX2 and HIF-1α mRNA levels were measured by qRT-PCR. Baseline marker expression levels and their modulation during therapy were analyzed in relation to objective response, progression-free survival and overall survival (OS). VEGF and eNOS expression was significantly correlated in both groups (Spearman’s correlation coefficient = 0.80; P < 0.0001 and 0.75; P < 0.0001, respectively). B-treated patients with >30% reduction in eNOS and VEGF levels from baseline to the first clinical evaluation showed better OS than the others (median OS 31.6 months, 95% CI 21.3–49.5 months and median OS 14.4 months, 95% CI 9.0–22.7 months, respectively, HR 0.38, 95% CI 0.19–0.78, P = 0.008). A reduction in eNOS and VEGF expression from baseline to the first clinical evaluation may indicate a response to B.
Bevacizumab (B), a humanized monoclonal antibody targeting vascular endothelial growth factor (VEGF-A), has proven clinical efficacy when used in first- or second-line treatment in association with fluorouracil-based chemotherapy (CT) in metastatic colorectal cancer patients (mCRC)1–3. To date there are no predictive
biomark-ers capable of identifying patients who are most likely to benefit from this treatment4. Plasma or serum
con-centrations of baseline VEGF-A have been analyzed in relation to drug efficacy, but with contrasting results5–8.
Pretreatment total circulating VEGF-A seems to be prognostic for outcome in mCRC patients, but a predictive role for B efficacy has yet to be demonstrated5, 9. An increase in serum VEGF-A concentration after an initial
decrease has been proposed as a predictive marker of poor response and of reactive resistance to chemotherapy plus B10.
We previously described the role of endothelial nitric oxide synthase (eNOS) polymorphisms as possible pre-dictive biomarkers of B efficacy11 in patients enrolled in the ITACa (Italian Trial in Advanced Colorectal Cancer)
trial, a prospective randomized phase III multicentric study designed to investigate the role of B treatment in mCRC patients12. In particular, patients carrying a specific haplotype combination of 2 eNOS polymorphisms
(eNOS + 894 G/T and eNOS VNTR 4a/b) showed significantly longer progression-free survival (PFS) and overall survival (OS) and a higher overall response rate (ORR) than those with other genotypes11.
1Biosciences Laboratory, Istituto Scientifico Romagnolo per lo Studio e Cura dei Tumori (IRST) IRCCS, via P.
Maroncelli, 40, 47014, Meldola, Italy. 2Unit of Biostatistics and Clinical Trials, Istituto Scientifico Romagnolo per lo
Studio e Cura dei Tumori (IRST) IRCCS, via P. Maroncelli, 40, 47014, Meldola, Italy. 3Department of Medical Oncology,
Istituto Scientifico Romagnolo per lo Studio e Cura dei Tumori (IRST) IRCCS, via P. Maroncelli, 40, 47014, Meldola, Italy. 4Department of Morphology, Surgery and Experimental Medicine, University of Ferrara, via Fossato di Mortara
70, 44100, Ferrara, Italy. Correspondence and requests for materials should be addressed to P.U. (email: paola.ulivi@ irst.emr.it)
Received: 7 October 2016 Accepted: 29 March 2017 Published: xx xx xxxx
eNOS is a constitutively expressed gene in the endothelium involved in the production of nitric oxide (NO),
which plays a central role in maintaining endothelial cell functional integrity, regulating hemodynamics, and establishing collateral circulation13, 14.
The expression of other biomarkers seems to be correlated with B response. Patients with low ephrin type-B receptor 4 (EPHB4) mRNA levels in tumor tissue have a higher response to B than those with high levels15.
EPHB4 belongs to a large family of receptor tyrosine kinases and mediates arteriovenous differentiation during embryonic development, regulating induction and maturation of newly forming vessels in the adult in both phys-iological and pathological conditions15–17.
Other factors are hypothesized to play a role in determining B sensitivity or resistance. Cyclooxygenase-2 (COX2) is a key enzyme for inflammatory cytokine-induced angiogenesis18 whose expression levels may
conse-quently influence B activity. Moreover, as hypoxia represents an important event during anti-angiogenic therapy, hypoxia inducible factor 1 alpha (HIF-1α) may represent an important prognostic factor during B treatment.
We measured the blood circulating mRNA expression of VEGF-A, eNOS, EPHB4, COX2 and HIF-1α to study the predictive role of these markers at baseline and to monitor B efficacy during treatment.
Results
Patient characteristics.
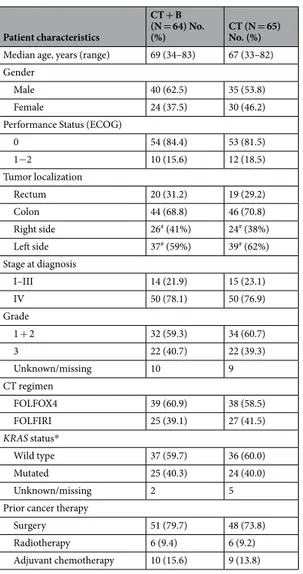
The clinical-pathologic characteristics of patients enrolled in the CT + B or CT groups are shown in Table 1. Median age was 69 (range 34–83) and 67 years (range 33–82), respectively. Baseline patient characteristics were well balanced between groups. One hundred patients had liver metastases (35 had liver metastases only and 65 also had extra-hepatic lesions). The remaining 29 patients had only extra-hepatic lesions. Median PFS and OS of CT + B patients were 9.6 months (95% confidence intervals [CI], 8.3–12.4) and 21.4 months (95% CI, 13.9–28.8), respectively, while median PFS and OS of CT patients were 9.1 months (95% CI, 8.3–10.4) and 24 months (95% CI, 18.5–28.0), respectively. With regard to tumor localization, 50 patients had a right-side tumor and 76 a left-side tumor. Within the right-side group, PFS was significantly higher in CT + B patients (12.6 months [95% CI, 8.6–16.0]) compared to CT patients (9.0 months [95% CI, 5.1–10.3] (P = 0.020).Patient characteristics
CT + B (N = 64) No.
(%) CT (N = 65) No. (%) Median age, years (range) 69 (34–83) 67 (33–82) Gender
Male 40 (62.5) 35 (53.8)
Female 24 (37.5) 30 (46.2)
Performance Status (ECOG)
0 54 (84.4) 53 (81.5) 1−2 10 (15.6) 12 (18.5) Tumor localization Rectum 20 (31.2) 19 (29.2) Colon 44 (68.8) 46 (70.8) Right side 26# (41%) 24# (38%) Left side 37# (59%) 39# (62%) Stage at diagnosis I–III 14 (21.9) 15 (23.1) IV 50 (78.1) 50 (76.9) Grade 1 + 2 32 (59.3) 34 (60.7) 3 22 (40.7) 22 (39.3) Unknown/missing 10 9 CT regimen FOLFOX4 39 (60.9) 38 (58.5) FOLFIRI 25 (39.1) 27 (41.5) KRAS status* Wild type 37 (59.7) 36 (60.0) Mutated 25 (40.3) 24 (40.0) Unknown/missing 2 5
Prior cancer therapy
Surgery 51 (79.7) 48 (73.8)
Radiotherapy 6 (9.4) 6 (9.2)
Adjuvant chemotherapy 10 (15.6) 9 (13.8)
Table 1. Patient characteristics. CT, chemotherapy; B, bevacizumab. *Required by amendment no. 1 of 3rd May
2009; #Information about which side of the colon was involved was not available for one patient in the CT + B
The difference was evident but not significant with regard to OS (27.5 months [95% CI, 15.9–35.7] for CT + B
vs. 20.3 months [95% CI, 12.1–24.5] for CT) (P = 0.173). No differences were seen in the group of patients with a
left-side tumor. Median PFS and OS of the entire population were 9.3 months (95% CI, 8.9–10.4) and 22.7 months (95% CI, 18.8–27.1), respectively. Median follow-up was 52 months (range 1–77).
Baseline circulating levels of VEGF, eNOS, EPHB4, COX2 and HIF-1α with respect to patient
outcome.
No significant correlation was found between the main clinical-pathologic characteristics of patients and median baseline biomarker levels (Supplementary Table S1). There were 37 responders and 25 non responders in the CT + B arm, and 38 responders and 27 non responders in the CT group. No statistically sig-nificant differences were seen between the median baseline biomarker levels of responders and non responders (Supplementary Table S2). Furthermore, there were no substantial differences observed between baseline values and PFS and OS (Supplementary Table S3).Circulating biomarker variations during treatment in relation to treatment response.
We ana-lyzed the variation in circulating levels of the 5 biomarkers from baseline to the first clinical evaluation. Within the B group, patients with >30% reduction in EPHB4 levels showed a higher rate of response (complete or par-tial response) than those with no variation. In particular, 24 (75%) of the 32 responders had >30% reduction in EPHB4 levels compared to 9 out of 19 (47%) non-responders (P = 0.048). We also observed a trend towards significance in the control group (P = 0.064). No substantial differences were seen between other biomarkers and response.Circulating biomarker variations during treatment in relation to patient survival.
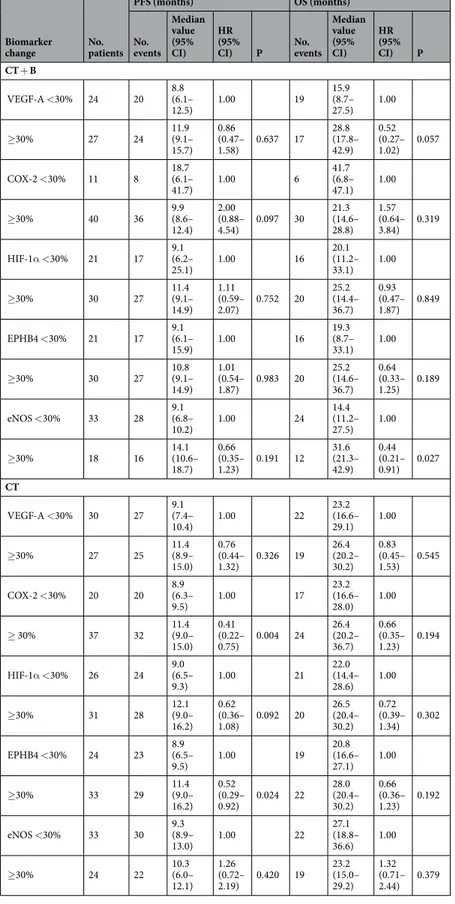
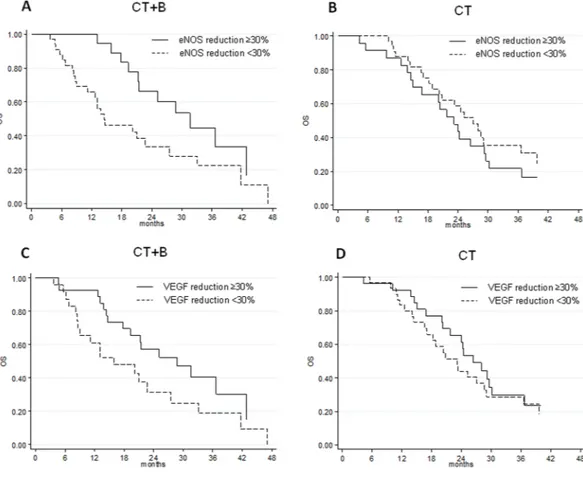
We evaluated PFS and OS on the basis of circulating biomarker changes from baseline to the first clinical evaluation. No signif-icant differences were observed with respect to PFS. Patients in the B group with ≥30% reduction in eNOS levels showed a longer OS than those with <30% reduction (median OS 31.6 months, 95% CI 21.3–42.9 months vs.14.4 months, 95% CI 11.2–27.5 months, respectively; hazard ratio [HR 0.44], 95% CI 0.21–0.91, P = 0.027) (Table 2and Fig. 1A,B). Patients in the same arm with >30% reduction in VEGF levels had a better OS than those with <30% reduction (median OS 28.8 months, 95% CI 17.8–42.9 months vs. 15.9 months, 95% CI 8.7–27.5, respec-tively; HR 0.52, 95% CI 0.27–1.02, P = 0.057) (Table 2 and Fig. 1C,D).
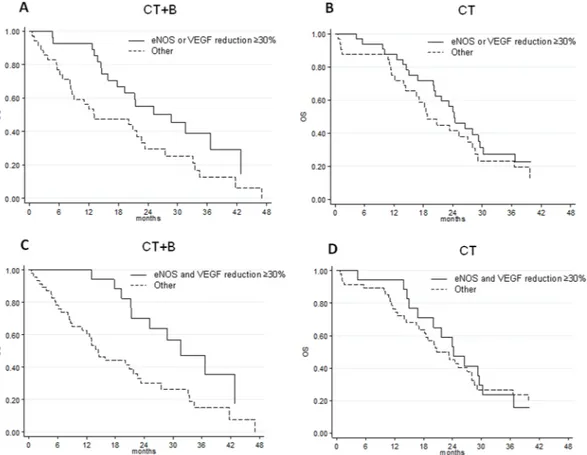
Expression levels of VEGF and eNOS were significantly correlated in both CT + B- and CT groups (Spearman’s correlation coefficient = 0.80, P < 0.0001 vs. 0.75, P < 0.0001, respectively). However, in the B group, patients with >30% reduction in eNOS or VEGF levels showed a longer OS than the others without this reduction (median OS 28.8 months, 95% CI 15.9–42.9 vs. 13.1 months, 95% CI 8.2–22.7, respectively; HR 0.50, 95% CI 0.27–0.91, P = 0.023), (Table 3 and Fig. 2A,B).
B-treated patients with >30% reduction in both eNOS and VEGF levels showed longer OS than other patients (median OS 31.6 months, 95% CI 21.3–49.5 vs. 14.4 months, 95% CI 9.0–22.7, respectively; HR 0.38, 95% CI 0.19–0.78, P = 0.008) (Table 3 and Fig. 2C,D). No significant differences were observed in terms of PFS. Furthermore, there were no substantial changes in biomarkers expression levels from baseline to progression (data not shown).
Discussion
In this study we analyzed the circulating mRNA expression of 5 biomarkers, evaluated at baseline and during B treatment, to investigate their potential predictive role. We found that baseline circulating levels of biomarkers were not associated with clinical outcome, whereas >30% reduction in eNOS or VEGF levels from baseline to the first evaluation was associated with longer OS than in patients with <30% or no reduction. With regard to the 3 other biomarkers analyzed (HIF-1α, EPHB4 and COX-2), no significant correlations were seen between their variations during treatment and patient outcome.
Circulating markers offer a number of advantages over tissue-based markers, including the possibility of car-rying out continuous and noninvasive assessments over time19, 20. VEGF is the most widely studied biomarker for
predicting response to antiangiogenic treatment21, 22. An association between the efficacy of antiangiogenic
treat-ments and VEGF tumor levels has been reported in several studies, with contrasting results19, 23, 24. VEGF plasma
levels at baseline have shown prognostic value and have been correlated with metastatic potential and extension of colorectal cancer5, 25, 26. However, as VEGF values are dynamic, their change during treatment may be even
more relevant than at baseline and could be used as a surrogate biomarker to predict response and progression27.
This is in agreement with data published data by Gordon et al. who described a reduction in free serum VEGF levels in cancer patients treated with escalating doses of an anti-VEGF antibody compared to baseline serum concentrations28.
Similarly, Loupakis et al. showed that free VEGF levels measured after immunodepletion of plasma samples significantly decreased from baseline to day 14 among mCRC patients receiving B, suggesting that the anti-VEGF antibody effectively reduced the plasma level of the biologically active growth factor29. Conversely, other authors
reported an increase in VEGF after treatment with B8. This discrepancy could be due to the different assays used
and to the lack of discrimination between free and B-bound VEGF. We measured VEGF mRNA circulating levels and found that patients with a reduction in VEGF mRNA levels after B showed a better clinical outcome.
The novelty of our work lies in the measurement of eNOS levels at baseline and during treatment with a B-based therapy. As observed for VEGF levels, a >30% reduction in eNOS levels was associated with a better prognosis. Moreover, patients showing >30% reduction in both VEGF and eNOS levels showed longer sur-vival, suggesting that the inhibition of both proteins indicates a better response to the antiangiogenic treat-ment. Interestingly, no significant association with survival was found in the CT-only group, reinforcing the predictive value of a reduction in biomarker levels in relation to B efficacy. Given that these two biomarkers were
Biomarker
change No. patients
PFS (months) OS (months) No. events Median value (95% CI) HR (95%
CI) P No. events Median value (95% CI) HR (95% CI) P CT + B VEGF-A <30% 24 20 8.8 (6.1– 12.5) 1.00 19 15.9 (8.7– 27.5) 1.00 ≥30% 27 24 11.9 (9.1– 15.7) 0.86 (0.47– 1.58) 0.637 17 28.8 (17.8– 42.9) 0.52 (0.27– 1.02) 0.057 COX-2 <30% 11 8 18.7 (6.1– 41.7) 1.00 6 41.7 (6.8– 47.1) 1.00 ≥30% 40 36 9.9 (8.6– 12.4) 2.00 (0.88– 4.54) 0.097 30 21.3 (14.6– 28.8) 1.57 (0.64– 3.84) 0.319 HIF-1α <30% 21 17 9.1 (6.2– 25.1) 1.00 16 20.1 (11.2– 33.1) 1.00 ≥30% 30 27 11.4 (9.1– 14.9) 1.11 (0.59– 2.07) 0.752 20 25.2 (14.4– 36.7) 0.93 (0.47– 1.87) 0.849 EPHB4 <30% 21 17 9.1 (6.1– 15.9) 1.00 16 19.3 (8.7– 33.1) 1.00 ≥30% 30 27 10.8 (9.1– 14.9) 1.01 (0.54– 1.87) 0.983 20 25.2 (14.6– 36.7) 0.64 (0.33– 1.25) 0.189 eNOS <30% 33 28 9.1 (6.8– 10.2) 1.00 24 14.4 (11.2– 27.5) 1.00 ≥30% 18 16 14.1 (10.6– 18.7) 0.66 (0.35– 1.23) 0.191 12 31.6 (21.3– 42.9) 0.44 (0.21– 0.91) 0.027 CT VEGF-A <30% 30 27 9.1 (7.4– 10.4) 1.00 22 23.2 (16.6– 29.1) 1.00 ≥30% 27 25 11.4 (8.9– 15.0) 0.76 (0.44– 1.32) 0.326 19 26.4 (20.2– 30.2) 0.83 (0.45– 1.53) 0.545 COX-2 <30% 20 20 8.9 (6.3– 9.5) 1.00 17 23.2 (16.6– 28.0) 1.00 ≥ 30% 37 32 11.4 (9.0– 15.0) 0.41 (0.22– 0.75) 0.004 24 26.4 (20.2– 36.7) 0.66 (0.35– 1.23) 0.194 HIF-1α <30% 26 24 9.0 (6.5– 9.3) 1.00 21 22.0 (14.4– 28.6) 1.00 ≥30% 31 28 12.1 (9.0– 16.2) 0.62 (0.36– 1.08) 0.092 20 26.5 (20.4– 30.2) 0.72 (0.39– 1.34) 0.302 EPHB4 <30% 24 23 8.9 (6.5– 9.5) 1.00 19 20.8 (16.6– 27.1) 1.00 ≥30% 33 29 11.4 (9.0– 16.2) 0.52 (0.29– 0.92) 0.024 22 28.0 (20.4– 30.2) 0.66 (0.36– 1.23) 0.192 eNOS <30% 33 30 9.3 (8.9– 13.0) 1.00 22 27.1 (18.8– 36.6) 1.00 ≥30% 24 22 10.3 (6.0– 12.1) 1.26 (0.72– 2.19) 0.420 19 23.2 (15.0– 29.2) 1.32 (0.71– 2.44) 0.379
Table 2. PFS and OS with respect to changes in biomarker levels from baseline to first clinical evaluation.
PFS, progression-free survival; OS, overall survival; CT, chemotherapy; B, bevacizumab; HR, hazard ratio; CI, confidence interval.
Figure 1. Patient flow diagram. No. patients PFS (months) OS (months) No. events Median PFS (95% CI) HR (95%
CI) P No. events Median OS (95% CI) HR (95% CI) P CT + B Other 23 19 8.1 (4.5– 10.2) 1.00 18 13.1 (8.2– 22.7) 1.00 eNOS or VEGF reduction ≥ 30% 28 25 11.9 (9.2– 15.9) 0.68 (0.40– 1.16) 0.161 18 28.8 (15.9– 42.9) 0.50 (0.27– 0.91) 0.023 Other 34 29 9.0 (6.1– 10.2) 1.00 25 14.4 (9.0– 22.7) 1.00 eNOS and VEGF
reduction ≥30% 17 15 12.6 (9.2– 22.3) 0.59 (0.32– 1.07) 0.083 11 31.6 (21.3– 49.5) 0.38 (0.19– 0.78) 0.008 CT Other 24 21 9.1 (7.4– 10.0) 1.00 17 18.8 (14.0– 28.0) 1.00 eNOS or VEGF reduction ≥30% 33 31 10.3 (7.2– 12.2) 0.90 (0.54– 1.50) 0.696 24 24.3 (20.0– 29.6) 0.76 (0.43– 1.34) 0.342 Other 39 36 9.0 (7.4– 9.6) 1.00 27 20.8 (17.1– 28.0) 1.00 eNOS and VEGF
reduction ≥30% 18 16 11.4 (8.9– 15.0) 0.79 (0.45– 1.41) 0.430 14 24.3 (15.0– 30.2) 0.89 (0.48– 1.65) 0.705
Table 3. Reduction in eNOS and/or VEGF levels with respect to PFS/OS. PFS, progression-free survival; OS,
significantly correlated with each other and that their reduction was associated with better outcome, we can hypothesized that the VEGF-VEGFR-eNOS pathway may be involved in the response to B-based therapy.
In a previous work we demonstrated that a specific eNOS haplotype combination (defined as eNOS Haplo1/ Haplo1 and eNOS Haplo 2/Haplo2) was associated with a favorable outcome in terms of ORR, PFS and OS in mCRC patients treated with B11. We also evaluated eNOS level changes with respect to different eNOS genotypes.
A substantial percentage of patients carrying the eNOS haplotype combination responded to B-based therapy, a high number of these showing >30% reduction in eNOS levels. Conversely, fewer than half of the patients car-rying other eNOS genotypes responded to treatment, and a small number of these also showed >30% reduction in eNOS levels (data not shown). These findings are suggestive of the potential role of eNOS pathway during B treatment.
Our study is somewhat limited by its small sample size and requires further validation in a prospective, inde-pendent and larger case series. However, the results were obtained on a prospectively enrolled patient population treated homogeneously in a randomized, prospective phase III multicenter study (ITACa trial) featuring two treatment arms: CT + B vs. CT only.
In conclusion, mCRC patients with a concomitant reduction in VEGF and eNOS biomarker levels showed a better outcome to treatment, indicating that these biomarkers might be useful to monitor B efficacy.
Methods
Patients and sample collection.
This study included patients enrolled in the ITACa clinical trial12.Participation in the ITACa biological study was not mandatory for those taking part in the clinical trial. Of the 376 patients with mCRC enrolled in the ITACa trial, 129 had sufficient blood samples to be considered for this planned secondary analysis. Inclusion criteria, the randomization strategy and clinical results are described elsewhere12. Patients were randomized to receive first-line CT (FOLFOX4 or FOLFIRI) only or CT + B. CT + B
doses and treatment details can be found in the original study article12. Sixty-four patients received CT + B
and 65 patients received CT only (control group). Peripheral blood samples were collected in PAXgene tubes (PreAnalytix-Qiagen, Hilden, Germany) at various time points during the trial: at baseline (before the start of treatment), at the first evaluation (about 2 months later) and at disease progression (PD). Blood samples for 129 patients were available for analysis at baseline, for 108 (84%) at the first clinical evaluation and for 77 (60%) at PD (Fig. 3). Data were collected in accordance with good clinical practice.
All patients were evaluated for response, PFS and OS, in accordance with RECIST criteria version 1.1. Tumor response was assessed every 8 weeks by computed tomography. Responders included patients who obtained a complete response (CR) or partial response (PR). Non responders included those with stable disease (SD) or PD. The study was approved by the Local Ethics Committee (Ethics Committee Area Vasta Romagna and IRST) and
Figure 2. OS with respect to reduction in eNOS levels in CT + B (A) and CT (B) groups, and with respect to
informed consent for the use of biological material for research purposes was obtained from all patients before blood sample collection. The study was approved by the Local Ethics Committee (Ethics Committee Area Vasta Romagna and IRST) and informed consent for the use of biological material for research purposes was obtained from all patients before blood sample collection. All samples were collected in accordance with relevant guide-lines and regulations.
RNA extraction and amplification.
Analyses of VEGF-A, COX2, HIF-1α, EPHB4 and eNOS were performed by biologists blinded to patient outcome. Total RNA was extracted by PAX-Gene blood RNA kit (PreAnalytix-Qiagen, Hilden, Germany) and RNA was treated with DNAse I. Five hundred nanograms of RNA were reverse-transcribed using the iScript cDNA Synthesis Kit (Bio-Rad, Hercules, CA, USA). The final reverse transcription mixture was incubated at 25 °C for 5 min, at 42 °C for 30 min and at 85 °C for 5 min. Real-time PCR was performed using the 7500 Applied Biosystems and TaqMan assay chemistry (Gene expression Assay, Applied Biosystems, Foster City, CA, USA). Two stably expressed endogenous β2-microglobulin (B2M) and hypoxanthinephosphoribosyltransferase 1 (HPRT1) genes were selected by Genorm software v. 3.230 and were amplified and
used as reference genes. All the RT-PCR experiments were run in duplicate.
Statistical analysis.
Gene expression analyses were performed by Applied Biosystems qPCR software. mRNA levels were normalized to endogenous reference B2M and HPRT genes. We used a healthy donor as cali-brator. Relative quantification was calculated by the 2-delta delta Ct method. The aims of this planned secondary analysis were to examine the association between baseline circulating mRNA expression of VEGF-A, eNOS, EPHB4, COX2 and HIF-1α and PFS and OS in the ITACa population, and to investigate their variation during treatment in order to monitor B efficacy. We chose the median value of variation in the case series (30%) as the cut-off.The primary aim of the ITACa study was PFS. Secondary efficacy endpoints were ORR and OS. PFS was calculated as the time from the date of randomization to the date of the first observation of PD (per investigator assessment), last tumor evaluation or death in the absence of progressive disease. Patients undergoing curative metastasectomy were censored at the time of surgery. OS was calculated as the time from the date of randomiza-tion to the date of death from any cause or last follow-up.
Descriptive statistics were used to describe enrolled patients. The relationship between baseline mRNA expression of VEGF-A, eNOS, EPHB4, COX2 and HIF-1α and clinical-pathologic factors was analyzed using a nonparametric ranking statistic (Median test). Spearman’s correlation coefficient was used to investigate the relationship between the mRNA levels considered as continuous variables.
Time to event data (PFS, OS) were described using the Kaplan-Meier method and compared using the log rank test (at a significance level of 5%). 95% CIs were calculated by nonparametric methods. Estimated HRs and their 95% CI were calculated by the Cox regression model. We also conducted landmark analysis to reduce the potential for time-dependent confounding in treatment by assessing the impact of changes in mRNA levels from baseline to the first tumor evaluation (about 2 months after the start of treatment) on survival outcome. Patients
Figure 3. OS with respect to reduced eNOS or VEGF levels and reduced eNOS and VEGF levels in patients
who were still alive and had not been lost to follow-up at the landmark time were divided into two categories on the basis of whether they had progressed or not by that time. PFS and OS after the landmark time were computed with Kaplan-Meier curves.
The correlation between circulating mRNA expression of VEGF-A, eNOS, EPHB4, COX2 and HIF-1α and clinical outcome was analyzed separately in each treatment group (CT + B and CT). All P-values were based on two-sided testing and statistical analyses were carried out using SAS statistical software version 9.4 (SAS Institute, Cary, NC, USA).
References
1. Hurwitz, H. et al. Bevacizumab plus irinotecan, fluorouracil, and leucovorin for metastatic colorectal cancer. N. Engl. J. Med. 350, 2335–2342, doi:10.1056/NEJMoa032691 (2004).
2. Saltz, L. B. et al. Bevacizumab in combination with oxaliplatin-based chemotherapy as first-line therapy in metastatic colorectal cancer: a randomized phase III study. J. Clin. Oncol. 26, 2013–2019, doi:10.1200/JCO.2007.14.9930 (2008).
3. Hochster, H. S. et al. Safety and efficacy of oxaliplatin and fluoropyrimidine regimens with or without bevacizumab as first-line treatment of metastatic colorectal cancer: results of the TREE Study. J. Clin. Oncol. 26, 3523–3529, doi:10.1200/JCO.2007.15.4138
(2008).
4. Ciombor, K. K. & Berlin, J. Targeting metastatic colorectal cancer - present and emerging treatment options. Pharmgenomics Pers.
Med. 7, 137–144, doi:10.2147/PGPM.S47582 (2014).
5. Hegde, P. S. et al. Predictive impact of circulating vascular endothelial growth factor in four phase III trials evaluating bevacizumab.
Clin. Cancer Res. 19, 929–937, doi:10.1158/1078-0432.CCR-12-2535 (2013).
6. Kopetz, S. et al. Phase II trial of infusional fluorouracil, irinotecan, and bevacizumab for metastatic colorectal cancer: efficacy and circulating angiogenic biomarkers associated with therapeutic resistance. J. Clin. Oncol. 28, 453–459, doi:10.1200/JCO.2009.24.8252
(2010).
7. Loupakis, F. et al. Pharmacodynamic and pharmacogenetic angiogenesis-related markers of first-line FOLFOXIRI plus bevacizumab schedule in metastatic colorectal cancer. Br. J. Cancer 104, 1262–1269, doi:10.1038/bjc.2011.85 (2011).
8. Willett, C. G. et al. Efficacy, safety, and biomarkers of neoadjuvant bevacizumab, radiation therapy, and fluorouracil in rectal cancer: a multidisciplinary phase II study. J. Clin. Oncol. 27, 3020–3026, doi:10.1200/JCO.2008.21.1771 (2009).
9. Luo, H. Y. & Xu, R. H. Predictive and prognostic biomarkers with therapeutic targets in advanced colorectal cancer. World J.
Gastroenterol. 20, 3858–3874, doi:10.3748/wjg.v20.i14.3858 (2014).
10. Hayashi, H. et al. Biomarkers of reactive resistance and early disease progression during chemotherapy plus bevacizumab treatment for colorectal carcinoma. Oncotarget (2014).
11. Ulivi, P. et al. eNOS polymorphisms as predictors of efficacy of bevacizumab-based chemotherapy in metastatic colorectal cancer: data from a randomized clinical trial. J. Transl. Med. 13, 258-015-0619-5 (2015).
12. Passardi, A. et al. Effectiveness of bevacizumab added to standard chemotherapy in metastatic colorectal cancer: final results for first-line treatment from the ITACa randomized clinical trial. Ann. Oncol. (2015).
13. Govers, R. & Rabelink, T. J. Cellular regulation of endothelial nitric oxide synthase. Am. J. Physiol. Renal Physiol. 280, F193–206 (2001).
14. Fukumura, D. et al. Predominant role of endothelial nitric oxide synthase in vascular endothelial growth factor-induced angiogenesis and vascular permeability. Proc. Natl. Acad. Sci. USA 98, 2604–2609, doi:10.1073/pnas.041359198 (2001).
15. Guijarro-Munoz, I. et al. Gene expression profiling identifies EPHB4 as a potential predictive biomarker in colorectal cancer patients treated with bevacizumab. Med. Oncol. 30, 572-013-0572-1. Epub 2013 Apr 12 (2013).
16. Noren, N. K., Lu, M., Freeman, A. L., Koolpe, M. & Pasquale, E. B. Interplay between EphB4 on tumor cells and vascular ephrin-B2 regulates tumor growth. Proc. Natl. Acad. Sci. USA 101, 5583–5588, doi:10.1073/pnas.0401381101 (2004).
17. Wang, Y. et al. Ephrin-B2 controls VEGF-induced angiogenesis and lymphangiogenesis. Nature 465, 483–486, doi:10.1038/ nature09002 (2010).
18. Kuwano, T. et al. Cyclooxygenase 2 is a key enzyme for inflammatory cytokine-induced angiogenesis. FASEB J 18, 300–310, doi:10.1096/fj.03-0473com (2004).
19. Jubb, A. M. et al. Impact of vascular endothelial growth factor-A expression, thrombospondin-2 expression, and microvessel density on the treatment effect of bevacizumab in metastatic colorectal cancer. J. Clin. Oncol. 24, 217–227, doi:10.1200/JCO.2005.01.5388
(2006).
20. Jubb, A. M., Oates, A. J., Holden, S. & Koeppen, H. Predicting benefit from anti-angiogenic agents in malignancy. Nat. Rev. Cancer.
6, 626–635, doi:10.1038/nrc1946 (2006).
21. Poon, R. T., Fan, S. T. & Wong, J. Clinical implications of circulating angiogenic factors in cancer patients. J. Clin. Oncol. 19, 1207–1225, doi:10.1200/JCO.2001.19.4.1207 (2001).
22. Cidon, E. U., Alonso, P. & Masters, B. Markers of Response to Antiangiogenic Therapies in Colorectal Cancer: Where Are We Now and What Should Be Next? Clin. Med. Insights Oncol 10, 41–55, doi:10.4137/CMO.S34542 (2016).
23. Berk, V. et al. Predictive Significance of VEGF and HIF-1alpha Expression in Patients with Metastatic Colorectal Cancer Receiving Chemotherapy Combinations with Bevacizumab. Asian Pac. J. Cancer. Prev. 16, 6149–6154, doi:10.7314/APJCP.2015.16.14.6149
(2015).
24. Marien, K. M. et al. Predictive tissue biomarkers for bevacizumab-containing therapy in metastatic colorectal cancer: an update.
Expert Rev. Mol. Diagn. 15, 399–414, doi:10.1586/14737159.2015.993972 (2015).
25. Hyodo, I. et al. Clinical significance of plasma vascular endothelial growth factor in gastrointestinal cancer. Eur. J. Cancer 34, 2041–2045, doi:10.1016/S0959-8049(98)00282-2 (1998).
26. Martinetti, A. et al. Circulating biomarkers in advanced colorectal cancer patients randomly assigned to three bevacizumab-based regimens. Cancers (Basel) 6, 1753–1768 (2014).
27. Cristofanilli, M., Charnsangavej, C. & Hortobagyi, G. N. Angiogenesis modulation in cancer research: novel clinical approaches.
Nat. Rev. Drug Discov. 1, 415–426, doi:10.1038/nrd819 (2002).
28. Gordon, M. S. et al. Phase I safety and pharmacokinetic study of recombinant human anti-vascular endothelial growth factor in patients with advanced cancer. J. Clin. Oncol. 19, 843–850, doi:10.1200/JCO.2001.19.3.843 (2001).
29. Loupakis, F. et al. Vascular endothelial growth factor levels in immunodepleted plasma of cancer patients as a possible pharmacodynamic marker for bevacizumab activity. J. Clin. Oncol. 25, 1816–1818, doi:10.1200/JCO.2006.10.3051 (2007). 30. Vandesompele, J. et al. Accurate normalization of real-time quantitative RT-PCR data by geometric averaging of multiple internal
control genes. Genome Biol. 3, RESEARCH0034 (2002).
Acknowledgements
The authors would like to thank Veronica Zanoni and Cristiano Verna for editorial assistance. This work was partially supported by Roche S.p.A. and the Italian Medicines Agency (AIFA).
Author Contributions
E.S., A.P., O.N., D.A. and P.U. designed the study. A.P., A.R., M.V., A.C.G. and G.L.F. were responsible for data collection. G.M., E.S., A.P. and P.U. were responsible for the analysis and interpretation of data. E.S. and O.N. performed for the statistical analyses. D.A. reviewed the manuscript for important intellectual content. G.M., E.S., A.P., O.N., A.R., M.V., A.C.G., L.M.N., G.L.F. and P.U. drafted the manuscript. All the authors approved the final version of the manuscript.
Additional Information
Supplementary information accompanies this paper at doi:10.1038/s41598-017-01420-0 Competing Interests: The authors declare that they have no competing interests.
Publisher's note: Springer Nature remains neutral with regard to jurisdictional claims in published maps and
institutional affiliations.
Open Access This article is licensed under a Creative Commons Attribution 4.0 International
License, which permits use, sharing, adaptation, distribution and reproduction in any medium or format, as long as you give appropriate credit to the original author(s) and the source, provide a link to the Cre-ative Commons license, and indicate if changes were made. The images or other third party material in this article are included in the article’s Creative Commons license, unless indicated otherwise in a credit line to the material. If material is not included in the article’s Creative Commons license and your intended use is not per-mitted by statutory regulation or exceeds the perper-mitted use, you will need to obtain permission directly from the copyright holder. To view a copy of this license, visit http://creativecommons.org/licenses/by/4.0/.