Agreement and repeatability of vascular reactivity estimates based on a
breath-hold task and a resting state scan
Ilona Lipp
a,b, Kevin Murphy
a, Xavier Caseras
b, Richard G. Wise
a,⁎
aCardiff University Brain Research Imaging Centre (CUBRIC), School of Psychology, Cardiff University, UK
bMRC Centre for Neuropsychiatric Genetics and Genomics, Institute of Psychological Medicine and Clinical Neurosciences, Cardiff University, UK
a b s t r a c t
a r t i c l e i n f o
Article history: Received 15 July 2014 Accepted 3 March 2015 Available online 18 March 2015 Keywords: Vascular reactivity Breath-hold Resting state RSFA Repeatability
FMRI BOLD responses to changes in neural activity are influenced by the reactivity of the vasculature. By complementing a task-related BOLD acquisition with a vascular reactivity measure obtained through breath-holding or hypercapnia, this unwanted variance can be statistically reduced in the BOLD responses of interest. Recently, it has been suggested that vascular reactivity can also be estimated using a resting state scan. This study aimed to compare three breath-hold based analysis approaches (block design, sine–cosine regressor and CO2regressor) and a resting state approach (CO2regressor) to measure vascular reactivity. We tested
BOLD variance explained by the model and repeatability of the measures. Fifteen healthy participants underwent a breath-hold task and a resting state scan with end-tidal CO2being recorded during both. Vascular reactivity was
defined as CO2-related BOLD percent signal change/mm Hg change in CO2.
Maps and regional vascular reactivity estimates showed high repeatability when the breath-hold task was used. Repeatability and variance explained by the CO2trace regressor were lower for the resting state data based
ap-proach, which resulted in highly variable measures of vascular reactivity.
We conclude that breath-hold based vascular reactivity estimations are more repeatable than resting-based estimates, and that there are limitations with replacing breath-hold scans by resting state scans for vascular reactivity assessment.
© 2015 The Authors. Published by Elsevier Inc. This is an open access article under the CC BY license (http://creativecommons.org/licenses/by/4.0/).
Introduction
The blood-oxygenation-level-dependent (BOLD) signal that is ac-quired during functional magnetic resonance imaging (fMRI) is com-monly used as a measure of neural activity in the brain. The nature of the BOLD signal makes it susceptible not only to changes in neural activ-ity but also depends in part on the reactivactiv-ity of the cerebro-vascular sys-tem (for a review seeLogothetis and Wandell, 2004). One aspect of this vascular reactivity can be measured by changing the CO2content of the
blood; CO2being a vasodilator. It has been shown that natural
fluctua-tions in CO2during a resting state scan coincide with low frequency
fluctuations in the BOLD signal (Wise et al., 2004). Furthermore, the BOLD signal following an increase in CO2in a region can explain up to
50% of variance between participants in task-related BOLD responses in that region (Kannurpatti et al., 2012; Liu et al., 2013). This confound can cause problems for studies investigating task-dependent BOLD signals, in particular if group differences in vascular reactivity exist, for example, in the case when comparing older and younger participants (Handwerker et al., 2007; Riecker et al., 2003; Thomason et al., 2005).
One approach to this problem is to estimate vascular reactivity in a sepa-rate scan and to set up a statistical design that controls for regional or inter-individual differences in vascular reactivity (Murphy et al., 2011). This can re-duce unwanted variability between participants, leaving variability that better reflects differences in the neural responses (Liu et al., 2013; Murphy et al., 2011; Thomason et al., 2007). A common way to estimate vascular reactivity is to increase CO2by inducing hypercapnia through respiratory challenges
(artificially regulating the CO2level of the environment) or through
breath-hold tasks. With both of these methods, the CO2level and as a result the
ce-rebral bloodflow (CBF) can be modulated, under the assumption of an unchanged rate of oxygen consumption (Poulin et al., 1996). When breath-hold or respiratory challenges are used to estimate vascular reactivity, the increase in CO2leads to wide-spread BOLD responses throughout all of grey
matter (e.g.Bandettini and Wong, 1997).
Increasing inspired CO2and breath-holding are the most commonly
used approaches to measure vascular reactivity, andKastrup et al. (2001)showed that both yield comparable results. However, there are some problems related to the two methods. Using the respiratory chal-lenge approach is logistically challenging, and not all participants are compliant with the breathing apparatus. Breath-holds are more easily implemented, however, participants may vary in their ability to hold their breath. One way to compensate for performance differences is to
⁎ Corresponding author.
E-mail address:[email protected](R.G. Wise).
http://dx.doi.org/10.1016/j.neuroimage.2015.03.004
1053-8119/© 2015 The Authors. Published by Elsevier Inc. This is an open access article under the CC BY license (http://creativecommons.org/licenses/by/4.0/).
Contents lists available atScienceDirect
NeuroImage
record the end-tidal CO2and use the traces for modelling the BOLD
response (Bright and Murphy, 2013). Another way of assessing vascular reactivity avoiding this problem has been proposed byKannurpatti and Biswal (2008). They define a resting state physiological fluctuation am-plitude (RSFA) which is calculated as the temporal standard deviation of the BOLD time series obtained during a resting state scan. This method has been used to scale task-related BOLD responses (e.g.Kannurpatti et al., 2011), andKannurpatti and Biswal (2008)found high similarity between RSFA maps and maps showing the temporal standard devia-tion of the BOLD time series obtained during breath-hold or a 5% CO2
challenge. However, it is not clear whether RSFA is a specific measure of vascular reactivity, since it is ignorant of underlying changes in CO2
and undoubtedly incorporates BOLD signal changes originating from fluctuations in neural activity rather than purely vasoactive stimulation. During a breath-hold scan the changes in CO2are induced and happen
during specified periods of time. This gives the researcher several op-tions for modelling the BOLD data.Murphy et al. (2011)compared a number of models with regard to how well theyfit a BOLD-time course obtained during 6 cycles of 20 second breath-holds. The simplest model is a block model convolved with the hemodynamic response function (HRF). Another option is a sine–cosine waveform regressor at the task frequency. Using these two models, one assumes that participants fol-low task instructions and can manage to hold their breath for the spec-ified amount of time. A way to avoid this assumption is to model the end-tidal CO2measured during the scan convolved with the HRF. Murphy et al. (2011)found that the sine–cosine model outperforms the block design and that using the recorded CO2trace regressor leads
to a better modelfit than using the sine–cosine regressors, but not in all brain regions. However, when participants vary in their breath-hold performance, the CO2regressor can substantially improve the
quality of vascular reactivity estimations (Bright and Murphy, 2013). If end-tidal CO2is acquired during a resting state scan, the CO2
regressor approach could in principle also be used for resting scan data to evaluate vascular reactivity. This permits the examination of CO2related BOLDfluctuations and could lead to a more specific measure
of vascular reactivity during rest than the temporal standard deviation of the BOLD signal, potentially reducing the confounding effect of fluctu-ations in neural activity contributing to a vascular reactivity estimate. In this study, we measured end-tidal CO2during a breath-hold task and a
resting state scan to obtain scaled BOLD signal changes as vascular reac-tivity measures (CO2-related percent change in BOLD/mm Hg CO2; also
seeWise et al., 2004). This enabled us to investigate whether the breath-hold approach and the resting state approach result in measures of vascular reactivity, and how well the model established using the CO2
tracesfits the BOLD data.
The modelfit gives an indication of the quality of a method used. Another quality index is the repeatability of the obtained results. In a number of studies different ways of breath-hold acquisition are com-pared with regard to repeatability as measured by inter-trial variability (Magon et al., 2009; Scouten and Schwarzbauer, 2008; Thomason and Glover, 2008). Comparing inter-trial and inter-individual variance over different conditions makes it possible to define the most repeatable con-dition. The intraclass correlation coefficient (ICC) reflects the ratio be-tween the data variance of interest (bebe-tween-participant differences) and the total data variance (Shrout and Fleiss, 1979), and has frequently been applied to fMRI data (Bright and Murphy, 2013; Caceres et al., 2009). The ICC can be applied to extracted percent signal change from an area of interest, as well as to voxels in order to obtain an estimate of spatial repeatability (repeatability of the signal spatial distribution; e.g.Lipp et al., 2014).Magon et al. (2009)applied a similar approach to breath-hold data, calculating Pearson's correlation coefficient over the t values of all voxels in the grey matter. Mean correlation in the 11 participants for a 21 second long breath-hold was .70, which indicates good repeatability (Cicchetti, 2001). Recently, Bright and Murphy (2013)reported high repeatability of spatial maps as well as locally ex-tracted averages of vascular reactivity when end-tidal CO2regressors
were used to analyse breath-hold data. In addition to the ICC, the coef-ficient of variation (CV) is an often used measure of repeatability, distinguishing variance between participants (CVbetween), and variance
within participants (CVwithin), while the ICC depends on both these
components and is therefore susceptible to the variability in the inves-tigated sample.
The aim of this study was to compare the vascular reactivity esti-mates obtained during breath-holding and during rest on three levels: the estimates in %SC/mm Hg CO2, the modelfit of the CO2regressor
and between-session repeatability of the vascular reactivity maps and regionally averaged vascular reactivity. To allow direct comparison to previous studies, we also included measures of temporal standard devi-ation (RSFA and temporal standard devidevi-ation of the BOLD time series during breath-holding) in the analysis. Furthermore, we aimed to inves-tigate whether between-session repeatability is influenced by the model used to analyse the breath-hold data (block design vs. sine–cosine regressor vs. CO2regressor). An additional aim of this study was to
estab-lish the minimum number of breath-hold cycles needed to obtain repeat-able vascular reactivity maps.
Methods Sample
Fifteen (8 male) participants with a mean age of 24 (range: 21–28) voluntarily took part in the study. They underwent the same scanning protocol twice with a mean interval of 23 days (range: 15–34). One par-ticipant was excluded from analysis due to problems with the acquired CO2trace. All participants gave written consent. The study was
ap-proved by the Cardiff University School of Medicine Research Ethics Committee.
Breath-hold task
The breath-hold task was adapted fromMurphy et al. (2011). During the task, breathing instructions were presented on the screen, guiding the participant through 6 cycles of breath-holding and recovery, each with four different phases: paced breathing (alternating breathing in and breathing out for 3 s each) for 18 s, end-expiration breath-holding for 15 s, exhalation, andfinal recovery (spontaneous breathing with no breathing instructions) for 15 s. The task took 5 min to complete. End-expirational breath-hold was chosen because it has been shown that a shorter breath-hold duration is needed to obtain the same signal changes, and because the inspiration before a breath-hold varies between participant with regard to depth and intrathoracic pressure which introduces additional variability (Kastrup et al., 1998; Thomason and Glover, 2008).
Image acquisition
The participants underwent gradient-echo echo-planar imaging at 3 T (GE HDx MRI System) with a T2* weighted imaging sequence (TR = 3 s, TE = 35 ms, receive-only head coil). 140 volumes were ac-quired during the resting state period, 108 during the breath-hold task. The breath-hold task was presented using Presentation (Neurobe-havioral Systems, Albany, CA) and rear-projected onto a screen behind the participant's head that was visible through a mirror mounted on the head RF coil. The orientation of the axial slices was parallel to the AC–PC line. During the resting state period, participants were presented with a black screen and instructed to keep their eyes open and to relax. A T1 weighted whole-brain structural scan was also acquired for purposes of image registration (1 × 1 × 1 mm resolution, 256 × 256 × 176 matrix size). The structural image was only acquired during session 1, and this image was used for registration for the functional images of session 1 and session 2.
CO2recordings
During both scanning sessions end-tidal carbon dioxide (PetCO2)
and end-tidal oxygen (PetO2) were recorded using a nasal cannula
attached to rapidly responding gas analysers (AEI Technologies, PA) to provide representative measures of changes in arterial partial pressures of both gases.
Image data analysis
The acquired data were preprocessed using FEAT (FMRIB Expert Analysis Tool, v5.98,www.fmrib.ox.ac.uk/fsl, Oxford University, UK). Preprocessing steps before model fitting were applied to each participant's time series, and included: highpassfiltering of the data (100 s temporal cutoff), non-brain removal using BET (Smith, 2002), MCFLIRT motion correction (Jenkinson et al., 2002), spatial smoothing with a Gaussian kernel of full-width-half-maximum 5 mm and fieldmap-based EPI unwarping using PRELUDE + FUGUE (Jenkinson, 2003, 2004); for one person this was not performed due to problems during the acquisition of thefieldmaps. Functional images were regis-tered using FLIRT (Jenkinson and Smith, 2001) in afirst step to the struc-tural image with 6 degrees of freedom, and in the second step to the Montreal Neurological Institute (MNI) space with 12 degrees of free-dom. First-level analysis of the breath-hold task was performed in three different ways using different sets of regressors: 1) a boxcar regressor with a lag of 9 s (Murphy et al., 2011), 2) a sine and cosine wave at the task frequency (0.02 Hz) and 3) the recorded CO2trace
(HRF convolved) including a temporal derivative (Murphy et al., 2011). The resting state data were analysed with the recorded CO2
(convolved with a HRF) trace as a regressor, also including a temporal derivative. The CO2traces were temporallyfiltered by FEAT for both,
the breath-hold and the resting state analysis. We will refer to these approaches as BHBlock, BHSine−cosine, BHCO2and RestingCO2.
RSFA calculation
To create RSFA maps, the temporal standard deviation of the BOLD time series was calculated for each voxel (Kannurpatti and Biswal, 2008) for the resting state data. This was performed after all the prepro-cessing steps described above. To be able to compare results to previous studies, the temporal standard deviation of the BOLD time series was also calculated for the breath-hold scan. We will refer to these ap-proaches as RestingRSFAand BHTsd.
Estimation of the modelfit
The coefficient of determination (R2) was used as an estimation of
how well the applied modelfits the data. This measure gives an indica-tion of the amount of variance in the time series explained by the applied model. For each of the analysis methods and each participant, an R2map was calculated by applying the following equation to each voxel:
MSStime‐series−MSSresiduals
MSStime‐series ;
whereby the mean sum of squares (MSS) was calculated by squaring and temporally summing over the demeaned time series and residual time series, respectively. For each participant, the median R2was
ex-tracted from grey matter over the whole brain as well as for grey matter within a number of anatomical masks selected from the WFU-PickAtlas (Version 3.0.4, Wake Forest University, School of Medicine, Winston-Salem, North Carolina,www.ansir.wfubmc.edu).
Calculation of the BOLD percent signal change/mm Hg CO2
For each analysis method, the residuals after modelfitting were subtracted from the preprocessed time series in order to obtain a model-fitted time series. To estimate the BOLD signal change per unit change of CO2, the robust range of thisfitted BOLD time series was
divided by the temporal mean and multiplied by 100 (to get % signal change), and then divided by the robust range of the HRF convolved CO2trace (to get % signal change/mm Hg). Note that this CO2range
was the same for all three breath-hold based methods. In order to minimise the risk of outliers, a robust range was defined as the absolute difference between the 10th percentile and the 90th percentile. The median signal change was then extracted for the grey matter mask and for the additional anatomically defined regions.
For all vascular reactivity maps (BHBlock, BHSine−cosine, BHCO2,
RestingCO2, RestingRSFAand BHTsd), voxels were excluded if they were
outside the brain (using AFNI function 3dSkullStrip) and if they had a negative z value in the original Feat analysis (indicating“negative vascular reactivity”; this step could not be done for RestingRSFAand BHTsd).
Statistical analysis Repeatability analysis
The intraclass correlation coefficient (ICC([3,1]);Shrout and Fleiss, 1979) was used as a measure of repeatability. ICCs were interpreted according to commonly used guidelines (Cicchetti, 2001; see also e.g.Van den Bulk et al., 2013) that classify values ofb.41 as “poor”, values between .41 and .59 as“fair”, values between .60–.74 as “good” and valuesN .74 as “excellent”.
In order to determine the repeatability of vascular-reactivity maps, voxel-wise ICCsspatialwere calculated for each participant separately.
This was performed using the percent signal change/mm Hg maps and all voxels in grey matter. The same approach was used to estimate the agreement between vascular-reactivity maps obtained using different analysis approaches, but for this analysis Pearson correlation coef fi-cients (r spatial) were used. All repeatability analyses were performed using in-house MATLAB (MathWorks, Natick, MA) scripts.
A CVwithinwas calculated for each person by dividing the standard
deviation of the two vascular reactivity measures by their mean. CVbetweenwas calculated for both sessions (by dividing the standard
de-viation by the mean of all participants' vascular reactivity estimates) and averaged over the two sessions.
Statistical comparisons between analysis methods
We compared the extracted median values for R2, BOLD signal changes, spatial repeatability ICCs and CVwithinfor the three
breath-hold based methods and the resting approach by calculating Friedman tests, using the function implemented in MATLAB (MathWorks, Natick, MA). This nonparametric test was chosen due to the nature of the values used and due to problems with the assumption for sphericity. Friedman tests were performed for comparing the three breath-hold based methods (BHBlock, BHSine−cosine, BHCO2) and for comparing the two
approaches using the CO2regressor (BHCO2and RestingCO2).
Results
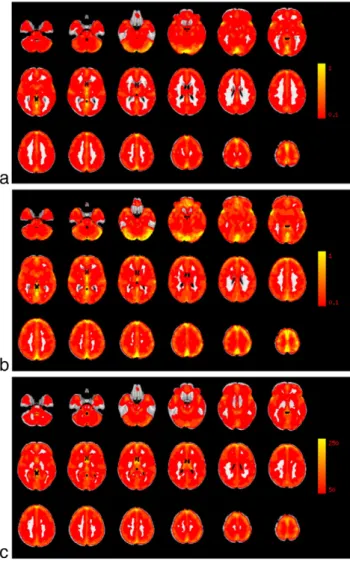
Average vascular reactivity maps and RSFA maps are shown inFig. 1. Modelfit
In order to examine the modelfit, data from session 1 was used. The amount of variance explained by the four methods was calculated for each participant. There was a significant difference in the variance ex-plained between the breath-hold based methods (χ[2] = 18.1, pb.0001, seeFig. 2a). Pairwise comparisons revealed that the BHBlock
BHSine−cosine(p = .0006) and the BHCO2design (p = .004). No significant
difference was found between the BHSine−cosineand BHCO2regressors
(pN.99; all p values corrected for number of pairwise comparisons (3)). The modelfit in the RestingCO2set was significantly lower than in the
BHCO2approach (χ[1] = 7.14, p=.0075).
An example for a modelfit for each of the analysis methods is given inFig. 3. Since the variance explained by each of the models is expected
to differ between regions, the median modelfit was extracted on a re-gional basis as well. In all of the regions, either the sine–cosine or the CO2trace model explained the most variance (see Supplement Fig. 1).
Estimations of vascular reactivity
Estimates of the median %BOLD/mm Hg CO2throughout the grey
matter differed between the three breath-hold based analysis methods (χ [2] = 19, p b.0001). Pairwise comparison revealed lower estimates for the BHBlockapproach compared to the BHSine−cosine(p = .0006)
and the BHCO2(p = .004) approach. BHSine−cosineand BHCO2regressors
did not result in different vascular reactivity estimates (pN .30; all p values corrected for number of pairwise comparisons (3)). The vascu-lar reactivity estimates in the RestingCO2did not significantly differ from
the BHCO2approach (χ [1] = 1.14, p = .29). However, the RestingCO2
yielded significantly more variable values than the BHCO2approach
(F-test:χ [13] = 7.6, p b .001; also seeFig. 2b). This pattern holds true in most of the considered individual regions, and in a number of regions the RestingCO2also resulted in significantly higher vascular
reac-tivity estimates (see Supplement Fig. 2).
Estimations of the median extracted percent signal change/ mm Hg CO2in the grey matter showed high between-participant
correla-tions with each other when the three breath-hold analysis approaches were used. The values obtained with the RestingCO2were significantly
correlated with the BHCO2, and with the RestingRSFAmethod. Vascular
re-activity estimates from the two temporal standard deviation approaches (RestingRSFAand BreathTsd) were also significantly correlated (Table 1).
Scatter plots for all correlations are shown in Supplement Figs. 4 and 5. Correlations between BHCO2and RestingCO2for all investigated regions
can be found in Supplement Table 1.
Comparison of vascular reactivity maps obtained during breath-hold vs. resting state scans
In order to quantify agreement between the vascular reactivity maps produced using the breath-hold data vs. the resting state data, the r spa-tial values between the maps were obtained for session 1 for each per-son. Vascular reactivity maps created with the BHBlockand BHSine−cosine
regressor showed good agreement with the maps created with the BHCO2regressor in all participants (median r spatialN .92), whereas
the maps created using the RestingCO2showed more variable but on
average high correspondence to the breath-hold (BHCO2) created map
(median r spatial = .64, min. = .10, max. = .76). The RestingRSFAdata
set showed similar agreement with the BHCO2maps with a median r
of .63 (min. = .40, max. = .72;Fig. 4a). For the resting state data, the RestingCO2method and RestingRSFAmaps had good agreement (median
r = .69, min. = .44, max. = .88). Maps created with the two standard
Fig. 1. Average vascular reactivity maps, calculated with a) the BHCO2method (in % SC/ mm Hg CO2), b) the RestingCO2method (in % SC/mm Hg COCO2), and c) the RSFA approach (in arbitrary units). The average was calculated over 14 participants.
Fig. 2. a) Comparison of the analysis methods with regard to the modelfit as estimated by the median R2
in grey matter. b) Comparison of the analysis methods with regard to median BOLD % signal change/mm Hg CO2estimations in grey matter.
deviation based measures (RestingRSFAand BHTsd) agreed very highly
(median r = .85, min. = .70, max. = .89), as well as maps from the BHCO2and BHTsdapproaches (median r = .81, min. = .67, max. = .88).
If vascular reactivity can be measured with a resting state scan, day-to-day differences in vascular reactivity as measured by breath-holding should correspond to day-to-day differences in vascular reactivity as measured by the resting data. An r spatial was calculated for each person using a day-to-day difference map from BHCO2and RestingCO2
data. The maps did not appear to be related, with a median r spatial of .14 (min. = .01, max = .37).
Repeatability of vascular reactivity estimates
Repeatability for the median percent signal change extracted from grey matter was good using the BHBlockdesign (ICC = .71, p = .002),
BHSine−cosine(ICC = .74, pb .001) and using the BHCO2(ICC = .62,
p = .007), and fair using the RestingCO2data (ICC = .42, p = .06) but
excellent for the RestingRSFAdata (ICC = .76, pb.001). Scatter plots
are shown in Supplement Fig. 5. ICCs were also calculated on a
regional level (seeFig. 6). In most of the regions, either the BHBlock
or the BHSine−cosineand in some cases the RestingRSFAdata show the
highest repeatability.
CVsbetweenfor the median percent signal change extracted from grey
matter were 31% for the BHBlockmethod, 26% for the BHSine−cosine
meth-od, 25% for the BHCO2method and 60% for the RestingCO2, respectively.
Median (iqr.) CVswithinfor the four methods were: 11(23)% (BHBlock),
12(12)% (BHSine−cosine), 8(12)% (BHCO2) and 42(42)% (RestingCO2).
Friedman tests revealed no significant differences in CVswithinbetween
the three breath-hold based approaches (χ [2] = 1.7, p=.42), but a sig-nificant difference between the BHCO2method and the RestingCO2(χ
[1] = 7.1, p= .008). CVs for all ROIs can be found in Supplement Tables 2–3 and Supplement Fig. 3.
Spatial repeatability was calculated for each person and each analy-sis method (seeFig. 4b). Spatial repeatability depended on the analysis method for the breath-hold scan (χ [2] = 9, p=.01). Pairwise com-parisons revealed that highest repeatability was found for the BHCO2
(BHCO2vs. BHBlock: p = .032 (uncorrected), BHCO2vs. BHSine−cosine: p =
.0075 (uncorrected); only difference between BHCO2vs. BHSine−cosine
would survive correction for number of comparisons (3)), with no significant difference between BHSine−cosineand BHBlock models
(p(uncorrected) = .60). Repeatability was lower for the resting state data set than for BHCO2(χ [1] = 14, p=.0002).
Spatial repeatability was also calculated for the temporal standard deviation approaches. Both approaches showed good to excellent repeatability in all participants (seeFig. 4b).
How many cycles of breath-hold are needed to get reproducible vascular reactivity maps?
Repeatability was calculated for the maps obtained using different numbers of breath-hold cycles included in analysis. The number of cy-cles significantly influences the ICCspatialvalues obtained (χ [5] = 39,
pb.0001; seeFig. 5). Comparing subsequent numbers of cycles shows that implementing 2 cycles yields higher repeatability than 1 cycle
Fig. 3. For each method an example of a modelfit of an average participant is provided. The BOLD time series (averaged over the grey matter) is plotted in red, the model in black. Residuals are plotted in green.
Table 1
Between-participant Pearson correlation coefficients between the median vascular reac-tivity estimates (BOLD % signal change/mm Hg CO2) in grey matter obtained through the three breath-hold based approaches (BHBlock, BHSine−cosineand BHCO2) and the resting state based approach (RestingCO2). Additionally, the two approaches based on the tempo-ral standard deviation of the BOLD signal (RestingRSFAand BHTsd) were included to allow direct comparison tofindings of previous studies.
BHBlock BHSine−cosine BHCO2 RestingCO2 RestingRSFA BHTsd
BHBlock 1 .93⁎⁎ .81⁎⁎ .47 .25 .44 BHSine−cosine 1 .84⁎⁎ .39 .26 .54⁎ BHCO2 1 .63⁎ .41 .51 RestingCO2 1 .74⁎⁎ .52 RestingRSFA 1 .59⁎ BHTsd 1 ⁎ p b .05. ⁎⁎ p b .001.
(p = .0013), 3 higher repeatability than 2 (p = .0325), 4 higher repeat-ability than 3 (p = .0325), but there is no difference between 4 and 5 (p = .11), orfive or six (p = .11), however, between four and six (p = .0075). Only the difference between 1 and 2, as well as 4 and 6 cycles survive correction for the number of comparisons (6).
Repeatability of breath-hold performance
In order to examine performance differences between the two ses-sions, an ICC was calculated for each person over the time course of the CO2regressor. A median of ICC = .81 (min. = 26, max. = .93)
sug-gests that performance is highly repeatable in most participants (see Supplement Fig. 6a). The range of the physiological trace used to scale the BOLD response showed fair repeatability for the breath-hold based approach (ICC = .41, p = .06; see Supplement Fig. 6b) as well as for the resting based approach (ICC = .54, p = .02; see Supplement Fig. 6c), indicating that the extent of CO2increase in session 1 only
shows a fair relationship to the CO2increase in session 2.
Discussion
In this study, we compared three different ways of analysing a breath-hold scan (BHBlock, BHSine−cosine, and BHCO2) and an approach
using resting state data set (RestingCO2) with regard to different aspects
of measuring vascular reactivity: modelfit of the regressors, repeatabil-ity of obtained vascular reactivrepeatabil-ity maps, and repeatabilrepeatabil-ity of regionally extracted vascular reactivity estimates. We compared vascular reactivi-ty maps obtained during the breath-hold scan to the maps obtained during the resting scan to see whether resting state scans could be potential replacements for breath-holds when it comes to estimating vascular reactivity. Additionally, we extracted RSFA (RestingRSFA) and
the temporal standard deviation of the breath-hold data (BHTsd) set to
make results directly comparable to previous studies, and to investigate the effects of modelling the data by using recorded CO2traces.
Modelfit and estimations of vascular reactivity
The modelfit of each regressor was assessed by calculating the amount of variance in the BOLD time series explained by the regressor. In grey matter, the BHBlockdesign accounted for significantly less
vari-ance than the BHSine−cosineor BHCO2trace regressors, which on average
explained about 40% of the BOLD time series (min. = 19%). These values are comparable with those previously reported byMurphy et al. (2011). In the resting state data, the CO2regressor could on average only explain
less than 20% of the variance (min. = 6%) which is also comparable to previous studies (Chang et al., 2009; Wise et al., 2004). Within the grey matter, the amount of variance explained by the models varies sub-stantially between regions, with particularly good modelfits in the fron-tal cortex, and poorer model fits in other regions such as the hippocampus and inferior temporal cortex. Lower modelfits for the resting state data than for the breath-hold data were found in most of the considered regions. In other words, the BOLD time course during rest is not as strongly influenced by CO2-related physiological changes
as it is during the breath-hold scan. This was expected since the change in CO2during the breath-hold scan is stronger (median range in CO2:
8 mm Hg) than during a resting scan with no other task-instruction than to relax (median range in CO2: 2 mm Hg). The difference in
modelfit between breath-hold data and resting data suggests that the proportion of neuronally-drivenfluctuations is higher in the resting state data, which makes it more challenging to measure vascular reactivity.
However, also for the breath-hold task the regressors are not suf fi-cient to explain all variance in the BOLD time series. For this reason, in order to obtain a measure of vascular reactivity it is important to identi-fy the CO2related signals in the BOLD time course. Estimating vascular
reactivity by simply using the temporalfluctuation of the BOLD time series, as suggested byKannurpatti and Biswal (2008), gives a good indication of how much the BOLD signalfluctuates but disregards the influence of the source of fluctuation. In this study we used a different approach, by defining vascular reactivity as the amplitude of the modelfitted data set divided by the CO2change. This allowed one to
specifically look at CO2-related BOLDfluctuations. In regions with high
vascular reactivity, a good modelfit was obtained. Using a BHBlock,fit
es-timations of vascular reactivity were lower than for the BHSine−cosineand
BHCO2trace model. The vascular reactivity estimates in BOLD signal
change/mm Hg CO2 values are comparable to previous studies
(Kastrup et al., 2001; Liu et al., 2013). In fact, comparing vascular reac-tivity measures obtained this way to the measure of temporal standard deviation (BHTsd) only yielded in medium sized correlations, even
though both values were derived from the exact same scan.
The resting state analysis (RestingCO2)– for which model fit was
lower than in any of the breath-hold based methods– provided the
Fig. 4. a) Spatial agreement between the vascular reactivity map using BHCO2method and RestingCO2method. As a comparison, agreement is also plotted between the maps using BHCO2 and the maps obtained with the BHBlockdesign and BHSine−cosineregressor. b) Comparison of spatial ICCs of vascular reactivity maps obtained with the six methods. ICCs were calculated over voxels in grey matter only.
Fig. 5. Spatial repeatability dependent on how many cycles of breath-hold are included in the analysis. Data for the CO2trace regressor are presented.
highest vascular reactivity estimates in all regions (however, the differ-ence was only significant in a number of them). Vascular reactivity mea-sures were highly variable between participants. In participants with lower modelfit, lower vascular reactivity is estimated; but in partici-pants for which the CO2regressor explains a considerable amount of
the BOLD time course, a small change in CO2seems to result in a big
change in BOLD, resulting in estimates of vascular reactivity about twice as high as the estimates obtained through breath-holding and higher than previously reported (Wise et al., 2004). Since the same par-ticipants were used in both scans, there must be another reason for this difference in estimation than actual differences in vascular reactivity. One explanation for thatfinding is that in the resting state scan CO2
fluc-tuations might be correlated with neuronalfluctuations in participants with these extremely high vascular reactivity estimates. This would re-sult in a higher BOLD response than caused by the CO2increase only.
Confounded neuralfluctuations might be related to arousal, which af-fects the breathing pattern and as a consequence the BOLD response. The over-estimation of vascular reactivity in some participants makes it difficult to interpret the findings for the resting state scan and sug-gests that breath-hold tasks cannot simply be replaced by resting state scans if adequate measures of vascular reactivity are the aim.
Agreement of vascular reactivity measures and maps obtained during breath-hold vs. resting state scans
Kannurpatti and Biswal (2008)found that vascular reactivity maps obtained during a resting scan are very similar to the maps obtained during breath-hold scans, using the temporal standard deviation approach. We replicated thisfinding using the temporal standard devi-ations (RestingRSFAand BHTsd), however, using the CO2modelling
ap-proach the agreement between breath-hold and resting state derived maps was considerably lower with a median correlation of .64, as was the correlation between the conventional breath-hold analysis BHCO2
and the RestingRSFA(median of .63). This means that temporal standard
deviations show some agreement with the CO2modelled data, but are
probably driven by more than changes in CO2.
Even if vascular reactivity maps derived with the suggested methods are comparable, in order to be able to replace breath-hold scans with resting state scans when measuring vascular reactivity, not only the spatial agreement of the resulting maps is required, but also between-participant correlations. This is because vascular reactivity measures are used to decrease between-participant variance. At the participant-level, we found a relationship between the extracted vascular reactivity in grey matter obtained through BHCO2and the RestingCO2values of r =
.63. This is similar to what has been reported byKannurpatti et al. (2012). In comparison, we found correlations of aroundN.80 between the three breath-hold based approaches (however, it has to be noted that these measures were all derived from the same scan). Vascular re-activity measured with the RestingRSFAmethod did not correlate signi
fi-cantly with any of the breath-hold based approaches. Another study that looked at the relationship between RSFA and vascular reactivity (as measured by hypercapnia) in the whole-brain found a correlation of .36 (Liu et al., 2013). This correlation coefficient is similar to ours (r = .41), which did not reach significance with our sample size. How-ever, the small effect size does indicate vascular reactivity assessed through breath-holding and RSFA are not interchangeable.
Repeatability of vascular reactivity estimates and maps
Repeatability was estimated in order to obtain an indication for how reliable and stable the vascular reactivity measures are. Repeat-ability was calculated for the extracted vascular reactivity (%BOLD/ mm Hg CO2) in all considered regions. In most regions, repeatability
of breath-hold based vascular reactivity can be classified as good (.60–.75), while most of the ICCs obtained during the resting state data would be classified as poor or fair (b.40/b.60). Which breath-hold resulted in the highest repeatability was region-dependent, but in most regions the BHCO2regressor resulted in lower repeatability than
the BHBlockor BHSine−cosineregressors. This was the case even though
the modelfit for the BHCO2trace regressor was found to be higher than
for the BHBlockregressor and not different from the BHSine−cosine
regres-sor. It is possible that by recording the CO2trace during both sessions,
additional measurement error was induced that resulted in slightly lower repeatability. Thesefindings are in contrast with whatBright and Murphy (2013)reported, comparing a CO2-based approach with a
HRF convolved ramp regressor. However, their study was specifically designed to induce variability in task-performance between partici-pants. In our study most participants managed to hold their breath for 15 s without problems, which might be the reason why the CO2analysis
did not lead to higher repeatability than the other regressors. The vascu-lar reactivity measures obtained with the BHBlockor BHSine−cosine
regres-sor are influenced by performance, and performance turned out to be highly repeatable in most participants. This might have led to a boost in repeatability when either of these two regressors is used.
When looking at CVwithinas an additional indicator of repeatability,
no significant differences between the three breath-hold based ap-proaches could be found. However, the RestingCO2method resulted in
significantly higher CVwithin values than the BHCO2method, again
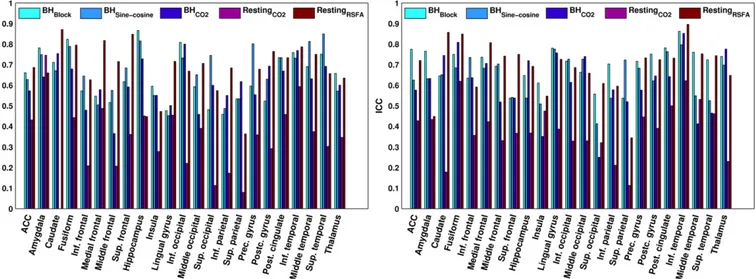
Fig. 6. The repeatability (ICC) of the estimated vascular reactivity for each of the methods in each region of interest in the left hemisphere (left) and right hemisphere (right). An ICC ofb.40 indicates“poor” repeatability, .40–.59 “fair” repeatability, .60–.74 “good” and N.74 “excellent” repeatability.
suggesting lower reproducibility of the vascular reactivity estimates using the resting state approach. While the ICC measure is not only re-flective of the variation of estimates within participants over time, it also takes into account the variability between participants in the sam-ple used for repeatability estimation. On the other hand, the CVwithin
only reflects the variability of the measurements within individuals, and is therefore a useful complementary measure. Our results suggest that the low ICC obtained for the RestingCO2method is not due to
reduced variability between participants, since the CVbetweenas well as
the CVwithinare in fact higher than for any of the other methods.
How repeatable the vascular reactivity measures were, varied from region to region. This reflects regional differences in the size and reli-ability of the vascular reactivity estimates (also reflected by regional differences in the modelfit), as well as differences in the stability of vascular reactivity over time. Day-to-day differences in factors such as tiredness or caffeine intake might influence vascular reactivity more in some regions than in others. In some regions, such as the insular cortex (Banzett et al., 2000; Evans et al., 2002) the vascular reactivity measures are likely to be influenced by neural confounds, which might also lead to less reliable estimates of vascular reactivity. Indeed, the insular cortex was amongst the regions with the least repeatable estimates in this study.
RestingRSFAappeared to be highly repeatable in most of the regarded
regions. However, due to the low agreement with breath-hold based vascular reactivity measures, it is unclear what this method actually measures. During the breath-hold, the strong BOLD responses to the task can be assumed to be strongly driven by the arterial CO2changes,
even though neural aspects of breath-holding might still influence the BOLD signal change to a certain extent (e.g.Banzett et al., 2000, Evans et al., 2002). During the resting state scan, no such intense physiological changes are present. Resting state scans are widely used to assess cogni-tive networks, assuming the BOLD signal variations largely originate fromfluctuations in neuronal activity rather than fluctuations in CBF as-sociated with underlying non-metabolically demanding variations. Even after correcting for physiological changes (such as variations in breathing), neural networks can still be detected (for reviews seeBirn, 2012; van den Heuvel and Hulshoff Pol, 2010). This means, that in the resting state data set neural aspects are likely to have a bigger influence on the BOLD signal than is the case during breath-hold scans. Using only the temporal standard deviation over the whole time series makes it impossible to study the source of this signalfluctuation, even though some of the variance can be explained by CO2reactivity, as indicated
by a medium between-participant correlation between RestingRSFAand
RestingCO2. Also, the amount of physiological BOLDfluctuations –
irrespective of the underlying vascular reactivity– might vary between participants, reducing the interpretability of vascular reactivity in resting state data.
The change in CO2, which directly influences the vascular reactivity
estimates, only shows fair repeatability, suggesting that there might be day-to-day differences in the CO2increase during breath-holding.
An additional analysis was performed to determine the repeatability if BOLD % signal changes are not divided by the change in CO2. ICCs
in-crease for all analyses (BHBlock: ICC = .90, p b.0001; BHSine−cosine:
ICC = .84, pb.0001; BHCO2: ICC = .77, pb .001; RestingCO2: ICC = .84,
pb.0001) but most substantially for the RestingCO2data set. This is
another indicator for the possibility that the CO2trace might be
con-founded with other factors leading to a boost in the BOLD response in-dependent of the actual change in CO2. Interestingly, not dividing by
the CO2range also gave slightly better ICC values for the breath-hold
re-lated BOLD changes, which indicates that CO2measurement error
prob-ably does play a role. In this particular sample breath-hold performance and CO2changes might not have been variable enough to detect the
benefit from recording and using the end-tidal CO2trace as reported
byBright and Murphy (2013).
Since repeatability of vascular reactivity values (BOLD signal change/ mm Hg CO2) is not only influenced by the quality of the method but also
by possible day-to-day differences in vascular reactivity, spatial repeat-ability of the vascular reactivity maps might be a better indicator for re-liability. Also, the performance of breath-hold will affect all voxels in the same way, and repeatability of the maps should be less dependent on day-to-day differences in performance. We found that the BHBlock
de-sign leads to lower mean spatial repeatability than the BHSine−cosineor
BHCO2trace regressors, but all median ICCs for the breath-hold data
sets are above .75, which can be classified as excellent. Spatial repeat-ability of the vascular reactivity maps using resting state data was very variable between participants, with a median classified as good for the RestingCO2and a median classified as excellent for the RestingRSFA
analysis. This means that vascular reactivity maps obtained with resting state data are repeatable in most but not all participants. The lower re-peatability in some participants could result from session-to-session differences in what participants were doing during the resting state scans and from activation of different networks on each occasion. This again suggests that resting state data are harder to interpret when it comes to vascular reactivity. Looking at spatial repeatability of vascular reactivity maps of the breath-hold based approaches, two outliers had only fairly repeatable maps. Further exploration revealed that these were the two participants with the least variability in their vascular reactivity estimates over the brain.
Reliability versus validity
In this paper, we aimed to compare the repeatability of various mea-sures of vascular reactivity. Repeatability consists of the two aspects re-liability and temporal stability. A highly repeatable measure is likely to be a reliable measure. From all the methods we assessed, the RestingRSFA
gave the most repeatable results, suggesting it might be the most reli-able method. However, it is not clear to what extent RSFA reflects fluc-tuation driven by vascular vs. neural factors. At the moment, the gold-standard of measuring vascular reactivity is introducing hypercapnia by CO2challenges or breath-holding, even though these two methods
also have neural confounds (Banzett et al., 2000; Evans et al., 2002) hard to control for. We showed that assessing vascular reactivity by modelling the breath-holding periods vs taking the temporal standard deviation in this data gives related but not highly correlated vascular re-activity measures (correlation between BHBlock/Sine−cosine/CO2and BHTsd).
Moreover, the highly repeatable RestingRSFAscores did not significantly
correlate with the modelled breath-hold data. If we assume that breath-holding is a valid measure of vascular reactivity, then RestingRSFA
is unlikely to be a good indicator for vascular reactivity.
How many cycles of breath-hold are needed to get reproducible vascular reactivity maps?
To answer the question how many cycles are necessary to obtain re-peatable vascular reactivity, we analysed the BOLD time series several times, each time including a different number of breath-hold cycles. Only including 1 or 2 cycles of breath-holding does not result in repeat-able maps in most participants. Based on our results, we recommend implementing at least 3 cycles to guarantee repeatable maps in all par-ticipants (but the two outliers), when a breath-hold duration of 15 s is used. It is possible that using longer duration less cycles are needed, while shorter duration more cycles might be necessary.
Limitations and future directions
Even though we obtained good repeatability for regional vascular re-activity estimates, and high spatial repeatability of the maps, we need to be careful with the interpretation of thefindings. Other factors than what we addressed as vascular reactivity– such as task performance – can play a role in the repeatability estimates. On the one hand, using the BHBlockdesign and BHSine−cosineregressors, task-performance plays
a big role. If performance is bad, these regressors do notfit the data very well and lead to an unreliable vascular reactivity estimate. This problem is addressed by using the BHCO2regressor, however, in our
sample this regressor gave slightly lower repeatability values than the other two breath-hold regressors. In our sample, participants did not have problems performing the task, and the BHCO2method is
particular-ly useful for participants who have problems holding their breath (Bright and Murphy, 2013). In our study, overall good performance but slight variation between participants might have led to higher repeatability in the performance-dependent regressors.
Another problem that affects all three regressors is the fact that some neural confounds with breath-holding are likely to be present (Banzett et al., 2000; Evans et al., 2002). If this neural activity is repeat-able, then vascular reactivity estimates will automatically show higher repeatability as well. Neural confounds are even more likely to affect the resting state scan, and we have shown over-estimation of vascular reactivity estimates that could be driven by neuronally driven fluctua-tions coinciding with CO2fluctuations.
One difference in our estimates in resting state— data based vascular reactivity measures to previous attempts is that we used an eyes-open resting state scan rather than an eyes-closed scan. Eyes-open acquisi-tion has been shown to yield more repeatable resting state networks but no difference in network strength (Patriat et al., 2013).McAvoy et al. (2008)reported higher frequency of CO2fluctuations in the
eyes-open vs. eyes-closed condition andPeng et al. (2013)found that the time lag between change in CO2and BOLD response is shorter in
the eyes closed condition than in the eyes open condition. However, they reported no significant difference in the model fit of the CO2
trace on the BOLD time series between the two conditions, indicating that both eyes open and eyes closed acquisition can be used to assess vascular reactivity. It is not clear whether the acquisition method (eyes open or closed) has an influence on the repeatability vascular reactivity estimates, and remains to be investigated.
Conclusions
We found good repeatability of vascular reactivity estimates in most of the regions analysed and excellent repeatability of vascular reactivity maps, when the breath-hold scan is used for estimation. Also, at least three breath-hold cycles are necessary in order to obtain repeatable maps.
Analysing the resting state scan with a CO2regressor in order to
ob-tain vascular reactivity measures showed poorer modelfit and repeat-ability than breath-holding. Also, vascular reactivity estimates in % change BOLD/mm Hg CO2were considerably more variable with the
resting state analysis, indicating the presence of some neural confounds in some participants. Vascular reactivity maps obtained with RestingCO2
and with BHCO2revealed good spatial agreement but % change BOLD/
mm Hg CO2only showed moderate correlation, suggesting that it is
not straight-forward to replace breath-holding with resting state scans in the assessment of vascular reactivity.
Acknowledgments
IL is grateful to the Cardiff University President's Research Scholarship scheme for its support. KM thanks the Wellcome Trust for his Career Development Fellowship and RW and XC acknowledge the support of the Higher Education Funding Council for Wales.
Conflict of interest
The authors declare no competingfinancial interests.
Appendix A. Supplementary data
Supplementary data to this article can be found online athttp://dx. doi.org/10.1016/j.neuroimage.2015.03.004.
References
Bandettini, P., Wong, E.C., 1997.A hypercapnia-based normalization method for im-proved spatial localization of human brain activation with fMRI. NMR Biomed. 10, 197–203.
Banzett, R.M., Mulnier, H.E., Murphy, K., Rosen, S.D., Wise, R.J., Adams, L., 2000.Breathlessness in humans activates insular cortex. Neuroreport 11, 2117–2120.
Birn, R.M., 2012.The role of physiological noise in resting-state functional connectivity. NeuroImage 62, 864–870.
Bright, M.G., Murphy, K., 2013.Reliable quantification of BOLD fMRI cerebrovascular reactivity despite poor breath-hold performance. NeuroImage 83, 559–568. Caceres, A., Hall, D.L., Zelaya, F.O., Williams, S.C.R., Mehta, M.A., 2009.Measuring fMRI
reliability with the intra-class correlation coefficient. NeuroImage 45, 758–768. Chang, C., Cunningham, J.P., Glover, G.H., 2009.Influence of heart rate on the BOLD signal:
the cardiac response function. NeuroImage 44, 857–869.
Cicchetti, D.V., 2001.The precision of reliability and validity estimates re-visited: distinguishing between clinical and statistical significance of sample size require-ments. J. Clin. Exp. Neuropsychol. 23, 695–700.
Evans, K.C., Banzett, R.B., Adams, L., McKay, L., Frackowiak, R.S.J., Corfield, D.R., 2002.BOLD fMRI identifies limbic, paralimbic, and cerebellar activation during air hunger. J. Neurophysiol. 88, 1500–1511.
Handwerker, D.A., Gazzaley, A., Inglis, B.A., D'Esposito, M., 2007.Reducing vascular variability of fMRI data across aging populations using a breathholding task. Hum. Brain Mapp. 28, 846–859.
Jenkinson, M., 2003.A fast, automated, n-dimensional phase unwrapping algorithm. Magn. Reson. Med. 49, 193–197.
Jenkinson, M., 2004.Improving the registration of B0-distorted EPI images using calculated cost function weights. Tenth Int. Conf. On Functional Mapping of the Human Brain. Jenkinson, M., Smith, S., 2001.A global optimisation method for robust affine registration
of brain images. Med. Image Anal. 5, 143–156.
Jenkinson, M., Bannister, P., Brady, M., Smith, S., 2002.Improved optimization for the robust and accurate linear registration and motion correction of brain images. NeuroImage 17, 825–841.
Kannurpatti, S.S., Biswal, B.B., 2008.Detection and scaling of task-induced fMRI-BOLD response using resting statefluctuations. NeuroImage 40, 1567–1574.
Kannurpatti, S.S., Motes, M., Rypma, B., Biswal, B.B., 2011.Increasing measurement accu-racy of age-related BOLD signal change: minimizing vascular contributions by resting-state-fluctuation-of-amplitude scaling. Hum. Brain Mapp. 32, 1125–1140. Kannurpatti, S.S., Rypma, B., Biswal, B.B., 2012.Prediction of task-related BOLD fMRI with
amplitude signatures of resting-state fMRI. Front. Syst. Neurosci. 6 (article 7). Kastrup, A., Li, T.Q., Takahashi, A., Glover, G.H., Moseley, M.E., 1998.Functional magnetic
resonance imaging of regional cerebral blood oxygenation changes during breath holding. Stroke 29, 2641–2645.
Kastrup, A., Krüger, G., Neumann-Haefelin, T., Moseley, M.E., 2001.Assessment of cerebro-vascular reactivity with functional magnetic resonance imaging: comparison of CO2
and breath holding. Magn. Reson. Imaging 19, 13–20.
Lipp, I., Murphy, K., Wise, R.G., Caseras, X., 2014.Understanding the contribution of neural and physiological signal variation to the low repeatability of emotion-induced BOLD responses. NeuroImage 86, 335–342.
Liu, P., Hebrank, A.C., Rodrigue, K.M., Kennedy, K.M., Park, D.C., Lu, H., 2013.A comparison of physiologic modulators of fMRI signals. Hum. Brain Mapp. 34, 2078–2088. Logothetis, N.K., Wandell, B.A., 2004.Interpreting the BOLD signal. Annu. Rev. Physiol. 66,
735–769.
Magon, S., Basso, G., Farace, P., Ricciardi, G.K., Beltramello, A., Sbarbati, A., 2009. Re-producibility of BOLD signal change induced by breath holding. NeuroImage 45, 702–712.
McAvoy, M., Larson-Prior, L., Nolan, T.S., Vaishnavi, S.N., Raichle, E., Avossa, G., 2008. Resting states affect spontaneous BOLD oscillations in sensory and paralimbic cortex resting states affect spontaneous BOLD oscillations in sensory and paralimbic cortex. J. Neurophys. 100, 922–931.
Murphy, K., Harris, A.D., Wise, R.G., 2011.Robustly measuring vascular reactivity differ-ences with breath-hold: normalising stimulus-evoked and resting state BOLD fMRI data. NeuroImage 54, 369–379.
Patriat, R., Molloy, E.K., Meier, T.B., Kirk, G.R., Nair, V.A., Meyerand, M.E., Prabhakaran, V., Birn, R.M., 2013.The effect of resting condition on resting-state fMRI reliability and consistency: a comparison between resting with eyes open, closed, andfixated. NeuroImage 78, 463–473.
Peng, T., Niazy, R., Payne, S.J., Wise, R.G., 2013.The effects of respiratory CO2fluctuations
in the resting-state BOLD signal differ between eyes open and eyes closed. Magn. Reson. Imaging 31, 336–345.
Poulin, M.J., Liang, P.J., Robbins, P.A., Liang, P., 1996.Dynamics of the cerebral bloodflow response to step changes in end-tidal PCO2 and PO2 in humans. J. Appl. Physiol. 81, 1084–1095.
Riecker, A., Grodd, W., Klose, U., Schulz, J.B., Gröschel, K., Erb, M., Ackermann, H., Kastrup, A., 2003.Relation between regional functional MRI activation and vascular reactivity to carbon dioxide during normal aging. J. Cereb. Blood Flow Metab. 23, 565–573. Scouten, A., Schwarzbauer, C., 2008.Paced respiration with end-expiration technique
offers superior BOLD signal repeatability for breath-hold studies. NeuroImage 43, 250–257.
Shrout, P., Fleiss, J., 1979.Intraclass correlations: uses in assessing rater reliability. Psychol. Bull. 86 (2), 420–428.
Smith, S., 2002.Fast robust automated brain extraction. Hum. Brain Mapp. 17, 143–155. Thomason, M.E., Glover, G.H., 2008.Controlled inspiration depth reduces variance in
breath-holding induced BOLD signal. NeuroImage 39, 206–214.
Thomason, M.E., Burrows, B.E., Gabrieli, J.D.E., Glover, G.H., 2005.Breath holding reveals differences in fMRI BOLD signal in children and adults. NeuroImage 25, 824–837.
Thomason, M.E., Foland, L.C., Glover, G.H., 2007.Calibration of BOLD fMRI using breath holding reduces group variance during a cognitive task. Hum. Brain Mapp. 28, 59–68. van den Bulk, B.G., Koolschijn, P.C.M.P., Meens, P.H.F., van Lang, N.D.J., van der Wee, N.J.A., Rombouts, S.A.R.B., Vermeiren, R.R.J.M., Crone, E.A., 2013.How stable is activation in the amygdala and prefrontal cortex in adolescence? A study of emotional face processing across three measurements. Dev. Cogn. Neurosci. 4, 65–76.
van den Heuvel, M.P., Hulshoff Pol, H.E., 2010.Exploring the brain network: a review on resting-state fMRI functional connectivity. Eur. Neuropsychopharmacol. 20, 519–534. Wise, R.G., Ide, K., Poulin, M.J., Tracey, I., 2004.Restingfluctuations in arterial carbon dioxide induce significant low frequency variations in BOLD signal. NeuroImage 21, 1652–1664.