427 1. Introduction
Since the mid-1980s, the link between the generation of new knowledge, technological progress and economic growth has been an important topic in the macroeconomic literature (Romer, 1986; 1990; Aghion - Howitt, 1992; 2005; Jones, 2005; British-Lotz - Pouris, 2012) and work on regional eco-nomics (Salter - Martin, 2001; Maggioni - Uberti, 2008; Mueller, 2006). Since the mid 2000s, there has been a strong focus on analysis of the channels through which knowledge is transferred from research institutions to organi-zations, which then develop it to produce technological innovations.
The interest in the channels of knowledge transfer from universities to the non-academic domain is rooted in the gradual modernization since the mid 1990s, of the concept of knowledge transfer and the role of universities in the socio-economic system. This shift is based on two conceptually differ-ent, but somehow convergent trends. On the one hand, in the knowledge-based economy, the ability to produce and disseminate new information has become increasingly important for innovation and the generation of wealth. This has resulted in universities substantially rethinking their role (Etzkowitz, 1998; 2003; Etzkowitz - Leydesdorff, 2000) and displaying a stronger orien-tation to the explicit inclusion – in the design and implemenorien-tation of their activities – of systemic and community-relevant goals (Laredo, 2007). On the other hand, tighter national budgets are requiring public spending – includ-ing university fundinclud-ing – to be better justified. Especially in Italy, this has re-sulted in an intensification of relations between universities and business. It has resulted in more collaborative research, which, on the one hand, is an important channel for knowledge transfer and, on the other, is a source of alternative funding for the universities (Beath et al., 2003; Abraham et al., 2009).
The Effects of Public Research Funding on Academic
En-gagement
by Alessandro Muscio, Davide Quaglione and Giovanna Vallanti
ECONOMIA POLITICA / a. XXXI, n. 3, dicembre 2014 Received October 2012, Approved October 2014.
428
Several authors have stressed the importance of various forms of coop-eration between universities and enterprises, described by Perkman et al. (2013) as «academic engagement», which, so far, has received small atten-tion. Collaborative research, research to order and consulting (see, e.g. Perk-mann - Walsh, 2009) are particularly relevant here. Because of their high re-lational content – they typically involve institutions and organizations with different characteristics (see Bercovitz - Feldman, 2011), and produce signifi-cant spillovers due to the learning processes that are activated by this inter-action – they are valued by many firms more than more formal channels of technology transfer (Cohen et al., 2002).
At the same time, in a scenario of shrinking public funding for academic research, a greater commitment from universities to promoting academic en-gagement is of vital importance. Despite the possible side effects1 of more
intense and closer partnerships with businesses (e.g., «academic drift» – Elz-inga, 1985; the «skewing» or the «secrecy problem» – Florida - Cohen, 1999; Blumenthal et al., 1997; «selection bias» – Gulbrandsen - Smeby, 2005), there is no doubt that these activities represent viable sources of external resources without which the financial sustainability of universities would be at risk.
However, this is not to imply that public resources can be replaced by ex-ternal funding. The ability of universities to undertake these activities and to collect external funding depends on the extent of their publicly funded aca-demic research. Although conceptually it is acknowledged that private and public funding for university research are substitutes, for example, because of the downward sloping labour supply curve and the existence of time con-straints (Mitchell - Rebne, 1995; Perkmann - Walsh, 2008), it is similarly ac-knowledged that there is complementarity between these two sources of fund-ing, based on the theoretical public good nature of knowledge and the cumu-lative nature of the innovation process (Arrow, 1962; Aghion - Howitt, 2005; Jones, 2005). For instance, David and Hall (2000) and David et al. (2000) show that there are several circumstances where this complementary relation-ship between private and public funding for private research is demonstrated.
A similar relationship exists between public and private funding for uni-versity research. For example, Jensen et al. (2010) show that public funding of universities boosts the revenues obtained from consulting activities with firms, thanks to spillover effects. Other authors explain this complementa-rity on the basis of reputation and signalling mechanisms (Connolly, 1997; Blume-Kohout et al., 2009); the amount of public funding awarded to the university signals its research quality.
The aim of this paper is to investigate empirically the impact of public funding for university research, on external funding, measured as revenues
1 The literature provides evidence that collaboration between universities and industry
can have several positive effects (e.g. Thursby - Thursby, 2011; Gulbrandsen - Smeby 2005), especially for firms that develop internal research skills, useful to increase so-called absorptive capacity (Arora - Gambardella, 1994; Powell et al., 1996; Kira, 2009).
429 from collaborative research agreements, research to order and consulting activities2. Drawing on Muscio et al. (2013), the present study provides an
econometric investigation of these issues exploiting financial data provided by the Italian Ministry of Education, University and Research (MIUR), re-lated to university departments’ research activities in the 14 scientific areas defined by the Ministry, over the period 2006-2011.
The paper is structured as follows. Section 2 provides a description of the database and the econometric specification. Section 3 discusses the results of the econometric analysis. Section 4 provides some suggestions for policy.
2. Empirical analysis
2.1. Description of the data and methodology
The empirical analysis aims to identify the determinants of university de-partments’ capabilities to raise external funding through research to order and consultancy activities with private or public non-academic organizations. In particular, we investigate whether and to what extent public funding for university research negatively affects the amount of resources obtained through academic engagement activities or whether there is complementarity between these two funding channels.
The study is based on financial and structural data on the population of Italian university departments engaged in research in one of the 14 scientific areas identified by the National University Council (CUN). We analyse data on 1,882 departments in 60 Italian public3 universities located in 53
prov-inces. The analysis includes all the departments for which data for the entire period 2006-2011 are available. The database provided by MIUR provides information on the amount and sources of funding, the amount and type of employees, existence of a university Industrial Liaison Office or an office to manage patent applications to the European Patent Office (EPO). The da-tabase is enriched with additional control variables for the economic char-acteristics of the provinces where the departments are located, and data on research quality published by MIUR (CIVR-VTR).
2 As argued so far, revenues related to collaborative research, to research to order and
to consulting may be taken as a partial indicator of the knowledge transfer occurring through academic engagement activities.
3 Private universities are excluded since public funding is structurally less important
for them (by law, it must not be prevalent) and because they have more autonomy which allows them adopt different forms of governance from state universities (e.g. the appointment of board members is often hierarchical and non-elective; the role of academic bodies in the governance system is often different and based on a core which typically is the board of directors for private universities, and the Academic Senate for public ones). Online universities are also excluded since their activities involve teaching almost exclusively.
430
2.2. Recent changes to academic research funding in Italy
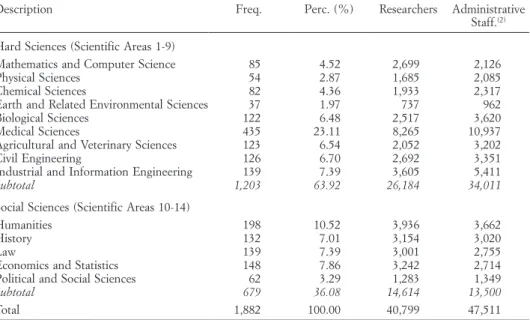
Table 1 shows the distribution of departments according to their (main) entific area: 63.92% of the departments are engaged in the so-called hard sci-ences (scientific areas 1-9), and the remainder in economics, social scisci-ences and human sciences. There is a majority of departments engaged in medical sciences (435 units corresponding to 23.11% of the total population of departments).
Table 2 shows the average amount of funding received by university de-partments, broken down by source, in 2011, and the changes since 2006.
In 2011, funding from academic engagement activities was the major source of revenue for university departments, accounting for the 27% of to-tal funding. This share rises to 29% in the case of departments specialized in hard sciences. The next most important source of research funding is the European Union and local and central government. In the period considered, overall nominal department revenues increased by 25% (16.69% if we con-sider average funding per researcher), primarily due to a substantial increase in funding from the European Union, other local public administrations4 and
research to order and consulting activities.
4 The increase in regional funding is due in part to the reform of Title V of the
Constitution which, on the basis of the principle of subsidiarity, has led to an increase in local responsibility for research and innovation policy.
Tab. 1. Composition of the population of departments by Scientific Area(1)
Description Freq. Perc. (%) Researchers Administrative
Staff.(2) Hard Sciences (Scientific Areas 1-9)
Mathematics and Computer Science 85 4.52 2,699 2,126
Physical Sciences 54 2.87 1,685 2,085
Chemical Sciences 82 4.36 1,933 2,317
Earth and Related Environmental Sciences 37 1.97 737 962
Biological Sciences 122 6.48 2,517 3,620
Medical Sciences 435 23.11 8,265 10,937
Agricultural and Veterinary Sciences 123 6.54 2,052 3,202
Civil Engineering 126 6.70 2,692 3,351
Industrial and Information Engineering 139 7.39 3,605 5,411
Subtotal 1,203 63.92 26,184 34,011
Social Sciences (Scientific Areas 10-14)
Humanities 198 10.52 3,936 3,662
History 132 7.01 3,154 3,020
Law 139 7.39 3,001 2,755
Economics and Statistics 148 7.86 3,242 2,714
Political and Social Sciences 62 3.29 1,283 1,349
Subtotal 679 36.08 14,614 13,500
Total 1,882 100.00 40,799 47,511
431 The higher frequency of university-industry collaborations highlighted in Muscio (2008), is largely due to increased knowledge transfer activity in Italy as in other industrialized countries. In contrast, MIUR funding decreased significantly due to the freezing of the FIRB and PRIN programmes. This reduction in public funding is less drastic in scientific areas 10-14 where rev-enue from MIUR is at almost the same level as funding derived from aca-demic engagement activities.
In 2006, the revenue from MIUR was the primary source of funding; in 2011, university departments were more reliant on revenue from other institutions such as public administrations and other public research
insti-Tab. 2. Average funding of the Italian university departments. year 2011 and change over 2006
Funding source 2011 2011
(%) 2006 (%) (2006-2011)D% per researcher D% (2006-2011) All Scientific Areas
Academic Engagement activities 207,509 27.42 25.61 28.41 15.54
European Union (EU) 117,363 15.51 9.28 108.87 79.74
Other Public Institutions 114,505 15.13 10.49 80.30 65.28
MIUR 95,871 12.67 20.14 –21.39 –24.48
University 83,369 11.02 18.94 –27.29 –24.51
Italian Not-for-Profit Organizations 51,365 6.79 3.41 148.87 159.06
Italian Firms 25,214 3.33 4.32 –3.51 –1.82
Italian Public Research Institutions 23,912 3.16 2.74 44.01 58.37
Other(1) 37,691 4.98 5.08 22.65 18.36
Total 756,797 100.00 100.00 25.00 16.69
Hard Sciences
Academic Engagement activities 306,410 29.20 27.22 40.68 37.52
European Union (EU) 173,747 16.56 9.33 132.80 127.57
Other Public Institutions 162,249 15.46 10.77 88.34 84.11
MIUR 127,327 12.13 20.49 –22.32 –24.06
University 89,066 8.49 16.35 –31.92 –33.45
Italian Not-for-Profit Organizations 71,640 6.83 3.60 148.52 142.94
Italian Firms 36,845 3.51 4.66 –1.26 –3.48
Italian Public Research Institutions 35,476 3.38 2.79 58.91 55.34
Other(1) 46,726 4.45 4.78 22.15 19.40
Subtotal 1,049,485 100.00 100.00 31.18 28.23
Human and Socio-economic Sciences
Academic Engagement activities 45,904 16.48 16.15 13.69 12.45
European Union (EU) 25,231 9.06 9.00 12.17 10.95
Other Public Institutions 36,490 13.10 8.86 64.69 62.90
MIUR 44,471 15.97 18.14 –1.94 –3.01
University 74,061 26.59 34.04 –12.97 –13.92
Italian Not-for-Profit Organizations 18,235 6.55 2.27 220.84 217.35
Italian Firms 6,209 2.23 2.28 8.82 7.64
Italian Public Research Institutions 5,015 1.80 2.46 –18.55 –19.43
Other(1) 22,926 8.23 6.79 34.98 33.51
Subtotal 278,542 100.00 100.00 11.41 10.20
Note: (1) «Other» includes funding from private and public foreign entities. D% is calculated as the per-centage variation over initial year 2006.
432
tutions. The reduction in MIUR funding is especially relevant if we con-sider funding per researcher5, which takes account also of the increase in
personnel due to the recruitment of young researchers. On the basis of this measure, during the period considered, funding from MIUR available to research staff decreased by 24.48%. Finally, in the same period, the al-ready limited revenue from business activities not related to research con-tracts and consultancies, also decreased. The item «Italian firms» includes funding for scholarships, donations, sponsorship of events, etc., which are not classified as academic engagement activities. Table 3 shows the ranking for the top 20 departments for ability to attract funding from academic en-gagement6.
Table 3 shows that scientific areas 8 and 9, that is, civil engineering and architecture and industrial engineering and information, are the most highly ranked. Departments in the Polytechnic of Milano occupy 8 of the top 20 positions in the 1,882 departments analysed. Table 3 shows also that there is a high degree of variability in the level of primary sources of public fund-ing among the departments considered in our analysis. The number of re-searchers (full professors, associate professors, university rere-searchers, Full Time Equivalent – FTE) per department varies significantly, from a 30.5 in the Department of Engineering Materials and Industrial Technologies in the University of Trento, to 172.3 in the Department of Electronics and Informa-tion at the Polytechnic of Milano.
2.3. Econometric specification
Table 4 presents the descriptive statistics for the variables used in the empirical analysis7.
The dependent variable is f_acadeng, which is the yearly amount of funding that the department collects through academic engagement activities (including research to order and consulting) with non-academic public and private entities. Table 4 shows that the variable f_acadeng is continuous, but for 38% of the observations (department-year) the amount of funding from academic engagement is zero. This feature of the data allows us to study the phenomenon of interest by applying a tobit model. In order to control for the persistence over time of the ability of departments to raise funds through research to order and consultancies, we estimate a dynamic model whose
5 «Researchers» refers to the set of full professors, associate professors and university
researchers and is the definition that applies to the tables.
6 Funding is normalized by the number of researchers expressed as FTE and averaged
over the period 2006-2011.
7 Appendix Table A1 shows the correlations among the various forms of funding.
There is a clear positive correlation at departmental level for ability to attract resources from different sources.
T
ab
. 3
.
D
epartments ranking accor
ding to the amount of funding from academic engagement (2006-2011. top 20 departments)
N . Department name University Scientific Area Number of Researchers Funding (1) Academic engagement MIUR EU Other Public Instit. (1) (2) (3) (4) 1 M echanics Polytechnic MI 9 90.5 4, 215.0 338.8 255.2 218.3 2 E
lectronics and informatics
Polytechnic MI 9 172.3 3, 913.0 1, 003.7 1616.2 614.3 3 E ngineering management Polytechnic MI 9 76.8 3, 471.2 405.7 499.8 358.2 4 Industrial engineering P erugia 9 35.2 3, 139.8 493.5 67.2 261.0 5 C hemistry
, materials and chemical engineering
Polytechnic MI 9 99.7 3, 055.5 512.0 645.2 438.0 6 A
rchitecture and planning
Polytechnic MI 8 133.3 2, 583.0 171.0 258.0 306.5 7 P athology
, experimental and clinical medicine
U dine 6 31.0 2, 580.7 67.2 22.5 154.0 8 D
epartment of environment, land and infrastructure
engineering Polytechnic TO 8 45.0 2, 554.5 176.0 154.3 349.5 9 Innovation engineering Univ . of S alento 9 100.5 2, 266.7 1, 770.5 158.2 2, 406.3 10 Structural engineering Polytechnic MI 8 94.3 2, 199.2 284.2 267.0 216.2 11 B
uilding environment sciences and technology
Polytechnic MI 8 90.0 2, 148.5 102.2 172.7 98.8 12 E ngineering S.A nna of P isa 9 32.8 2, 017.3 632.7 4, 885.3 549.0 13 H
ydraulics, transports and roads
R oma La Sapienza 8 48.2 2, 011.4 188.8 584.0 171.6 14 M
echanical, nuclear and production engineering
P isa 9 40.8 1, 946.0 211.3 184.0 406.2 15 M
aterials and production engineering
N apoli Federico II 9 41.7 1, 781.8 747.8 252.8 183.0 16 A natomy , diagnostic pathology , forensic science,
hygiene and public sanitation
C atania 6 30.7 1, 780.5 8.5 0.0 137.8 17
Informatics, systems engineering and telematics
G enova 1 50.7 1, 588.2 487.2 1, 733.7 85.0 18
Structural and geotechnic engineering
R oma La Sapienza 8 52.5 1, 552.2 97.2 326.2 150.2 19 M
aterials and industrial technology engineering
Trento 9 30.5 1, 529.8 98.3 276.2 203.5 20 E
nvironmental, hydraulic, infrastructures and
surveying engineering Polytechnic MI 8 62.3 1, 479.0 315.8 173.5 255.7 Median – 27.8 56.3 40.0 6.7 22.3 Note : (1) A
verage funding in the considered period, normalized by the number of researchers (full professors, associate professors and
T
ab
. 4
.
V
ariables description. data sources and descriptive statistics
V ariable Definition Source Period A verage Standard Dev . Min Max
Funding Source f_acadeng
Academic engagement MIUR 2006-2011 186.17 403.64 0 6, 071 f_acadeng_s Academic engagement (Y es /N o) MIUR 2006-2011 0.72 0.45 0 1 f_eu European Union MIUR 2006-2011 87.76 356.45 0 8, 924 f_miur MIUR MIUR 2006-2011 81.06 175.21 0 3, 308 f_uni Internal T
ransfers (within the university)
MIUR 2006-2011 106.41 144.84 0 2, 268 f_other_pubinst
Funding from other Public Institutions (central and local)
MIUR 2006-2011 94.67 281.26 0 7, 305
Characteristics of the department p_tot Number of Full prof., Assoc. prof. and university Researchers
MIUR 2006-2011 76.16 54.19 0 569 share_res
Share of research staff on total department’
s staff MIUR 2006-2011 0.86 0.09 0.4 1 share_phd
Share of Ph.D students on total department’
s staff MIUR 2006-2011 0.25 0.17 0 1.15 rating_dep
Rating of research quality of the Scientific Area as resulting from the T
riennial Evaluation of Research Exercise CIVR,VTR 2001-2003 (cumulated value) 0.78 0.10 0.2 1
Characteristics of the university dim_un1
Small university (up to 10,000 students)
MIUR 0.07 0.26 0 1 dim_un2
Medium university (between 10,000 and 15,000 students)
MIUR 0.10 0.29 0 1 dim_un3
Big university (between 15,000 and 40,000 students)
MIUR 0.45 0.50 0 1 dim_un4
Mega university (over 40,000 students)
MIUR 0.38 0.49 0 1 Polytechnic Polytechnic university (Y es /N o) W eb Site 0.04 0.19 0 1 ilo
Presence of an Industrial Liaison Office (ILO) in the university
MIUR 0.85 0.36 0 1 ilo_age
Age of the ILO
MIUR
4.49
3.19
0
14
Geographic characteristics geo_s
Geographic area: Southern Italy
0.32
0.47
0
1
geo_c
Geographic area: Central Italy
0.27
0.44
0
1
geo_ne
Geographic area:
North-E ast Italy 0.20 0.40 0 1 geo_no
Geographic area:
North-W est Italy 0.41 0.49 0 1 epo_prov
Number of European patents registered in the Province of the university
KITES Center , Bocconi University 2000-2006 (cumulated value) 11.63 17.72 0 58.70 avdim_manuf A
verage dimension of the firms localized in
the
Province of the university
IST A T 2001 7.43 2.32 3.11 11.78
435 regressors include the lagged dependent variable. The dynamic tobit model (panel) can be specified as follows:
(1) , ,..., , ,..., , max y y x c c u i N t T y y 1 1 0 ’ it it it i t it it it 1 c b = + + + + = = = ) ) -^ h
where yit and yit – 1 are the amount of funding collected by the i-th
depart-ment from academic engagedepart-ment activities at time t and t–1, ci are (random)
department-specific effects, ct are time effects8 and uit is the error term. The
vector of controls, xit, includes a set of specific department level
determi-nants, including the amount of public funding for research from four main sources: (1) European funding (f_eu), (2) national MIUR funding (f_miur) (3) funding from other national public bodies (f_other_pubinst) and (4) university internal transfers (f_uni). These regressors enter the model with a one- and/or two-year lag in order to capture more accurately the possi-ble lagged effects of different forms of financing on the ability to raise funds through research to order and consultancies, and to mitigate potential re-verse causality problems between funds from academic engagement and other forms of funding9.
In addition to public funding, the vector xit includes a set of controls for
departmental ability to raise private funding, for example, department size (measured as numbers of researchers and numbers of administrative staff), department quality/reputation, localization, main scientific research area, structural characteristics of the university and local (provincial level) eco-nomic characteristics, which proxy for local demand for technology transfer10.
This same specification (1) is used also to determine whether the amount of funding from public sources is correlated to the probability of observing positive funding streams from academic engagement (extensive margin). We apply a probit model in which the binary f_acadeng_s dependent variable takes the value 1 if the department has received funding from academic en-gagement activity in a given year, and 0 otherwise.
Due to the truncated nature of the dependent variable in both the mod-els estimated (tobit for the intensive margin and probit for the extensive margin), we cannot use conventional techniques for estimating linear panel models. In addition, the presence of the lagged dependent variable among the regressors makes the application of standard estimation methods more
8 Time dummies control, among other things, for the cyclical nature of external funding. 9 Regarding the 3 main sources of public funding (MIUR, EU and internal transfers) data
are available from 2005. This allows us to introduce up to 2 lags of the variables considered without reducing the time span of the analysis.
10 See Table 4 for a more detailed definition of the control variables and the related
436
difficult. Although, in theory, the fixed effects model requires less strong assumptions about the unobservable individual component ci, use of this
method to estimate a dynamic panel data tobit (probit) model has some limi-tations. In particular, the time span necessary to obtain consistent estimates must be sufficiently wide (Honoré, 1993).
In light of the limited time span of our sample, we assume a random un-observable component which is department specific and time invariant. Given the panel nature of our data and the dynamics of the model, the initial condi-tions can be a further complication. The initial condicondi-tions issue is treated using the methodology suggested by Wooldridge (2005). The estimator suggested by Wooldridge (2005) is implemented by estimating a random effects model, type tobit/probit, which includes among the regressors, together with the other controls, the lagged dependent variable as well as the first observation and the average values of the variables at department level in the dataset11.
3. Results
Table 5 presents the results of the tobit model estimated on the entire population of Italian university departments; Table 6 presents the separate estimations for departments specialized in hard sciences (scientific areas 1-9) and those specialized in economics, social sciences and human sciences (ar-eas 10-14)12. Table 5 column (1) refers to the results obtained from a
stand-ard OLS linear model estimation. In column (2), the coefficients are es-timated using a tobit model that does not take account of the presence of heterogeneity at the individual department level (pooled tobit). Columns (3) and (4) respectively, show the coefficients and the marginal effects of the dy-namic tobit model, obtained by controlling for the presence of unobserved individual heterogeneity.
The estimates presented in Tables 5 and 6 show that there is a high de-gree of persistence in departmental ability to access funding from academic engagement activities, implied by the positive and highly significant coef-ficient of the lagged dependent variable. This means that access to these sources of external funding has a positive impact on both the probability of obtaining external funds in the future and the amount of that funding13.
11 This method is widely applied in the empirical literature (see, e.g. Triguero - Córcoles,
2013; Bettina, 2009) because it is simple to implement and its statistical properties make it particularly suitable for estimations of dynamic panel models with limited time spans, i.e. 5-8 years (Alpaslan, 2009).
12 For reasons of space, Table 6 reports only the coefficients of the dynamic tobit, our
preferred specification; the OLS estimates are omitted. Results are available on request.
13 The existence of increasing returns to resources for academic engagement can
be interpreted as a form of Matthew effect, which leads to a progressive concentration of monetary resources and talent (Merton, 1968). This implies an increasing divergence between departments characterized by a high degree of academic engagement (expectation of
Tab. 5. Tobit model: all Scientific Areas (1-14)
Dep. var = f_acadeng OLS Pooled tobit Dynamic tobit
Coef. Coef. Coef. Marg. effects
(1) (2) (3) (4) f_acadeng(–1) 0.813 0.827 0.515 0.348 (0.029)*** (0.009)*** (0.017)*** (0.013)*** Source of funding f_eu(–1) 0.008 0.007 0.008 0.006 (0.014) (0.011) (0.010) (0.0070) f_eu(–2) 0.043 0.041 0.044 0.030 (0.024)* (0.012)*** (0.012)*** (0.0079)*** f_miur(–1) –0.057 –0.047 –0.056 –0.038 (0.039) (0.017)*** (0.017)*** (0.0113)*** f_miur(–2) 0.103 0.104 0.086 0.058 (0.043)** (0.016)*** (0.016)*** (0.0108)*** f_uni(–1) –0.047 –0.041 –0.032 –0.021 (0.029) (0.023)* (0.023) (0.0156) f_uni(–2) –0.015 0.005 –0.007 –0.005 (0.032) (0.024) (0.024) (0.0164) f_other_pubinst(–1) –0.000 0.014 0.014 0.010 (0.016) (0.011) (0.011) (0.008)
Characteristics of the department
p_tot(–1) 0.558 0.749 0.930 0.628 (0.087)*** (0.073)*** (0.093)*** (0.0631)*** share_res(–1) 121.568 91.275 133.075 89.882 (29.540)*** (42.242)** (54.793)** (37.017)** share_phd(–1) –54.603 –44.964 –67.505 –45.594 (13.761)*** (19.781)** (24.137)*** (16.304)*** rating_dep 25.050 86.346 127.677 86.236 (25.896) (43.052)** (59.442)** (40.143)** Characteristics of the university
dim_un1 9.872 9.247 16.988 11.653 (12.873) (14.184) (19.655) (13.688) dim_un2 6.426 –35.522 –43.724 –28.383 (8.556) (12.258)*** (16.836)*** (10.467)*** dim_un3 13.000 18.600 22.908 15.508 (5.786)** (7.400)** (10.179)** (6.906)** ilo –11.189 –14.581 –15.782 –10.784 (6.598)* (9.589) (13.014) (8.994) ilo_age 2.053 2.052 3.051 2.061 (0.788)*** (1.104)* (1.495)** (1.010)** polytechnic 130.594 124.081 164.398 127.027 (25.359)*** (17.345)*** (23.841)*** (20.405)*** Geographic characteristics epo_prov 0.673 0.454 0.887 0.599 (0.246)*** (0.293) (0.406)** (0.2743)*** avdim_manuf –0.878 0.473 –0.220 –0.149 (2.319) (2.337) (3.153) (2.1299) R2/pseudo R2 0.75 0.73 0.71 –
Year dummy yes yes yes –
Scientific areas dummy yes yes yes –
Geographic areas dummy yes yes yes –
N. observations 8,202 8,202 8,202 –
N. departments – – 1,882 –
Note: ***, **, * significant at 1%, 5% and 10% respectively. Standard errors in parentheses. (–1)
and (–2) refer to a 1 or two years lags of the considered variable. Due to limits of space, the coefficient of the intercept is not presented in the Table.
Tab. 6. Dynamic tobit: Macro Scientific Areas
Dep. var = f_acadeng Hard Sciences Human and Socio-Economic Sciences Coef. Marg. Effects Coef. Marg. Effects
(1) (2) (3) (4) f_acadeng(–1) 0.577 0.466 0.152 0.063 (0.021)*** (0.018)*** (0.035)*** (0.015)*** Source of funding f_eu(–1) 0.006 0.005 0.030 0.012 (0.012) (0.009) (0.026) (0.011) f_eu(–2) 0.041 0.033 0.050 0.021 (0.013)*** (0.011)*** (0.028)* (0.012)* f_miur(–1) –0.059 –0.048 –0.001 –0.001 (0.019)*** (0.016)*** (0.037) (0.015) f_miur(–2) 0.091 0.073 0.014 0.006 (0.018)*** (0.015)*** (0.034) (0.014) f_uni(–1) –0.044 –0.036 0.014 0.006 (0.027) (0.022)* (0.034) (0.014) f_uni(–2) –0.010 –0.008 0.008 0.003 (0.029) (0.023) (0.036) (0.015) f_altre_amn(–1) 0.012 0.010 –0.009 –0.004 (0.013) (0.011) (0.020) (0.008)
Characteristics of the department
p_tot(–1) 0.960 0.775 0.513 0.213 (0.109)*** (0.088)*** (0.131)*** (0.054)*** share_res(–1) 178.232 143.808 49.426 20.491 (64.415)*** (51.982)*** (74.574) (30.923) share_phd(–1) –97.042 –78.299 –14.043 –5.822 (31.844)*** (25.692)*** (22.504) (9.331) rating_dep 177.284 143.043 32.969 13.669 (82.083)** (66.221)** (55.352) (22.948) Characteristics of the university
dim_un1 27.572 22.562 4.711 1.983 (23.068) (19.132) (24.667) (10.545) dim_un2 –36.093 –28.539 –28.491 –10.923 (21.812)* (16.878)* (17.151)* (6.039)* dim_un3 28.729 23.228 11.396 4.736 (12.853)** (10.411)** (10.703) (4.461) ilo –22.241 –18.120 9.373 3.799 (16.577) (13.632) (13.408) (5.313) ilo_age 4.680 3.776 –0.377 –0.156 (1.856)** (1.497)** (1.603) (0.665) polytechnic 152.792 132.135 60.019 30.360 (26.472)*** (24.148)*** (52.540) (31.377) Geographic characteristics epo_prov 1.289 1.040 0.061 0.025 (0.517)** (0.418)** (0.415) (0.172) avdim_manuf 0.127 0.102 4.101 1.700 (3.849) (3.106) (3.550) (1.472) R2/pseudo R2 0.74 – 0.61 –
Year dummy yes – yes –
Scientific areas dummy yes – yes –
Geographic areas dummy yes – yes –
N. observations 5,202 – 3,000 –
N. departments 1,203 – 679 –
Note: ***, **, * significant at 1%, 5% and 10% respectively. Standard errors in parentheses. (–1)
and (–2) refer to a 1 or two years lags of the considered variable. Due to limits of space, the coefficient of the intercept is not presented in the Table.
439 For the relationship between the various forms of financing (Table 5), it is clear that, ceteris paribus, there is complementarity between the amount of both European (f_eu) and MIUR (f_miur) funding, and departmental ability to raise funds through academic engagement14.
According to our estimates, for each additional euro of MIUR funding, the department obtains an overall increase of 0.020 Euros in funding from contract research and consultancy15, with an estimated elasticity of around
0.01816. The estimated coefficient related to EU funding is qualitatively similar
although it is greater in magnitude. The long-term impact17, which takes into
account the high persistence of external funding, is approximately 0.031 for MIUR funding and 0.056 for EU funding. These effects are in line with those estimated in other empirical works (among others, see Jensen et al., 2010)18.
The presence of complementarity between public and external funding is confirmed even if we consider those departments whose research is more readily applicable in the manufacturing sector, separately (Table 6, Column 2). The estimated long-term impact of MIUR and European Union funds on academic engagement by departments in scientific areas 1-9 (Table 6, Col-umn 2), is significantly higher for both forms of funding (respectively 0.048 for MIUR funds and 0.071 for European funds). In contrast, the spillover effects from publicly funded research and manufacturing sector oriented re-search are less clear-cut for departments engaged in rere-search on socio-eco-nomics and human sciences (Table 6, Column 4).
Public funding from other government and local institutions (f_other_ pubinst)19 does not generally have a significant impact on academic
engage-increased collaboration with non-academic partners and engage-increased revenue) and the remaining departments.
14 If the presence of unobserved heterogeneity at department level is taken into
account(Columns 3 and 4), the overall effect of EU funding is lower, although still significant at conventional levels.
15 In the case of MIUR funding, the estimated coefficients of the first and second lags
have the opposite signs. This may reflect an «crowding out» effect of public funding in relation to raising external funding, in the very short term. However, the overall effect, obtained by summing the marginal effects of the two lagged variables f_miur(–1) and f_ miur(–2), is positive and statistically significant.
16 The elasticity was calculated on the basis of the total marginal effects (the sum of the
estimated coefficients of the two lags) in Table 5 Column 4.
17 In a dynamic model with a lagged dependent variable and lags in the independent
variables, the overall long term effect of each regressor is obtained by adding all the coefficients of the regressor (lagged and not lagged), and multiplying the amount by the estimated factor of persistence which is equal to
1 1
t
- t, if tt is the estimated coefficient of the lagged dependent variable (Pivetta - Reis, 2007).
18 Using data on individual researchers, Jensen et al. (2010) find evidence of a positive
spillover effect from publicly financed university research on research funding from the manufacturing sector. The estimated elasticity is 0.06.
19 The variable f_other_pubinst enters with one lag in both the tobit and probit
440
ment activities or university internal transfers (f_uni). The latter result is not surprising since internal transfers are not intended to fund research, but are aimed simply at financing overheads or channelling financial resources already allocated to the department. Table 7 shows the impact of different types of public funding on the extensive margin, that is, on the probability of observing a positive amount of funding resulting from academic engage-ment activities.
Similarly, we estimated the probit model for the whole population of de-partments (Table 7, Columns 1 and 2) and then separately for those depart-ments researching in the hard sciences (Columns 3 and 4) and social sciences and socio-economics (Columns 5 and 6). The results for the extensive mar-gin in terms of the probability of gathering resources from academic engage-ment in a given year, confirm those for the intensive margin. The estimated coefficients of the probit model (Column 4) show that the observed reduc-tion in MIUR funding to departments in scientific areas 1-9 (approximately 37,520 Euros on average) since 2006, is associated with a decrease of ap-proximately 2.7% in the chance of raising funds through academic engage-ment20. This decline is offset by a greater availability of funding from the
Eu-ropean Union (an increase of 127,570 Euros on average), which produced a 3.2% increase in the probability of obtaining resources through academic engagement.
Similar to the tobit model, the probit model does not show any signifi-cant relationship between public funding and funding from academic en-gagement for socio-economics and human sciences departments.
In relation to the characteristics of the departments and universities to which they belong, the tobit and probit estimates show that the structural and organizational characteristics have a remarkable impact on the ability of the department to raise external funding21. Departments in universities
spe-cialized in technology-engineering fields (polytechnic) seem to benefit from factors, such as the presence of administrative structures and practices that foster stronger relationships with business, the territory, and scale effects related to the number of departments engaged in hard sciences, that facili-tate the process of collaboration with entities in the non-academic domain. The ability to access external financing is also (positively) associated with the presence of an industry liaison officer which helps researchers to establish
20 As in the tobit model, long-term marginal effects are calculated as discussed in
foot-note 16.
21 The intrinsic nature of the research carried out by the department has a significant
impact on the department’s ability to establish relations with non-academic entities. According to our estimates, it is clear that departments engaged in research in engineering and techno-logy (areas 8 and 9) and to a lesser degree in agricultural sciences and veterinary (7) do more collaborative research, research to order and consulting. The coefficients of the dummies re-lated to the prevailing scientific area of the department, not reported in the results tables for reasons of space, are available upon request.
T
ab
. 7
.
Dynamic probit: Whole population of departments and Scientific Ar
eas
Dep.
var
=
f_acadeng_s
All Scientific Areas
Hard Sciences Social Sciences Coef. Marg. Effects Coef. Marg. Effects Coef. Marg. Effects (1) (2) (3) (4) (5) (6) f_acadeng_s( –1) 0.7112 0.1713 1.0838 0.1890 1.3413 0.4976 (0.0695)*** (0.0233)*** (0.1048)*** (0.0407)*** (0.1049)*** (0.0334)***
Source of funding f_eu(
–1) 0.0004 8.51E-05 0.0003 2.97E-05 0.0006 2.39E-04 (0.0002)** (4.01E-05)** (0.0001)* (1.76E-05)* (0.0004) (1.52E-0.4)* f_eu( –2) 0.0001 2.78E-05 0.0001 9.17E-06 0.0002 8.62E-05 (0.0002) (4.21E-05) (0.0002) (1.99E-05) (0.0004) (1.60E-0.4) f_miur( –1) 0.0004 7.48E-05 0.0004 3.71E-0.5 0.0006 2.26E-04 (0.0002)* (5.03E-05)* (0.0002)* (2.12E-05)* (0.0005) (2.11E-0.4) f_miur( –-2) 0.0002 4.14E-05 0.0002 2.14E-05 0.0003 1.09E-04 (0.0002) (4.35E-05) (0.0001) (1.89E-05) (0.0005) (1.86E-0.4) f_uni( –1) –0.0003 –6.24E-05 –0.0004 –3.83E-05 0.0002 9.03E-05 (0.0003) (5.14E-05) (0.0003) (3.11E-05)* (0.0004) (1.8E-0.4) f_uni( –2) 0.0005 1.09E-04 0.0006 6.11E-05 0.0003 1.19E-04 (0.0003)* (6.22E-05)* (0.0003)* (3.45E-05)* (0.0004) (1.78E-0.4) f_altre_amn( –1) 0.0004 7.70E-05 0.0002 2.01E-05 0.0015 0.0006 (0.0002)** (3.16E-05)** (0.0002) (2.34E-05) (0.0004)*** (0.0002)**
Characteristics of the department p_tot(
–1) 0.0052 0.0011 0.0052 0.0005 0.0037 0.0015 (0.0009)*** (0.0002)*** (0.0011)*** (0.0001)*** (0.0013)*** (0.0005)*** share_res( –1) 0.5561 0.1133 0.2678 0.0256 0.2178 0.0869 (0.4299) (0.0873) (0.4632) (0.0440) (0.6724) (0.2682) share_phd( –1) –0.1137 -0.0232 –0.1661 –0.0159 0.1284 0.0512 (0.1851) (0.0377) (0.2334) (0.0222) (0.2125) (0.0847) rating_dep 0.3433 0.0699 0.3504 0.0335 0.3185 0.1270 (0.4416) (0.0900) (0.5539) (0.0528) (0.4679) (0.1866)
T ab . 7 . (follows) Dep. var = f_acadeng_s
All Scientific Areas
Hard Sciences Social Sciences Coef. Marg. Effects Coef. Marg. Effects Coef. Marg. Effects (1) (2) (3) (4) (5) (6)
Characteristics of the university dim_un1
0.0761 0.0149 0.0530 0.0049 -0.1406 -0.0558 (0.1646) (0.0310) (0.1821) (0.0161) (0.2039) (0.0804) dim_un2 –0.2893 –0.0670 –0.2786 –0.0324 –0.3434 –0.1348 (0.1248)** (0.0325)** (0.1525)* (0.0201) (0.1419)** (0.0541)** dim_un3 0.1681 0.0339 0.0648 0.0061 0.1167 0.0465 (0.0808)** (0.0161)** (0.0962) (0.0091) (0.0895) (0.0356) ilo –0.0679 –0.0135 –0.1260 –0.0112 0.0393 0.0157 (0.0966) (0.0186) (0.1176) (0.0096) (0.1064) (0.0424) ilo_age 0.0134 0.0027 0.0148 0.0014 0.0018 0.0007 (0.0117) (0.0024) (0.0139) (0.0013) (0.0133) (0.0053) polytechnic 0.3437 0.0578 0.1501 0.0128 0.5769 0.2196 (0.2450) (0.0329)* (0.2335) (0.0178) (0.6077) (0.2086)
Geographic characteristics epo_prov
–0.0022 –0.0004 –0.0080 –0.0008 –0.0009 –0.0003 (0.0034) (0.0007) (0.0045)* (0.0004)* (0.0035) (0.0014) avdim_manuf 0.0062 0.0013 0.0351 0.0033 0.0117 0.0047 (0.0256) (0.0052) (0.0301) (0.0029) (0.0294) (0.0117) Log-likelihood –2 ,682.75 – –1 ,430.73 – –1 ,336.83 – Y ear dummy yes – yes – yes – Scientific areas dummy yes – yes – yes – Geographic areas dummy yes – yes – yes – N. observations 8, 202 – 5, 202 – 3, 000 – N. departments 1, 882 – 1, 203 – 679 – Note :
***,**,* significant at 1%, 5% and 10% respectively
. Standard errors in parentheses. (
–1) and (
–2) refer to a 1 or two years lags of the considered varia
-ble. Due to limits of space, the coefficient of the intercept is not presented in the T
443 relationships with the productive sectors (Muscio, 2010). Our results show that ILO age, (ilo_age), measured as number of years in business, exerts a positive influence on the level of academic engagement. This result is statisti-cally significant for those departments focused on the hard sciences. How-ever, our estimates show that the presence of an industry liaison officer does not have a significant effect on the probability to cooperate with the non-academic domain (intensive margin). The results reported in Table 7 show that the estimated coefficient, although maintaining a positive sign, is not sta-tistically significant.
In line with previous studies (Bruno - Orsenigo, 2003; Pavitt, 2001; Hicks et al., 2000), the tobit analysis shows that the quality of the depart-ment’s scientific research has a positive impact on its ability to attract fund-ing from consultancy and research to order activities. The quality indicator used (rating_dep), which takes account of both scientific publications and activities related to research commercialization (e.g. number of patents), cap-tures both the impact of high-quality research for boosting relations with ex-ternal entities, and the signalling effect related to the intrinsic quality of the department/university22.
Our results for the impact of department size on private funding are in line also with those obtained by Bruno - Orsenigo (2003). The number of both administrative staff and researchers, p_tot (–1), has a positive effect on both the amount of external funding and the probability of accessing these funds. For a given level of staff, the ability to access external fund-ing increases with the share of staff engaged in research (share_res(–1)). In other words, at the departmental level there is clear evidence of increasing returns to scale, presumably due to the fact that the greater specialization of the research team, made possible by the larger size, generates product specific economies of scale. It is interesting also to note that a scale ef-fect is identifiable even at the university level, to the extent that «average» universities (dim_un2, i.e. with 10,000-15,000 enrolled students) are asso-ciated with a lower probability of accessing funding from non-academic entities.
Finally, a high proportion of Ph.D students among researchers has a neg-ative impact on the collection of external funding (share_phd), although the effect on the intensive margin (the probability of access to external funding) is not statistically significant. This result reflects both the role of experience in establishing relationships with external entities and the fact that the time spent on supervision and training of doctoral students may detract from re-search (Jensen et al., 2010)23.
22 The number of PRIN projects that received a positive assessment from MIUR are
used to proxy for department quality: the results are qualitatively similar to those presented in Tables 5-7.
23 Note that the characteristics of the staff employed in the department (share of
444
Finally, the structure and characteristics of the local economy (which obviously depend on the localization of the department), have a significant impact on access to private funding by departments. These characteristics capture the external demand for knowledge transfer. The results of both the tobit and the probit models show that a low level of industrialization and lack of infrastructure in the territory, as is in the case of Southern It-aly, have a negative impact on the ability of departments to establish re-search collaborations with the non-academic domain24. The indicator for
local demand for research services (epo_prov) has a positive impact on funding from academic engagement. These results are in line with those from other empirical studies (Chapple et al., 2005; Friedman - Silberman, 2003; Mansfield, 1995).
4. Concluding remarks
The results of the empirical analysis allow some general concluding re-marks. First, the existence of a complementarity between public and external funding (from research collaborations, research to order and consultancies) and universities’ research activities implies that the promotion of academic engagement, a crucial channel for the transfer of knowledge to the non-aca-demic domain, is not compatible with a reduction in public funding.
Consistent with the theoretical background presented, the important de-terminants of the ability to raise external funding are department size and number of research staff (which suggests that there are increasing returns to scale presumably related to the degree of specialization of the research teams). Also, in the case of departments engaged in research in the hard sciences, the quality of scientific production (combined with the fact that higher amounts of public and especially competitive funding, act to signal the quality of the department), being located in an area with significant de-mand for R&D, and higher per capita income (i.e. areas with higher absorp-tive capacity) also matter for sourcing external funding.
The fact that these findings are clearer for hard sciences departments compared to those specialized in the social sciences has two possible ex-planations. On the one hand, given that hard science research is typically more capital intensive (because of the need for equipment and machinery), public funding is essential for setting up the necessary research facilities. On the other hand, it is important to recall that, in social sciences, aca-demics commonly conduct their own research activities, thus, circumvent-ing the redistribution of the department’s share of revenue. This means
the revenues from academic engagement, but not the extensive margin, i.e. the probability of accessing these funding channels (Table 6).
24 For reasons of space, the coefficients of the dummies for the macro-regions are not
445 that the level of academic engagement in social science fields is higher than it might appear from the official data. In the case of the hard sciences, a share of the revenues or profits obtained by researchers from consulting, collaborative research, and research to order, is given to the department or the university. This is even more common in the case of research projects that rely on use of university equipment and facilities. Thus, the lower level of collaborations in social science can be partially explained by the effect of (university or department) governance of academic engagement on re-searchers’ incentives.
Finally, the combination of scale economies and the empirically detected persistence over time of external funding, suggests a scenario where cuts in the public funding of university research would, in all probability, give rise to a bigger gap between departments able to attract private resources and those that find it difficult to do so, with inevitable consequences for the fi-nancial sustainability of the latter. This is because research quality is a posi-tive determinant of academic engagement, especially for hard science depart-ments and those actively committed to collaboration with external entities; there appears to be a structural trend towards divergence between depart-ments in terms of research quality. In this context, a clear result of the Qual-ity Evaluation Research (VQR) for the period 2004-2010 is that, especially in relation to the analysis at the level of individual scientific areas, there is re-markable heterogeneity in the research performance of the departments eval-uated. These differences can be quite large even at the level of disciplines belonging to the same scientific area.
To conclude, the reduction in public funding for university research is not only not consistent with the aim of encouraging academics to intensify their cooperation with industry, but also threatens universities that, because of their localization or size, are not able to engage in research with a com-mercial value.
In more general terms, the fact that the degree of collaboration between universities and other institutions or companies in Italy is less developed than in other industrialized countries, which was indicated by the VQR 2004-2010 when analysing the share of publications carried out in collabo-ration with non-academic researchers, is an open issue. Although this is ex-plained in part by the peculiarities of the Italian industrial base, which con-sists mostly of micro, small and medium-sized firms (structurally less prone to external collaborations), it should be recognized also that the issue of not fully developed collaborations between universities and industry (in particu-lar research to order and consulting activities) has historically lacked atten-tion from policy and also the universities.
From this perspective, our results call for the adoption of specific policy measures aimed at facilitating the establishment of channels through which efficient transfer of knowledge is enabled. At the national level, a suitable system of incentives for universities could be designed, for example, when regulating the allocation mechanism of public funds for research, which
446
explicitly includes this dimension. Such an incentive mechanism could be based on the number and frequency of collaborations rather than the rev-enues they produce, because the ability to transfer knowledge matters more than the maximization of the related revenues.
At the local level, as mentioned above, more attention should be de-voted to the governance of external partnerships and to the monetary and rational incentives schemes embedded in universities’ regulation of aca-demic engagement activities. Bureaucratic procedures should be less cum-bersome and, above all, regulation of academic engagement that include withholdings on revenues that are not aimed at covering overhead costs should be avoided. Typically, this revenue is used to finance activities unre-lated to research (in some cases they are even distributed to administrative staff as an incentive).
A ppendix T ab . A1 . Corr
elation among the main funding sources (values per r
esearcher)
Academic engagement European Union (EU)
Other Public Instit. MIUR University Non profit Italian Firms Public Research Inst. Other Academic engagement 1
European Union (EU)
0.1706*
1
Other Public Instit.
0.1305* 0.0911* 1 MIUR 0.1645* 0.1963* 0.1018* 1 University 0.0932* 0.0770* 0.0838* 0.1547* 1 Non profit 0.1159* 0.1091* 0.1526* 0.1087* 0.1376* 1 Italian Firms 0.0957* 0.0750* 0.0906* 0.1411* 0.0810* 0.1227* 1
Public Research Inst.
0.1564* 0.0876* 0.0888* 0.1405* 0.0538* 0.0556* 0.0456* 1 Other 0.1325* 0.0041 0.0544* 0.0767* 0.0054 –0.0064 0.0024 –0.0104 1 Note : * significant at 5% or over .
448
References
Abramo G. - D’angelo C.A. - Caprasecca A. (2009), Allocative Efficiency in Public Research Funding: Can Bibliometrics Help?, Research Policy, vol. 38, pp. 206-215.
Aghion P. - Howitt P. (1992), A Model of Growth through Creative Destruction,
Econometrica, vol. 60, pp. 323-351.
— (2005), Growth with Quality-improving Innovations: An Integrated Framework, in Aghion P. - Durlauf S. (eds.), Handbook of Economic Growth, vol. 1A, Am-sterdam, Elsevier, pp. 67-110.
Alpaslan A. (2009), The Wooldridge Method for the Initial Values Problem Is Sim-ple: What About Performance?, IZA Discussion Papers 3943, Institute for the Study of Labor (IZA), mimeo.
Arora A. - Gambardella A. (1994), The Changing Technology of Technological Change: General and Abstract Knowledge and the Division of Innovative La-bour, Research Policy, vol. 23, pp. 523-532.
Arrow K.J. (1962), Economic Welfare and the Allocation of Resources to Invention, in Nelson, R. (a cura di), The Rate and Direction of Inventive Activity, Princeton University Press.
Beath J. - Owen R.F. - Poyago-Theotoky J. (2003), Optimal Incentives for Income-generation in Universities: The Rule of Thumb for the Compton Tax,
Interna-tional Journal of Industrial Organization, no. 21, pp. 1301-1322.
Bercovitz J.E.L. - Feldman M. (2011), The Mechanisms of Collaboration in Inven-tive Teams: Composition, Social Networks, and Geography, Research Policy, no. 40, pp. 81-93.
Blume-Kohout M.E. - Kumar K. - Sood N. (2009), Federal Life Sciences Funding and
University R&D, NBER Working Paper Series no. 15146.
Blumenthal D. - Campbell E. - Anderson M. - Causino N. - Seashore-Louis K. (1997), Withholding Research Results in Academic Life Science: Evidence from a National Survey of Faculty, Journal of the Academic Medical Association, no. 207, pp. 1224-1228.
Bruno G.S.F. - Orsenigo L. (2003), Variables Influencing Industrial Iunding of Aca-demic Research in Italy: An Empirical Analysis, International Journal of
Technol-ogy Management», vol. 26, nos. 2-3-4, pp. 277-302.
Chapple W. - Lockett A., Siegel D. - Wright M. (2005), Assessing the Relative Per-formance of UK University Technology Transfer Offices: Parametric and Non-parametric Evidence, Research Policy, no. 34, pp. 369-384.
Connolly L.S. (1997), Does External Funding of Academic Research Crowd Out In-stitutional Support?, Journal of Public Economics, vol. 64, no. 3, pp. 389-406. David P.A. - Hall B.H. (2000), Heart of Darkness: Modeling Public-private Funding
Interactions inside the R&D black box, Research Policy, vol. 29, no. 9, pp. 1165-1183.
David P.A. - Hall B.H. - Toole A.A. (2000), Is public R&D a complement or substi-tute for Private R&D? A Review of the Econometric Evidence, Research Policy, vol. 29, nos. 4-5, pp. 497-529.
Elzinga A. (1985), Research, Bureaucracy and the Drift of Epistemic Criteria, in Wittrock, B., Elzinga A. (eds.), The University Research System, Stockholm, Almqvist & Wiksell.
Etzkowitz H. (1998), The Norms of Entrepreneurial Science: Cognitive Effects of the New University-industry Linkages, Research Policy, no. 27, pp. 823-833.
449 — (2003), Research Groups As «Quasi-firms»: The Invention of the
Entrepreneuri-al Eniversity, Research Policy, no. 32, pp. 109-121.
Etzkowitz H. - Leydesdorff L. (2000), The Dynamics of Innovation: From National Systems and «Mode 2» to a Triple Helix of University-industry-government Re-lations, Research Policy, no. 29, pp. 109-123.
Florida R. - Cohen W. (1999), Engine or Infrastructure? The University’s Role on Economic Development, in Branscomb L., Kodama F. - Florida R. (eds.),
Indus-trializing Knowledge, MIT Press.
Friedman J. - Silberman J. (2003), University Technology Transfer: Do Incentives, Management, and Location Matter?, Journal of Technology Transfer, no. 28, pp. 17-30.
Gulbrandsen M. - Smeby J.C. (2005), Industry Funding and Research Performance,
Research Policy, vol. 34, no. 6, pp. 932-950.
Hicks D. - Breizman A. - Hamilton K. - Narin F. (2000), Research Excellence and Patented Innovation, Science and Public Policy, no. 27, pp. 310-320.
Honorè B. (1993), Efficiency Considerations in Tobit Models with Fixed Effects, in Bunzel H. - Jensen P. - Westergård-Nielsen N. (eds.), Panel Data and Labour
Market Dynamics, Amsterdam, Elsevier Science Publishers.
Inglesi-Lotz R. - Pouris A. (2012), The Influence of Scientific Research Output of Academics on Economic Growth in South Africa: An Autoregressive Distributed Lag (ARDL) Application, Scientometrics, published online, 21 July 2012.
Jensen R. - Thursby J. - Thursby M.C. (2010), University-Industry Spillovers,
Govern-ment Funding, and Industrial Consulting, in NBER Working Paper, no. 15732.
Jones C.I. (2005), Growth and Ideas, in Aghion P. - Durlauf S. (eds.), Handbook of
Economic Growth, vol. 1B, Amsterdam, Elsevier, pp. 1063-1111.
Kira F.R. (2009), Absorptive Capacity and the Search for Innovation, Research
Poli-cy, vol. 38, no. 2, pp. 255-267.
Laredo P. (2007), Revisiting the Third Mission of Universities: Toward a Renewed Categorization of University Activities?, Higher Education Policy, vol. 20, no. 4, pp. 441-456.
Maggioni M.A. - Uberti T.E. (2008), Knowledge Networks Across Europe: Which Distance Matters?, The Annals of Regional Science, no. 43, pp. 691-720.
Mansfield E. (1995), Academic Research Underlying Industrial Innovation: Sources Characteristics and Financing, Review of Economics and Statistics, no. 77, pp. 55-65. Merton R.K. (1968), The Matthew Effect in Science, Science, no. 159, pp. 56-63. Mitchell J.E. - Rebne D.S. (1995), The Nonlinear Effects of Teaching and
Consult-ing on Academic Research Productivity, Socio-Economic PlannConsult-ing Sciences, vol. 29, no. 1, pp. 47-57.
Mueller P. (2006), Exploring the Knowledge Filter: How Entrepreneurship and Uni-versity-Industry Relationships Drive Economic Growth, Research Policy, vol. 35, no. 10, pp. 1499-1508.
Muscio A. (2008), Il trasferimento tecnologico in Italia: risultati di un’indagine sui dipartimenti universitari, L’Industria, Numero speciale, pp. 245-268.
Muscio A. - Orsenigo L. (2010), Politiche nazionali e regionali di diffusione della conoscenza, in Bianchi P. e Pozzi C. (a cura di), Le politiche industriali alla prova
del futuro – analisi per una strategia nazionale, Bologna, Il Mulino.
Muscio A. - Quaglione D. - Vallanti G. (2013), Does Government Funding Comple-ment or Substitute Private Research Funding to Universities?, Research Policy, no. 42, pp. 63-75.
450
Pavitt K. (2001), Public Policies to Support Basic Research: What Can the Rest of the World Learn from US Theory and Practice? (and What They Should Not Learn), Industrial and Corporate Change, vol. 10, no. 3, pp. 761-780.
Perkmann M. - Walsh K. (2008), Engaging the Scholar: Three Types of Academic Consulting and Their Impact on Universities and Industry, Research Policy, vol. 37, no. 10, pp. 1884-1891.
— (2009), The Two Faces of Collaboration: Impacts of University-industry Rela-tions on Public Research, Industrial and Corporate Change, vol. 18, no. 6, pp. 1033-1065.
Perkmann M. - Tartari V. - McKelvey M. - Autio E. - Broström A. - D’Este P. - Fini R. - Geuna G. - Grimaldi R. - Hughes A. - Krabel S. - Kitson M. - Llerena P. - Lissoni F. - Salter A. - Sobrero M. (2013), Academic Engagement and Commer-cialisation: A Review of the Literature on University-industry Relations, Research
Policy, no. 42, pp. 423-442.
Peters B. (2009), Persistence of Innovation: Stylised Facts and Panel Data Evidence,
The Journal of Technology Transfer,
Pivetta F. - Reis R. (2007), The Persistence of Inflation in the United States, Journal
of Economic Dynamics and Control, vol. 31, no. 4, pp. 1326-1358.
Powell W.W. - Koput K.W. - Smith-Doerr L. (1996), Interorganizational Collabora-tion and the Locus of InnovaCollabora-tion: Networks of Learning in Biotechnology,
Ad-ministrative Science Quarterly, vol. 41, no. 1, pp. 116-145.
Romer P. (1986), Increasing Returns and Long-run Growth, Journal of Political
Economy, no. 94, pp. 1002-1037.
— (1990), Endogenous Technological Change, Journal of Political Economy, no. 98, pp. S71-S102.
Salter A.J. - Martin B.R. (2001), The Economic Benefits of Publicly Funded Basic Research: A Critical Review, Research Policy, no. 30, pp. 509-532.
Thursby J. - Thursby M.C. (2011), Faculty Participation in Licensing: Implications for Research, Research Policy, vol. 40, no. 1, pp. 20-29.
Wooldridge J.M. (2005), Simple Solutions to the Initial Conditions Problem in Dy-namic, Nonlinear Panel Data Models with Unobserved Heterogeneity, Journal of
Applied Econometrics, vol. 20, no. 1, pp. 39-54.
Triguero Á. - Córcoles D. (2013), Understanding Innovation: An Analysis of Persistence for Spanish Manufacturing Firms, Research Policy, vol. 42, no. 2, pp. 340-352.
Summary: The Effects of Public Research Funding on Academic Engagement (J.E.L. L24, L31, O32,
O33)
This paper provides an empirical investigation of the effects of public funding of academic research on external funding obtained via research contracts, consultancies and «research to order» activities more generally. These informal collaborations between university departments and business are relevant because of their high relational content and consequent spillover effects based on learning by interacting.
This study uses data on the population of university departments and research institutes in Italy en-gaged in research in one of the 14 scientific areas identified by the Italian National Research Council. The results of our analysis show that the availability of external funding has a positive impact on the probabil-ity of accessing further external funding and on its amount. We also find some complementarprobabil-ity between the amount of public funding, from both the European Union and the Italian Ministry of Education, Uni-versity and Research and the capability of uniUni-versity departments to collect funding via research contracts and consultancies.