Universit`a degli Studi di Pisa
Dipartimento di Informatica
Dottorato di Ricerca in Informatica
Ph.D. Thesis
Models and algorithms for Conflict
Analysis and Prevention
Claudia Sodini
Supervisor (Giorgio Gallo)
Contents
Introduction 9
1 An introduction to Conflict Analysis 21
1.1 Introduction . . . 21
1.2 Risk Assessment . . . 22
1.3 Early Warning . . . 25
1.4 Quantitative and qualitative methods . . . 27
1.4.1 FAST . . . 28
1.4.2 CIFP . . . 31
1.4.3 FEWER . . . 32
2 Causal Models 35 2.1 The dynamics of conflicts through analytical models . . . 35
2.1.1 Computer simulation and system dynamics . . . 37
2.1.2 Quantitative vs Qualitative analysis in system dynamics . . . 38
2.1.3 Modelling process . . . 39
2.2 Lateral Pressure model . . . 40
2.2.2 Instability: an example . . . 46
2.2.3 Lateral Pressure-Internal Tension . . . 49
2.2.4 Internal and external world . . . 49
2.2.5 Regime type and Gini coefficient . . . 51
2.3 Modelling state stability . . . 52
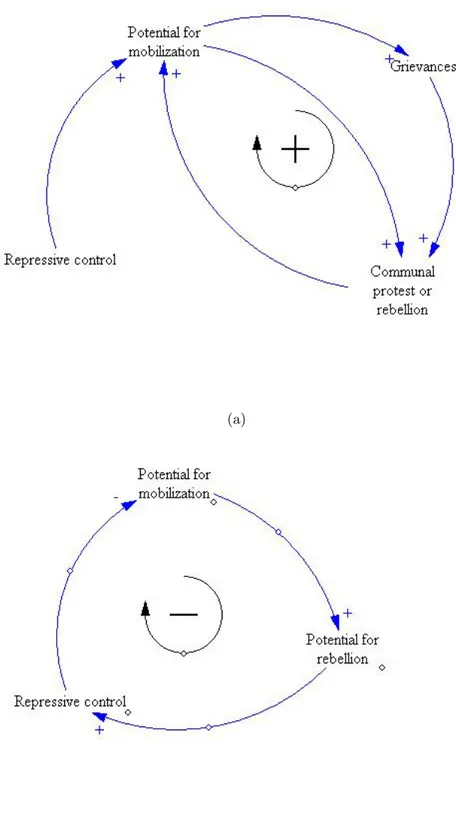
2.4 Gurr’s model . . . 57
2.5 Ethnic Terrorism Model . . . 63
2.6 Conclusion . . . 68
3 Conflict phases through Hidden Markov chains and Cluster analysis 71 3.1 The conflict cycle . . . 71
3.2 Sequence analysis: forecasting using Hidden Markov Models . . . 75
3.3 Interval-level time series: Cluster analysis . . . 79
4 Conflict phases through Multicriteria 85 4.1 Introduction . . . 85
4.2 Data . . . 88
4.3 ELECTRE method . . . 91
4.4 The Multicriteria-clustering algorithm (MCC-algorithm) . . . 97
4.4.1 The algorithm . . . 99
4.4.2 The Voting procedure . . . 100
4.4.3 An example . . . 100
4.4.4 Dynamical aspects . . . 104
4.4.5 Smoothing over time . . . 105
4.4.6 Dynamic behavior of the data . . . 108
0.0. CONTENTS 5
4.4.8 Comparison with Schrodt LML-Algorithm . . . 111
4.5 Conclusions . . . 113
5 Risk Assessment 117 5.1 Introduction . . . 117
5.2 State Failure Project . . . 122
5.3 Risk Assessment trough Learning Systems . . . 130
5.3.1 Neural Networks . . . 130
5.3.2 Decision trees, Rule Learning . . . 141
6 Risk Assessment through Logic Function 151 6.1 Introduction . . . 151
6.2 Logic Data and Logic Separation . . . 152
6.3 The Lsquare system . . . 154
6.4 Conflict analysis via logic functions . . . 157
6.4.1 MID analysis with Lsquare: transformation and use of the data 157 6.5 Results . . . 160
6.6 Conclusions . . . 163
Conclusion 167 A Logic Data 171 A.1 Preliminary Definitions . . . 171
B Event Data 173
C WEIS Structure and IDEA scale 177
Abstract
The research on methods for conflict resolution and prevention has improved dras-tically in the last years. In particular computer-aided methods have acquired more importance because they allow for larger databases with more variables, complex statistical analysis, deeper insights etc... This thesis intends to give a description of those methods and projects that I consider most interesting and/or representative in the field, with the goal of pointing out some questions and problems which need still to be answered. Moreover two new methods, never used before for conflict situation, are also presented: Multicriteria-Clustering and Logic Functions.
Introduction
In the last years the research on methods for conflict resolution and prevention has improved drastically. In particular computer-aided methods have acquired more importance because they allow for larger databases with more variables, complex statistical analysis, deeper insights etc... When the initial skepticism on the use of automated systems in the conflict field partially dissolved (mainly due to political science analysts), it begun the debate on what the best method would be (qualitative or quantitative, and within quantitative what kind of methods). This debate is still alive but analysts have recently acknowledged that the best solution most likely de-rives from a combination of methods. Even if great progresses have been made in the field, the incredible number of different approaches that use different conflict theories and work with different and not always comparable data, have brought often to the construction of fragile models with poor forecasting performance or with no political relevance. In fact, both internal and external conflicts (over country boundaries) are characterized by complex phenomena whose interactions are often non linear and non monotonic: the problem of finding causal and predictive stable relations between variables and concrete predictions is thus hard even when using reliable methods. It is thus crucial to know which are the results and the methods used by other researchers in order not to make useless work. In fact, being the field of conflict
analysis relatively a new one and given that the world situation is changing rapidly over time, there is the risk that a research project become old in a brief amount of time. In the literature, there are previous example of systematic analysis that help researchers in understanding current developments and results: for instance, the book of Trappl et al. (2006) is a collection of recent articles by scientists from all over the world that study specifically the application of computer-aided methods for international conflict resolution and prevention, Schrodt (2004)’s survey is instead the result of more than a decade of research in the field of computational modeling of international politics and presents “..a set of formal approaches for studying the regularities of international political behavior. It is theoretically based in studies of human cognition and organizational information processing; it is methodologically based in computational modeling”.
This thesis would like to be a systematic study of the methods present in the litera-ture. It doesn’t pretend to be a survey of all the projects and methods that can be found in the literature, but instead it intends to give a description of those I consider most interesting and/or representative, with the goal of pointing out some questions and problems which need still to be answered. Moreover two new methods, never used before for conflict situation, are also present. As I will show in the following, my work has been limited from the datasets available for tuning and testing them and thus, even if they present interesting results, they still need further work and testing.
0.0. CONTENTS 11
Chapter 1: An introduction to Conflict Analysis
The nature of conflict is changed drastically from the past, especially since the Cold War. In this chapter an introduction to the new types of conflict the world is facing is presented. Security related problems have given rise to new branches of research: scientists have begun to focus on the possibility of making reliable predictions in order to avoid the explosion of violent conflicts. In this chapter an initial description of the lines of research called risk assessment and early warning are given. The alternatives quantitative vs qualitative, and structural vs dynamical methods are discussed. Some important international projects on risk assessment and early warning are described (FAST, CIFP, FEWER).
FAST improves the ability of decision makers to identify critical developments so that political strategies can be formulated for preventing or limiting the effects of violent conflicts. It combines annual reports deriving from field investigation, weekly event data analysis, daily qualitative analysis, constant monitoring and external expertise. CIFP identifies and assemble statistical information underlying the key-feature of the political, economic, social and cultural environment of countries in the world. Both FAST and CISP are partners of FEWER, a global coalition of non-governmental and governmental agencies and academic institutions working to promote co-ordinated responses to violent conflict.
Chapter 2: Causal Models
One of the needs of the research community is the study of models that allow to thoroughly understand the causal relations among the different variables that char-acterize the situations of potential conflict: these models are called Causal Models.
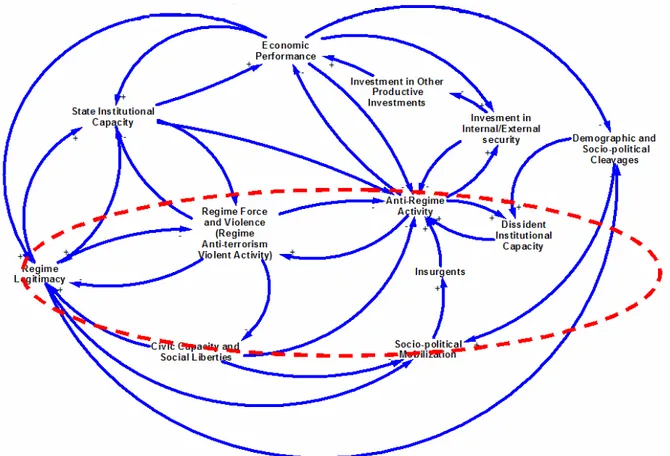
Computer simulation, one of the most widely used Operations Research (OR) tech-niques, could be an important instrument for the analysis of a complex dynamic system such as the conflict, both for a quantitative and a qualitative analysis of the situation. In this chapter I will describe four existing models based on computer simulation. The first model is due to Wils et al. (1998). Starting from a theory developed by Choucri and North (1975), the authors present a system dynamics1 model which relates the conflict to factors affecting the possibility of sustainable development such as population growth, resources and technology. Considering the type of variable used, which change rather slowly over time, this model can highlight situations of possible instability, but can hardly be used to anticipate the outbreak of a violent conflict. It can be used to analyze both, inter-state and infra-state con-flicts. Secondly I will describe a model developed by MIT researchers that study the dynamics of the possible causes of the instability of a state, in particular those related to anti-regime communications. The state is seen as having a capacity for limiting the loads generated by anti-regime activities. If some particular conditions (including several threats to the state) occur, then small changes can bring to the collapse of the system. The aim is to find these particular conditions (to be used for instance to test social theories) and to try to make some predictions of when critical points can occur. The third model is due to Gurr (1994) and focusses on infra-state conflicts, namely on conflicts involving minority groups within a state. Although this does not appear to be the original intention of Gurr, it is interesting to note that his model maps in an almost one-to-one way into a system dynamics model, and in fact, after presenting my qualitative attempt of traducing Gurr’s theory in system dynamics, I will also compare it to a fourth model, the Ethnic Terrorism
0.0. CONTENTS 13
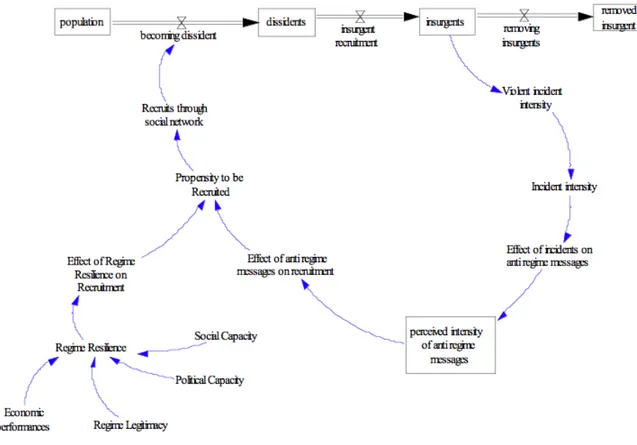
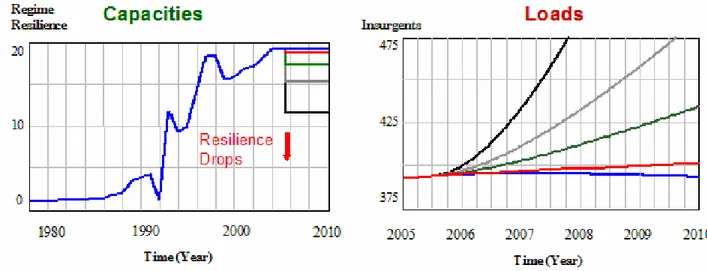
Model (ETM) of Akcam and Asal (2005), that considers the theoretical aspects of ethnonationalist terrorism (a part of Gurr’s project) for understanding, through sys-tem dynamics, how the variables defining the conflict change over time. Finally a discussion on the capability of these models to be used for political purposes is per-formed and on the possibility of using computer simulation techniques together with other methods.
Chapter 3: Conflict phases through Hidden Markov chains and Cluster analysis
In the case that a conflict is already going on, it is also fundamental to know which is the current Conflict Phase. According to several study on conflict theory, a conflict can in fact be seen as a sequence of phases that form a cycle, and knowing the char-acterization of these cycles one may try to make predictions on the ongoing conflicts. Different authors name and describe these phases differently. One example, shown in figure 1, is the following2: No conflict, Latent conflict : the potential of conflict exists whenever different needs, values and interests are present. Emergence: a triggering event can lead to the emergence (or beginning) of a conflict. Escalation: the emer-gence can be followed by a settlement or a resolution, but also by an escalation of the conflict. (Hurting) Stalemate: the escalation may lead to a stalemate, a situation in which neither side can win. De-Escalation/Negotiation: an “hurting stalemate”, where both the parties are in pain continuing the conflict, can be an opportunity for negotiation and a potential settlement. Settlement/Resolution. Post-Conflict Peace-building and Reconciliation: if and when an agreement is reached, peacePeace-building
2http://www.caii.com/CAIIStaff/Dashboard GIROAdminCAIIStaff/
Figure 1: Phases of a conflict
efforts are needed for reconciling former opponents. Another example is given by Alker, Gurr, and Rupesinghe (Alker et al. (2001)) that instead distinguish between six phases: dispute (equivalent to conflict emergence); crisis (equivalent to escala-tion); limited violence; massive violence; abatement (equivalent to de-escalaescala-tion); settlement. These phases are similar to those set out by the Complex Emergency Response and Transition Initiative (CERTI) project3: conflict; crisis; chaos; complex emergency; recovery. The Health as a Bridge for Peace (HBP) project4 defines five phases: impending crisis, outbreak of violence, war, post-crisis, stable peace.
All of these models are idealized, but they might be useful. In fact most conflicts pass through similar phases at least once in their history, so they can be used “..to develop an early warning capability that provides reliable estimates of conflict potential; gen-erates “warnings” months in advance of serious escalation; and enables analysts to differentiate among different types of conflict”(Schmalberger and Alker, 2001). After a deeper description of this kind of qualitative analyses of the conflict cycle, two ex-isting approaches for a quantitative analysis of the conflict phases are also presented
3http://www.certi.org/
0.0. CONTENTS 15
and discussed. The first one, which has been proposed by Schrodt (2000a), is based on the theory of Markov chains, or what is called Hidden Markov Models (HMM). In these models, the states of the chain (that correspond to the diverse conflict phases) are not directly observed; they are rather inferred from the presence or absence of a given sequence of symbols. HMM is often used in speech recognition, compari-son of protein sequences, in modeling the control of cellular phone networks ecc..., all cases in which the sequences to be compared are noisy, that is, contain missing, erroneous and extraneous elements: for this reason it seems to be appropriate for a complex field like the conflict one. The second, proposed by Schrodt and Gerner (1996), is quite different and is based on a single criteria clustering technique. The algorithm proposed uses the correlation between dyadic behaviors at two points in time to identify clusters of political activity. The basic assumption in this study is that within each conflict phase there is a relative stability of the interactions among the different actors, while sudden changes happens in the transition from one phase to the next. The transition to a new cluster occurs when a point is much closer in distance to subsequent points than to preceding points. The objective of their study is to detect those critical patterns of event flows which characterized the transitions from one phase to another and that can be used as an early warning indicator.
Chapter 4: Conflict phases through Multicriteria
Along with the debate between quantitative and qualitative methods, another one between structural and dynamic data have to be taken into account. It is true that in order to make predictions event data are usually considered more suited for early warning purposes since they make possible the monitoring of the evolution of the situation in the field almost day by day, but, for a correct interpretation of them,
structural variables describing the context of the countries under study should also be used. This is one of the reasons for which I claim that Multicriteria techniques(MC), “..one of the most well known branches of decision making..”(Triantaphyllou, 2000), may find fruitful applications in the conflict analysis. In fact, Multicriteria methods can deal simultaneously with a large number of alternatives, a large number of criteria (often conflicting) and a wide range of data (qualitative, quantitative, fuzzy, linguistic parameters), combining assessment methods with judgment methods. According to my best knowledge, no prior application of MC in the conflict analysis exists. In this chapter a brief introduction to Multicriteria techniques is given. I show that Multicriteria clustering algorithms are more appropriate and promising in conflict analysis than the single criterion ones so far used. This is done by the use of an algorithm due to Smet and Guzm´an (2004), who applied it in the field of financial risk assessment. The algorithm is based on one of the most known algorithm among clustering methods: the k-means algorithm (MacQueen (1967)). The distance which helps classifying alternatives in the correct cluster has the characteristic of being written in multicriteria terms. In the chapter, the algorithm, as originally proposed by Smet and Guzm´an (2004), is described. Given some alternatives evaluated on some criteria, the aim is to put them in the correct cluster. One of the advantage of this method is that it has the premises for being used both for early warning purposes and for risk assessment. The alternatives in the two cases are in fact:
a point in time describing the situation of a particular country, where the criteria consist mainly in event data collected daily or weekly or monthly (but also in structural information), the clusters represent the conflict phases of a conflict and the analysis is restricted to one country in a limited amount of time with the aim of giving insights in the short term;
0.0. CONTENTS 17
a country as being described mainly by structural data (but also by event data), where the criteria are the ones that are deemed relevant with respect to the risk level evaluation: literacy index, income per capita etc.., the clusters represent the level of risk in which a country can be classified, the analysis is about a list of countries with the aim of giving insights in the long term on their level of risk.
Some considerations on the dynamic aspects of the data have also been added, es-pecially for the first case: here the temporal nature of the data assume great im-portance, it is in fact crucial to know for instance if two violent actions happen in a country in a time span of a week or 2 years apart one from the other, while in the original algorithm each observation in time is considered in itself as a point in a multidimensional space, without reference in time scale. This fact, that may lead to a misinterpretation of the data, is addressed through smoothing techniques. The application of the MCC-algorithm on real data from the Nepal internal conflict is discussed and some final remarks and future research lines are presented.
Chapter 5: Risk Assessment
It is also of interest to understand whether the country under analysis is a country at risk or not, and if it is at risk, which kind of risk (low, serious, state failure...). In this chapter I will address some approaches related to this problem, that I will call of Risk Assessment. Risk Assessments models have different objectives from Conflict phases models because the data used, event data for the latter and structural data for the former, differentiate the capability of making predictions: in Risk Assessment analysis, the aim is not to make short term dynamic insights but indeed to find where
and how to act in order to prevent the outbreak of a crisis or to correctly intervene with the right type of mediation or negotiation.
I will look at some of the principal existing projects and methods in the field: the State Failure Task Project that involves statistical methods for studying those coun-tries at risk of political instability, the use of Machine Learning like neural networks for Military Interstate Disputes (MIDs), decision trees and rule learning for conflict analysis and for negotiation purposes. On each method an analysis of the perfor-mance will be discussed.
Chapter 6: Risk Assessment through Logic Function
In the Risk assessment field I can think of applying a learning method based on Logic function in which logic separation formulas are extrapolated in an automatic way from logic data. Logic separation formulas are sets of logic variables that, when verified for a certain record of the dataset, allow to classify it in the correct class. The Logic formulas are extracted from the dataset in an automatic way by Lsquare (Truemper, 1999) that is a particular type of learning system that operates in logic domain. Lsquare is freely distributed and has been developed in collaboration between the Istituto di Analisi dei Sistemi ed Informatica of Consiglio Nazionale delle Ricerche(IASI-CNR) and the University of Texas and is described in detail in Felici et al. (2004), and Truemper (2004). According to my best knowledge, Lsquare and, more in general, Logic Functions, have not been applied to the conflict field but they have been successfully used for different purposes like medical ones, financial ones etc.., and it has reached an high accuracy while finding those relations between the variables to be used for concrete purposes. In conflict analysis this aspect can be fundamental, in fact logic classification formulas, other than the simple classification,
0.0. CONTENTS 19
can also be used for providing new insights on the data, like the identification of the variables that are really interesting for controlling a country at risk, or for verifying some theoretical assumptions. In this chapter I will provide a description of the existing method based on Logic Functions and then I will describe some preliminary results of the application of the method to the dataset obtained from Russett and Oneal (2001a). The results are still too poor for considering the method as being useful for the purpose, but I will try to analyze its possible drawbacks and advantages in the conclusion of the chapter.
Chapter 1
An introduction to Conflict
Analysis
1.1
Introduction
The nature of conflict has assumed a different meaning from the past, especially since the end of Cold War (see www.certi.org). The wars of the past two decades have been largely internal ones, fed by regional politics and with cross-border impli-cations. If we look at Africa for example, over thirty conflicts have taken place in the past three decades causing tens of millions of people to leave their homes and causing millions of deaths. At the basis of these conflicts there have not been always contrasts between major political entities, but often the accumulation of hostility and aggression within states, societies, and civilizations for ethnic, economic, religious, or caste/class reasons. But Africa is not the only case: the majority of the world’s low-income countries are engaged in lasting conflicts, or transitory conflicts or share
the border with a country in conflict. (see figure 1.1 and 1.2).
The research community is thus paying more and more attention to security related problems because of their growing importance as a global challenge during the last years. Political, demographic, social, and even climatic economic evolutions have given life to new threats, more diverse, less visible and more technologically sophis-ticated than those faced in the past.
In the next future we will have to deal with always less stable regions and it is thus necessary to adopt a more coordinated approach to ensure that a high level of security is established across this new, more diverse territory. There is a great need of instruments to deal with the threats such as terrorism, proliferation of weapons of mass destruction, failed states, regional conflicts and organized crime.
In such a situation it appears essential that attention and research be directed, rather than to the development of more sophisticate defense technologies, to gaining a better understanding of the root reasons of such new threats, and to the development of effective tools for conflict analysis and prevention. A goal which is particularly important for the research in this area is the capability for anticipating the explosion of violent conflicts several months before they occur in order to effectively plan and implement appropriate conflict prevention and peace building activities.
1.2
Risk Assessment
The line of research that study the roots of conflicts is called Risk Assessment. This analysis has the aim of understanding the mechanisms that bring to an eruption of violence in existing conflicts in order to find where and how to act in situation
1.2. RISK ASSESSMENT 23
Conflictbarometer 2005 - Global Conflict Panorama
1
Global Conflict Panorama
Global Development
In 2005, there are 249 political conflicts. Two of
them are wars and 22 are severe crises, making a
total of 24 conflicts being carried out with a
massive amount of violence. 74 conflicts are
classified as crises, meaning violence is used only
occasionally. In contrast, there are 151
non-violent conflicts, which can be differentiated in 86
manifest and 65 latent conflicts.
Compared to last year, the number of conflicts
carried out on the highest intensity level has
slightly decreased from three to two wars. These
two, the conflict in Sudan´s Darfur region [=>
Sudan (Darfur)] and the war between the Iraqi
Interim Government and predominantly Sunni
insurgents [=> Iraq (insurgents)], had already been
carried out on the same level of intensity in the
previous year. Last year´s third war, in the DR
Congo [=> DR Congo (various rebel groups)],
deescalated to a severe crisis. The number of
severe crises has decreased significantly from 35 to
22, reflecting a significant reduction of conflicts
on the two highest intensity levels. In 2005, 24
high-intensity conflicts are counted, compared to
38 in 2004. The number of crises, representing
conflicts of medium intensity, has increased
strikingly from 50 to 74. On the one hand, this
increase signifies the trend of deescalation since
the majority of last year´s severe crises deescalated
by one level. On the other hand, this development
is due to the escalation of some formerly
non-violent conflicts to
a violent level and eleven new conflicts turning
violent in the very year of their beginning. The
number of conflicts on the non-violent intensity
levels has decreased by three, from 154 to 151.
While manifest conflicts have risen from 71 to 86,
latent conflicts were reduced from 83 to 65. The
total number of conflicts has risen from 242 to
249, as six conflicts ended in 2004 and 13 new
conflicts emerged in 2005. These are set as
follows: In Europe, two conflicts ended in 2004
and one new conflict emerged in 2005. In Africa,
no conflict ended in 2004, one is considered to
have ended in 2005 so far, as the territorial
dispute between Niger and Benin was determined
by a decision of the International Court of Justice
in The Hague. Five new conflicts occurred in
Africa. In the Americas, one conflict ended in
2004 and three new ones arose in 2005; in Asia
and Oceania, two ended and four are new; in the
Middle East and Maghreb, one ended and no new
ones emerged. Out of the 13 new conflicts, only
two are being carried out without violence:
Gambia vs. Senegal and Colombia vs. Venezuela.
Eleven are fought on a low level of violence:
France (rioters), Guinea (assassination attempt),
Ethiopia (opposition), Ethiopia (Oromo -
Somali), Sudan (Eastern Front), Belize
(opposition),
Colombia
(Guambianos),
Bangladesh (JMP), India (Meghalaya) and
Uzbekistan (opposition). In order to show a
long-term trend, the five intensity levels are categorized
into three groups: the two non-violent levels are
summarized as low intensity, crises as medium
intensity, and severe crises and wars as conflicts of
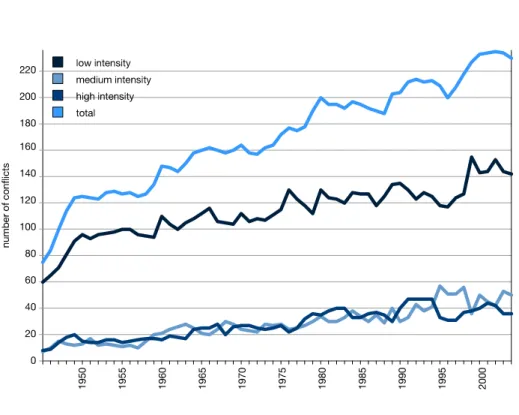
high intensity. The graph
(a) Ongoing global Conflicts of low, medium and high intensity 1945 to 2005 (http://www.hiik.de/)
(b) Levels of conflict intensity
24 CHAPTER 1. AN INTRODUCTION TO CONFLICT ANALYSIS
below also presents the total number of conflicts
observed. As shown by the graph, the number of
annually observed conflicts has more or less
continuously risen from 74 in 1945 to 249 in
2005. Most conflicts are low-intensity conflicts.
When looking at high-intensity conflicts, a
continuous and for the most part regular increase
is obvious, from seven in 1945 to 38 in 2004. So
the latest development of a decrease to 24
high-intensity conflicts in 2005 is quite remarkable.
Three phases of high escalations can be
distinguished: 1945 to 1949 from seven to 20,
1976 to 1979 from 22 to 37 and 1989 to 1991,
the period that saw the collapse of the Soviet
Union, from 31 to 47 marking the overall peak of
high-intensity conflicts. Comparing the graphs of
high- and medium-intensity conflicts, a
diametrical trend is notable in the rise and fall of
the curves.|*|When the number of high-intensity
conflicts increases, there is a decline in
medium-intensity conflicts or crises respectively. This
signifies that deescalating high-intensity conflicts
often remain on a violent level, while crises often
escalated to high-intensity conflicts. In many
cases, individual conflicts oscillate between the
level of a crisis and a severe crises or war.
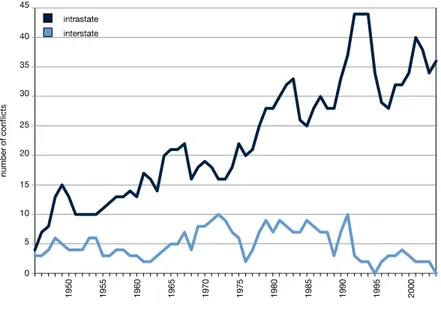
Analysis intrastate - interstate
In 2005, a total number of 178 internal and 71
interstate conflicts have been counted. None of
the two wars and 22 severe crises has taken place
between states, all of them being intrastate.
This represents a most remarkable finding. After
all, in only three interstate conflicts (Armenia -
Azerbaijan, Nigeria - Cameroon, Bangladesh -
India) violence has been used occasionally by the
opposing parties. This was the case in 71 internal
disputes. On the intensity level of manifest
conflicts, the number of intrastate conflicts has
also been considerably higher than that of
international conflicts, with 52 to 34. Solely in
matters of latent conflicts, interstate ones
outweigh those within states by four.
The long-term analysis, for which the two high
intensity levels, severe crisis and war, have been
summarized into one group, shows clearly that the
predominance of intrastate violent conflicts can be
observed from the beginning of the examined
period.
Regional Development
The Americas are the region with the least total
number of conflicts, 24. With a total of 86 out of
249, almost a third of all conflicts are located in
Asia and Oceania. With 79, the region has also
the highest number of low- and medium-intensity
conflicts. In terms of crises, Asia and Oceania with
28 is followed by Africa with six crises less, third is
Europe with half the number of Africa.
Remarkably, Europe is the third in terms of the
total number of conflicts, but has with only one
severe crises [=>Russia (Chechnya)] the least
number of high-intensity conflicts. Unlike
previous years, with eight most high-intensity
conflicts having been fought out in the Middle
East and Maghreb, Asia and Oceania ranks second
with seven high-intensity conflicts, Africa is third
with five. This is just the inverse order as in the
last
Figure 1.2: Ongoing intra- and interstate Conflicts of high Intensity 1945 to 2005 (http://www.hiik.de/)
1.3. EARLY WARNING 25
of instability. It usually takes into account those factors like ethnic and linguistic heterogeneity, income inequality, environmental stresses1, that is to those factors that can represent the pre-conditions of a crisis, that vary slowly over time and that are strictly connected with the context of the country under study: they are called structural factors. One of the goal of risk assessment is to develop models to be used to identify countries at greater risk of political instability and to give insights on how to correctly intervene with the right type of mediation or negotiation. Given the nature of the factors studied, no short term predictions on explosions of violence or conflicts are found with risk assessment methods but they can be used for preceding and complementing an analysis whose aim is indeed of making prediction (see section below). In fact, since assessments identify background and intervening conditions that establish the risk for potential crisis and conflict, they provide a framework for interpreting the results of real-time monitoring.
1.3
Early Warning
The line of research that regard the capability of making prediction about the explo-sions of violent conflicts goes under the name of Early Warning, defined2 as “..the systematic collection and analysis of information coming from areas of crises for the purpose of:
• anticipating the escalation of violent conflict
1The role of environmental stress as a cause of conflicts has recently been bought to the fore by
a certain number of researchers; among the works done in the area I mention here the seminal book of Homer-Dixon (1999).
• developing of strategic responses to these crises
• presenting options to critical actors (national, regional, and international) for the purposes of decision-making and preventive action”
The process of Early Warning involves a deep analysis of existing social conflicts, with the objective of calculating the likelihood that certain events may lead to violence or other crises and of studying the impact of those variables that change rapidly over time. This analysis takes into account a great variety of events like border crises, disintegrating regimes, civil wars, genocides, human rights abuses, refugee flows, or-ganized crime...etc, it thus regards those factors, like for example basic changes in political relationships, that accelerate and trigger off a crisis: they are called dynamic factors. Its importance stems from the assumption that a conflict in an early stage can be contained by non-military interventions (diplomacy, threat of sanctions, eco-nomic incentives, ...), or by deploying limited peacekeeping forces. These approaches work usually on datasets composed of what are called event data. They are machine coded data extracted from international sources like for instance the international press agencies. Among the various techniques correlated with early warning that uti-lize them there are the data mining techniques. As an example are the Paris in Los Angeles(PARIS)3 and the CEWS Projects (Alker et al. (2001)). Moreover, Kovar et al. (2000) have implemented and extended a data mining algorithm of Mannila and Toivonen (1996) that allows to find frequent episodes and thus interesting rules from the KEDS4database (Schrodt et al. (1994)). A brief description of the structure of the data and of the extraction process is given in Appendix B. The data collected in the process are thus utilized not only to estimate where conflicts are likely to
3http://www.usc.edu/dept/ancntr/Paris-in-LA/ 4http://www.ku.edu/ keds
1.4. QUANTITATIVE AND QUALITATIVE METHODS 27
emerge, but also to pick new opportunities to contribute to their resolution. This kind of analysis is very difficult to be developed, due to the thousands of different aspects present in a single country or in a single crisis. If we want to monitor the dynamics of a potential conflict, how shall we identify the associated indicators? A single crisis can have multiple causes, and among these, some can assume more im-portance than others. There can be variables that reinforce each other and variables that in some circumstances neutralize one another. Furthermore, the choice of the indicators depends on the type of event we would like to receive warning about.
1.4
Quantitative and qualitative methods
The early warning techniques used for analyzing such complex situations, as the risk assessment ones, are divided in two subclasses: quantitative and qualitative. There is an old battle to decide which of the two approaches is better. The qualitative analysis is based on the subjective assessment of the expert and is thus vulnerable to the biases and errors of the analyst. However there are situations in which such subjective assessment is vital, especially for early warning purposes. In fact, it is not always possible to capture all events which will bring the country to a crisis. There are, in some situations, underlying phenomena that can be discovered as critical only thanks to indigenous analysts, who base their insights only on their personal judgement. This is especially true in countries poorly covered by the international press. On the other side, quantitative approaches allow for an automated analysis, which is more speedy, more consistent and more transparent than the qualitative one. In the following I will look only at quantitative techniques and I will not enter in details regarding the qualitative analysis, something which is beyond the scope of
this work, although it is important to remark that both techniques are fundamental for the early warning process. Actually, one can think of a mixed approach in which quantitative techniques are used to highlight the regions of higher risk, and thereafter the analysis carried out by experts is used for a fine-grained assessment of the risk. There are several projects based on a mix of the two approaches and in the following, as an example, I will briefly describe three of them: FAST (which uses a quantitative and qualitative methods for early warning purposes) and CIFP (for risk assessment purposes) FEWER (for both risk assessment and early warning).
1.4.1
FAST
FAST (German acronym of early analysis of tensions and fact-finding) is a political early warning project launched in the 1998 by the Swiss Peace Foundation. The ob-jective of the FAST project is ”...early recognition of impeding or potential crisis sit-uations in order to act early and prevent violent conflict (see www.swisspeace.ch)...” FAST uses multiple methods based on qualitative approaches, for maintaining a context-specific understanding of the countries, and on quantitative ones for analyz-ing the huge flow of information while reducanalyz-ing its complexity. The project covers 25 countries/regions in Africa, Europe and Asia.
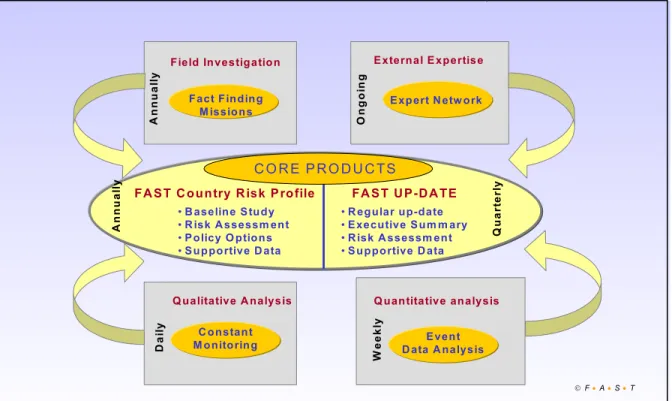
An overview of FAST methodology is shown in figure 1.3.
FAST relies on a daily monitoring of second hand sources (in print or on the In-ternet) as well as newswire analysis. Daily monitoring is complemented with weekly event-data analysis that is done prevalently automated. The FAST project in fact focus on event data analysis5: the data are extracted from some sources, they are 5Event data used by FAST is coded based on a method originally developed by Virtual Research
1.4. QUANTITATIVE AND QUALITATIVE METHODS 29 ! ! ! "! ! !
"! #$%&! '()*+,-.! /0*! 12-3)*)4)567! $0!
892(9:2;!
! ! &32!<:=!)>!<2-3)*.!/??4:2*!;:-3:0!-32!#$%&@>(/<2;)(A!/0*!-32! ,)((2.?)0*:05!?()*+,-.!/(2!.3);0!:0!#:5+(2!B7! ! ! !"#$%&'()'*&+,-.-/-#"01/'23&%3"&4' ! ! $.!#:5+(2!B!*2<)0.-(/-2.C!-32(2!/(2!-;)!#$%&!,)(2!?()*+,-.!>)(! 2/,3!,)+0-(6!<)0:-)(2*7!#$%&!,)+0-(6!(:.A!?()>:42.!/0*!#$%&!+?*/-2.D! ! !"DB!#$%&!E)+0-(6!F:.A!'()>:42.!
! ! !"#$%&'()! "*$%#+,$ !"*$%#)- $#. /%0 1 & 2 / +& 2 !3$&# 4 '#')5 &'(6,+, 7 8'&#+#'#+3$)'&'(6,+, 9 $ $ 0 (6 7 8'(+#'#+3$)5 &'(6,+, : /&,#'&# ; /&+#/%+&2 4 ' +( 6 <5 =>)?@A45 >! # B $28('%)8*AC'#$ # !"$D8#+3$)=8E E '%6 # B +,0)5 ,,$,,E $&# # =8**/%#+3$)4 '#' 7 8 ' %# $ %( 6 5 & & 8 '(( 6 <'D#)<+&C+&2 ; +,,+/&, <+$(C)F&3$,#+2'#+/& $ % & ' !( & % ) * $ +, <5 =>):/8&#%6)B +,0)@%/G+($ # H ',$(+&$)=#8C6 # B +,0)5 ,,$,,E $&# # @/(+D6)1 *#+/&, # =8**/%#+3$)4 '#' 5 & & 8 ' (( 6 ! !"!"!#!"!$!"!%Figure 1.3: FAST: Methodological overview (http://www.swisspeace.org/fast)
coded and then analyzed aggregating the events on a weekly or monthly basis so that a picture of the conflict potential or country stability or patterns of cooperation between actors can be drawn. The core products of FAST are country risk profiles that include an annual baseline study and frequent updates in the form of regular (quarterly, every three months) brief risk assessment. Once a year these profiles present a deep analysis of the situation in the target countries. For each country the key indicator groups for the purpose of constant monitoring are identified (see figure 1.4): they represent root causes (or background factors), proximate causes, and intervening factors. The latter set of indicators is divided by their importance
on increasing or decreasing conflict escalation. As FAST target countries are not all in pre-conflict situations, intervening factors take on different roles depending on the conflict cycle. In pre-conflict/ post-conflict countries, intervening factors measure the likelihood of armed conflict escalation while in in-conflict situation, intervening fac-tors track indicafac-tors that either increase or decrease the likelihood for peace-building. In all cases, however, intervening factors are not simply geared at negative factors that can lead to warning of situation worsening, but also to windows of opportunity for positive developments (signals of hope).
Figure 1.4: FAST Analytical framework: developed to identify and categorize causes and issues of conflict for each target country (http://www.swisspeace.org/fast) The early warning indicators used in the FAST project (but also in other interna-tional projects) are mainly built from the event data extracted automatically from international sources like Reuters, but in the last years FAST has tested a different approach with better results. For each country/region monitored, a group of local experts (FAST Local Information Networks (LIN)) follow the influx of information
1.4. QUANTITATIVE AND QUALITATIVE METHODS 31
independent from the western media coverage, often poor for certain countries and certain situations (external expertise). The information thus collected are then quan-tified and translated in graphs that describe the evolutions of key early warning in-dicators. LINs provide much more detailed information than computer-parsed event data, in fact they provide area-specific information, constant up-to-date information monitoring, specific and targeted information as requested from the users.
1.4.2
CIFP
Another project that uses both quantitative and qualitative approaches is the CIFP one6. The analysis discovers situations in which certain conditions for a particular conflict are present; the main focus is on Risk Assessment but also on the develop-ment of a template for consolidating risk assessdevelop-ment and early warning methodologies into an integrated system. The work of CIFP has the aim of enabling policy makers to identify factors that can generate conflict while rapidly assessing policy responses to a critical situation. CIFP collect international data gathered from statistical sources and it identifies statistical information on the economic, social and cultural aspects of the countries of the world. In particular, for each country it provides a set of data regarding: demography, economics, military capability, political climate and inter-nal stability, risk and conflict potential, social development, human security and the environment. The CIFP database include over one hundred performance indicators for 196 countries (for the years 1985-2004).
6Country Indicators of Foreign Policy is a project initiated by the Department of Foreign Affairs
and International Trade (DFAIT) in partnership with the Norman Paterson School of International Affairs at Carleton University, in Ottawa (www.carleton.ca/cifp/)
1.4.3
FEWER
The definition of Early Warning given previously derived from Fewer7 which is the Forum on Early Warning and Early Response. Initiated in 1997, in 2004 it evolved in Fewer-international (see www.fewer-international.org). It is an organization sup-porting conflict prevention efforts with a specific focus on intra-state conflict. It is involved in developing a series of new mechanisms, procedures and tools, appropri-ate to the prevention, containment, mitigation, and resolution of violent intra-stappropri-ate conflicts. According to the research conducted by the FEWER network members, in order to reach effective early warning capabilities, the use of a range of data sources and analytical methods is required: local analysis engaged in country monitoring, newswire monitoring analysis (events data) and structural data analysis. The struc-ture of Fewer early warning system is shown in figure 1.5.
The projects FAST and CIFP were both among the partners of FEWER. CIFP worked on a pilot project in partnership with the Forum on Early Warning and Early Response until 2004. The pilot project was intended to establish a framework for communications, information gathering and sharing, and operational coordination and to work towards a “Good Practice” conflict early warning system involving the various members of the FEWER network.
Within the system, CIFP had the role of providing structural data and to perform analyses on conflict and peace generating factors. These analyses emerged from an assessment of various models of conflict analysis that have been developed by key actors in the field of conflict prevention and early warning, including FEWER,
1.4. QUANTITATIVE AND QUALITATIVE METHODS 33
FAST, UNDP8, the Clingendael Institute9 and CIDCM (Center for International Development and Conflict Management). On the other side, FAST focused on field-based systematic data collection, conflict monitoring and analysis on selected regions of the world for a real time perspective on the flows of events. FAST is currently a membership of FEWER-Eurasia, a project that was set up in 2004 as a non-profit foundation in Moscow and that analyses the situation on North Caucasus, Georgia and Eastern Siberia. The regional and international expert group had instead the role of assessing the importance of the different indicators and to understand the problems of the main stakeholders.
8UNDP is the United Nations Development Programme: see http://www.undp.org/
9Clingendael Institute, or Netherlands Institute of International Relations Clingendael, is an
independent institute of knowledge which studies various aspects of International Relations. see http://www.clingendael.nl/
FAST/VRA
(News-Wire Monitoring Analysis) (e.g Reuters, BBC) Product: Monthly news/ summaries,/graphic analyses Dynamic Exchange: (FASTLocal analyst/CIFP) Structural data/ surveying/analysis: (CIFP/NPSIA)
Product: biannual data/survey/ graphic analysis
Local analysis engaged in country monitoring Using early warning methodology and range of
information and data sources Product:
Final Early warning reports
FEWER network research activities
Products: who is doing what and
preventive instruments surveys (Russian, US government, EU, local NGOs Regional and international expert group Role: Feedback on early warning reports Strategic roundtables (Policy planning)
Chapter 2
Causal Models
2.1
The dynamics of conflicts through analytical
models
The study of conflicts and of their dynamics is now a wide multidisciplinary research area, with a large body of literature and with many specialized journals. Although most of the approaches to conflict analysis one can find in literature of the inter-national studies remain at qualitative level, the use of analytical and quantitative models is not rare, in some cases highly formalized and with a certain degree of mathematical sophistication. There are models, representing general frameworks, which can be applied to the analysis and representation of any particular conflict (or at least of large classes of conflicts), in order to determine who are the actors really involved in the conflict or affected by it (the stakeholders), and to fully understand all the elements which define the conflict (interests, needs, ...) and their interactions.
These models present typically a low level of formalization and bear many similari-ties with some techniques for problem structuring developed within the Operations Research (OR) area (Rosenhead and Mingers, 2002). Here our interest is on other types of quantitative models, whose main goal is the study of the effects on conflicts (their origin and their dynamic behavior) of single elements (arms, technology, re-sources, environment, economic development, ethnic and cultural differences, ...) or of subsets of such elements. These models often bear a strong resemblance to the kind of models developed in the economics theory area. Possibly the first attempt to approach the analysis of conflicts via mathematical tools is due to the British mathematician L. F. Richardson, in the years between World War I and World War II. In a book published after his death, Richardson (1960) analyzes the dynamics of the arms race by means of a model based on differential equations. It is interesting to note that Richardson’s model has something in common with another model de-veloped about at the same time: the well known Volterra equations. In his model the Italian mathematician Volterra (1926a,b) studied a particular conflict situation in which there are two populations, one of predators and one of preys sharing the same habitat.
Richardson model has more historical relevance rather than a practical one: his model for the first time shows analytically how the desire to be more secure may lead to an increase in insecurity and eventually to war. The study of analytical models of conflicts has grown after World War II within the new born area of peace studies. One can find many examples of such models in specialized journals of the area, among them particularly relevant is the Journal of Conflict Resolution. Worth mentioning are the attempts to build a systematic analytical theory of conflict, due to Rapoport (1960), Isard and Smith (1982) and Isard (1992). Isard and Smith present not only analytical models but also practical procedures (algorithms) for the
2.1. THE DYNAMICS OF CONFLICTS THROUGH ANALYTICAL MODELS 37
management and resolution of conflicts.
2.1.1
Computer simulation and system dynamics
During the years, computer simulation, one of the most widely used OR techniques, has proved to be a technique that can give a substantial contribution to conflict analysis. In the following I will take into account a computer simulation modeling technique called System dynamics. Forrester (1961), which is considered as the sys-tem dynamics founder, in a recent article has defined it as “...a professional field that deals with the complexity of systems. System dynamics is the necessary foundation underlying effective thinking about systems. System dynamics deals with how things change through time, which covers most of what most people find important. System dynamics involves interpreting real life systems into computer simulation models that allow one to see how the structure and decision-making policies in a system create its behavior.”(Forrester, 1999).
It also stated that “...System dynamics combines the theory, methods, and philos-ophy needed to analyze the behavior of systems in not only management, but also in environmental change, politics, economic behavior, medicine, engineering, and other fields. System dynamics provides a common foundation that can be applied wherever we want to understand and influence how things change through time. The system dynamics process starts from a problem to be solved, a situation that needs to be better understood, or an undesirable behavior that is to be corrected or avoided. The first step is to tap the wealth of information that people possess in their heads.[. . . ]System dynamics uses concepts drawn from the field of feedback con-trol to organize available information into computer simulation models. (Forrester,
1991)” Since 1961, system dynamics has grown extensively and its application can be found in: corporate planning and policy design, public management and policy, biological and medical modeling, energy and the environment, theory development in the natural and social sciences, dynamic decision making, complex nonlinear dy-namics. It has been used to address practically every sort of feedback system where “[...]feedback refers to the situation of X affecting Y and Y in turn affecting X per-haps through a chain of causes and effects. One cannot study the link between X and Y and, independently, the link between Y and X and predict how the system will behave. Only the study of the whole system as a feedback system will lead to correct results (from www.systemdynamics.org/)”. What makes system dynamics different from other approaches that study complex systems is indeed the use of feedback loops, stocks and flows (see Appendix D) because these elements allow to describe how even simple systems may display nonlinearities.
2.1.2
Quantitative vs Qualitative analysis in system
dynam-ics
We have already seen how the relative merits of quantitative and of qualitative models is a matter of discussion among the researchers in early warning process. Even in the field of system dynamics the discussions about the two approaches is still open. If we think at the basic concept of system dynamics, it might seem quite natural to model the dynamics of a complex system by means of quantitative variables but in the reality it is not: Forrester (1961) in 1961 stated: “In the proper formulation of a system dynamics model the model variables should correspond to those in the system being represented...Sufficiently close correspondence of model and
2.1. THE DYNAMICS OF CONFLICTS THROUGH ANALYTICAL MODELS 39
real-system variables is obtained [by carefully ensuring that] the decision functions represent the concepts, social pressure and sources of information that control the actual decisions”. There are cases with uncertainties in concepts, pressures and decisions, can be difficult or even prevent even from building a quantitative model. In such cases it might be the case to restrict the analysis to a qualitative level, that is, to use “non-simulation” typer of System Dynamics approach in which insights are provided inferring rather than calculating the behavior of the system over time. (see the model of Hosler et al. (1977) built for describing the collapse of the Maya). In Coyle (1985) it is shown that a qualitative analysis can be useful not less than a full-scale quantitative modelling approach. That is true for those problems characterized by a high level of uncertainty. Typical is the case of the Health Care Sector (Coyle (1984)), which is often full of uncertainty because of the need to deal with human beings and their frailties in the context of medical diagnosis. In such a situation an inference diagram can be enough to provide useful suggestions and insights to decision makers.
2.1.3
Modelling process
We have to bear clearly in mind that the problems we are going to study are very complex and that any model is a simplification of the reality and is intended only as a tool to be used for a better understanding of the reality itself and to help the deci-sion makers. Hence in any modelling process it is very important to make clear the limits of the model we are building. The process of modelling using system dynamics is very flexible, in the sense that there is not a fixed procedure or fixed rules: the researchers can build a model in different ways, based on their modelling experience. For Coyle (1998) the essence of System Dynamics is to start and finish with inference
diagrams and to design several diagrams of the same problem for different purposes. Essentially the study starts with the understanding of client’s concerns and mental models about the system. Then, after collecting more information, a more deeper study is done. This is a critical point because it might show the impossibility of building a quantitative model so that the analysis that follows have to continue only at a qualitative level; while, if a quantitative model is justified, then levels, rates and auxiliaries should be identified (for the system dynamics notation I refer to Sterman (2000)). System dynamics has already been used for modelling defence problems: starting from Hacket’s Third World War scenario (Hacket (1978)), Coyle (1981) has built a System Dynamics model and has shown its use by testing different strategic options or force balances. I will not enter in detail, but there are interesting aspects in this study that could be useful for future works: the type of model built can be utilized also for describing other scenarios simply changing the initial conditions, and the small number of equations (few hundreds) allow to run the model on a computer in a very small amount of time, unlike large simulation models which require large running time on big computers.
2.2
Lateral Pressure model
Even if there is an extensive literature on the causes of war and conditions of peace, yet there is no agreement on why countries go to war, why violence occurs or how internal or external conflicts might be interconnected giving rise to common dynam-ics. The model of Wils et al. (1998) that I will present in the following, tries to
2.2. LATERAL PRESSURE MODEL 41
answer these questions based on the Lateral Pressure theory of Choucri and North (1975). The theory identifies three master variables, (P)opulation, (T)echnology and (R)esources, and argues that the interactive effects among them can redefine the na-tional profiles of states and that, under certain conditions, can generate pressures that bring to an expansion outside national boundaries and that can possibly lead to competition, international conflict and violence. Their interaction gives rise to what is called Lateral Pressure, which can be seen as an accumulation of domestic strains leading to an expansion over the boundaries. The theory was first formulated by Choucri and North (1972) and applied in 1975 to the 45 years that led to the first World War, then it was applied by Ashley (1980) to the analysis of the Sino-Soviet-American situation in the 25 years of the post-war period. The basic causal structure of the original theory is shown in figure 2.1. This figure shows that the three master variables’ joint interaction can generate lateral pressure, which in turn produces be-haviors bringing to action-reaction spiraling, or bargaining, or leverage etc... From these processes, violent conflict or/and peaceful options like trade may emerge: in the first case, a loop that leads to expansions and conflict is reinforced while in the second one, a loop that mitigates the dangerous influences is reinforced.
The construction and the analysis of the lateral pressure system dynamics model has the aim of
• relating internal sources of pressure to external activities
• specifying intervening processes that mediate between internal pressures and external conflict
• defining the impacts of behavior that lead to external conflict
Figure 2.1: lateral pressure hypothesis (1972)
For doing this, in addition to the original master variables, other factors like interven-ing behavioral variables (as propensities for external behavior, trade, military activ-ity) and outcome variables (as internal and external conflict indices) are inserted. In order to take into account both situations in which internal tensions bring to external conflict or internal conflict, another important concept, which were not present in the original theory, has been introduced: the Internal Tension. It describes those pressures that are not “exported” over the country boundaries but serve to motivate internal insurgencies. The formulation of internal tension, expressed, like the lateral pressure, in terms of the master variables, derives from the studies of Cohen Co-hen (1984) and Boserup Boserup (1968) and from Kamiya (1997). Mathematically, both lateral pressure (LP) and internal tension (IT) are written as functions of the three master variables. The LP value can be considered as an increasing function of
2.2. LATERAL PRESSURE MODEL 43
population (P) and technology (T), and a decreasing function of resources (R):
LP = f (T · P
R ) (2.1)
The IT function describes those pressures that can increase internal tensions and bring to internal conflicts:
IT = g(P R ·
1
T) (2.2)
For a given quantity of accessible resources, an high density of population needs an high level of technology to have an internally stable society while a low density of population requires only a low level of technology.
The authors have chosen the square root function for both LP and IT because it is simple, robust and it is a concave function: this need derives from the fact that each unit of population or technology or resource contributes to the variation of LP and IT with less impact when the numbers increases (diminishing marginal contributions). Take for instance the function LP . Its practical meaning, beyond its mathematical expression, is that if the level of population and technology is high as opposed to a low level of resource, then there can rise the need for the state of expanding beyond its national boundaries, which can lead to violence and conflicts.
The model has been tested on 13 countries at different level of development and in different geographical areas. A simulation from 1960 to 2050 has been carried on; the available data, from 1950 to 1990, have been used to calibrate the model. From the behavioral models thus built, it is possible to describe the dynamics relations among the variables, and the causal chains and the feedback loops involved.
The model of Wils et al. (1998) is shown in figure 2.2.
Figure 2.2: lateral pressure model
In the model there are five stock variables, which describe the status of the system, the corresponding flow variables, which are representatives of the activities ongoing on the system and a certain number of auxiliary variables and constants. The stock variables are: lateral pressure, internal tension, population, technology and military force. The military force is expressed in term of the military expenditure which is a percentage of the GDP. Since it is really difficult to operationalize a complex variable such as technology the authors have decided to use the GDP (Gross Domestic Product) or PPP (Purchasing Power Parity: a measure of GDP adapted for local prices). The flow variables are for instance population growth, the change in time of the lateral pressure. . . .
2.2. LATERAL PRESSURE MODEL 45
2.2.1
Adaptation
In practice the effect of the master variables, P,T and R on LP and IP is more complex than it appears from (2.1) and (2.2). In fact, in addition to the effect of such variables in increasing or decreasing the level of LP and IT, there is also a phenomenon of adaptation which may have the effect of smoothing changes in LP and IP: the lateral pressure, as described only through the constellation of the master variables, should follow the trend of the population. In the reality, sudden changes increasing the level of lateral pressure may not bring immediate eruption of violence: there is a form of adaptation of the society which takes into account old stresses and that can reduce the potential of a conflict. This phenomenon is represented by means of two variables that the authors have called LP drain and IT drain.
As a consequence, the variations of the stock lateral pressure variable (LP) over time has the following form:
LP (t + 1) − LP (t) = LP change(t) − LP drain(t) (2.3) with LP change(t) = √ P ∗√T √ R (2.4) LP drain(t) = LP (t) 25 + Internationalpotential(t) (2.5) Where the LP change(t) is the lateral pressure variation as a function of only P, T and R and represents the accumulation of pressure over time, while LP drain
represents the adaptation effect. The first term of LP drain(t) is the adaptation term that regards those loads of pressure that are not yet ingested at time t (the time necessary to adapt is taken as 25, one generation). The second term represents the potential of International conflict at time t1.
The same can be said for internal tension.
IT (t + 1) − IT (t) = IT change(t) − IT drain(t) (2.6) IT change(t) = √ P √ T ∗√R (2.7) IT drain(t) = IT (t) 25 + Domesticpotential(t) (2.8) IT (t + 1) − IT (t) = IT change(t) − IT drain(t) (2.9)
Where the IT change(t) is the internal tension variation as a function of only P, T and R and represents the accumulation of tension over time, while IT drain represents the adaptation effect.
2.2.2
Instability: an example
The graph of figure 2.3 is the result of a simulation on Rwanda data and describe the adaptation mechanism for internal stresses. Rwanda has experienced domestic 1Being function of several terms, see Wils et al. (1998) for a complete definition of International
2.2. LATERAL PRESSURE MODEL 47
Figure 2.3: The adaptation mechanism for internal stresses
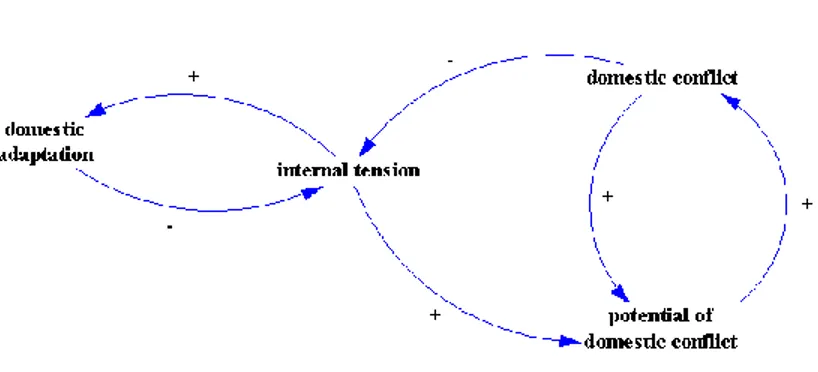
conflict in the early 1960 (in 1961 the Mouvement d´emocratique r´epublicain toppled the monarchy of the Tutsis) and a genocide in 1994 against the ethnic group of Tutsis in which more than 800,000 people were killed. In the graph, consistently with the historical data, multiple eruptions of domestic conflict due to high values of internal tensions are discovered. The simulation shows that a situation that has its base in the constellation of master variables (given by the red line internal tension change) rarely avoid the continuum of a conflict. In one simulation the authors have instantly switched the population growth to zero. This has immediate reduced internal tension change but, given that the actual internal tension is the accumulation of decades, the tensions decrease slowly. Therefore, even at a less frequent rate, conflict continues. Internal tension drain is the factor that produce instability. The reason for the insta-bility derives from some feedback loops concerning internal pressures: for instance, when IT(t) rises, the first term of IT drain(t), IT (t)25 (adaptation term), rises as well and the same does IT drain(t). But IT drain(t) is negatively correlated with IT(t+1) so that a negative balancing loop is formed that decreases the value of tension at
time t + 1. At the same time, the augmentation of IT(t), causes an augmentation of Potential of domestic conflict and so for the domestic conflict (potential of domestic conflict and domestic conflict forms a reinforcing loop), which causes a decrease of IT(t+1), thus forming another balancing loop (see figure 2.4). The internal feedback mechanisms of adaptation can decrease the potential of conflict but, at the same time, violence can increase the risk of continued violence: there is a negative feed-back between adaptation and pressure, a negative one between conflict and pressure, a reinforcing feedback between conflict and the potential of conflict. The concept of adaptation introduced by the authors is indeed critical. When studying this model I thought that It is true that an augmentation of pressure (internal or external) doesn’t bring always conflicts, but if a sudden big conflict occurs (as a genocide), does the adaptation false the model or not?
Figure 2.4: feedback loops between internal tension and factors related with internal tension
2.2. LATERAL PRESSURE MODEL 49
2.2.3
Lateral Pressure-Internal Tension
The insertion of the IT has been an important addition to the lateral pressure theory because the nature of nowadays conflicts is such that the epicenter of violence is often inside the country. Again, as for the adaptation mechanism, some questions arise: unfortunately due to the way the function have been implemented, there is almost no relation between IT and LP. It seems that internal conflicts are never correlated with international conflicts: this may not be the case, especially in these years where acts of what is called terrorism may explode internally and externally, converting internal tension in external tensions. For instance, a great part of the model is dedicated to the military aspects: how this aspect influence the decision of the population on expanding over their boundaries? And in which way? Why is there no connection between military force and internal tension? The population may feel oppressed or is in fact oppressed by the government; this link is not implemented and it seems that it could be crucial in some situation. After having deeply understood the meaning of the two core functions, it would be necessary to introduce a connection between them and between military force and the factors related with internal pressures. A possible solution can be to split the IT function in two: one could be designed as influenced by a certain number of external factors like the trade and bargain leverage which is about trade and commercial negotiations, and the other as a factor that influence the lateral pressure (the connection do not need to be direct).
2.2.4
Internal and external world
One of the crucial steps in building a model is the choice of the system boundaries, that is the decision about which variables are endogenous to our model and which are