Universit`
a degli Studi di Ferrara
DOTTORATO DI RICERCA IN FISICA Ciclo XXIV
COORDINATORE Prof. Filippo Frontera
Multi-sensor Satellite Precipitation Estimate for
Hydrogeological Hazard Mitigation
Settore Scientifico Disciplinare FIS/06
Dottoranda:
Dott. Lisa Milani
Tutore:
Prof. Federico Porc´u
To my parents
Contents
List of Acronyms v
Introduction 1
1 Nowcasting and flood risk mitigation 3
1.1 High-impact meteorological events . . . 4
1.1.1 Global, continental and local relevance of the problem . . . 4
1.1.2 Research activities in Europe . . . 10
1.2 The research in Italy and the PROSA System . . . 18
1.2.1 The PROSA structure . . . 19
1.2.2 PROSA Products . . . 20
1.2.2.1 PROSA Precipitation Products . . . 22
1.2.2.2 PROSA soil products . . . 26
1.2.2.3 PROSA Numerical Weather Prediction products . . 27
1.2.3 PROSA validation and demonstration activities . . . 28
1.3 Nowcasting systems . . . 28
1.3.1 UK Met Office Nowcasting Systems . . . 28
1.3.1.1 The Nimrod System . . . 28
1.3.1.2 The GANDOLF System . . . 29
1.3.1.3 STEPS System . . . 31
1.3.2 The TAMORA algorithm . . . 31
1.3.3 PERSIANN Systems . . . 33
1.3.4 Satellite Application Facility to support Nowcasting (SAFNWC) 34 2 Instruments for precipitation estimate 37 2.1 Ground based instruments . . . 37
2.1.1 Rain-gauges . . . 37
2.1.2 Meteorological Radar . . . 38
2.2 Satellite Remote sensing . . . 44
2.2.1 Basic definitions . . . 46
2.2.2 Visible . . . 50
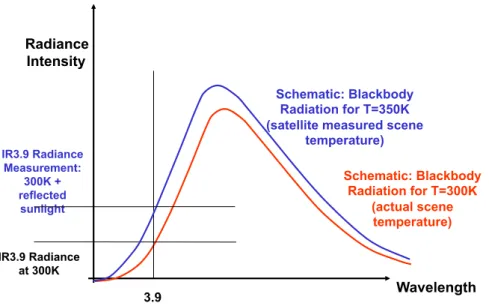
2.2.3 3.9 µm . . . 52
2.2.4 Infrared: atmospheric window wavelengths . . . 57
2.2.5 Infrared: absorption wavelengths . . . 59
2.2.6 Microwave . . . 61
2.3 Space-borne sensors . . . 63
2.3.1 SEVIRI sensor . . . 64
2.3.2 AMSU sensors . . . 64
3 Artificial Neural Networks 69 3.1 Neural Network in geophysics and remote sensing . . . 69
3.2 ANN introduction . . . 70
3.3 Single Layer Perceptron . . . 72
3.4 Multi-Layer Perceptron . . . 74
3.5 ANN building phases . . . 76
3.5.1 Data set building phase . . . 76
3.5.2 Training phase . . . 76
3.5.3 Testing phase . . . 77
3.6 Interpretation of network outputs . . . 78
3.6.1 Regression problems . . . 78
3.6.2 Classification problems . . . 80
4 Satellite precipitation estimate algorithms 83 4.1 The original algorithm . . . 83
4.2 PROSA Product 1 . . . 89
4.3 ANN training over Italy . . . 90
4.4 Night-time ANN . . . 95
4.5 Classes of precipitation intensity . . . 98
4.6 PROSA Product 2 . . . 104
CONTENTS iii
4.8 Microwave data for ANN online calibration . . . 110 4.9 PROSA Product 3 . . . 115
Conclusions 119
A Satellite estimates validation 121
A.1 Dichotomic parameters . . . 122 A.2 Multicategorical parameters . . . 124 A.3 Continuous variables . . . 125
List of Acronyms
ALOS Advanced Land Observing Satellite AMV Atmospheric Motion Vectors
AMSR-E Advanced Microwave Scanning Radiometer for EOS (onboard Aqua) AMSU Advanced Microwave Sounding Unit
ANN Artificial Neural Network
ASAR Advanced Synthetic Aperture Radar (onboard ENVISAT) ASI Italian Space Agency
AVI Aree Vulnerate Italiane (Italian areas affected by mass-movements and floods) BB Binary Bias
CDRD Cloud Dynamics & Radiation Database
CETEMPS Centro di Eccellenza per l’Integrazione di Tecniche di Telerilevamento e Modellistica Numerica per la Previsione di Eventi Meteorologici Severi -Excellence Centre for Remote Sensing Technique Integration and Numerical Modeling for Severe Meteorological Events Forecasting
CMORPH CPC MORPHing method
CNR Consiglio Nazionale delle Ricerche (National Council of Research of Italy) COST COoperation in Science and Technology
CPC Climate Prediction Center CRM Cloud Resolving Model CSI Critical Success Index
DPC Dipatimento della Protezione Civile (Department of Civil Protection of Italy) DTM Digital Terrain Model
ENVISAT European ENVIronment SATellite EO Earth Observation
ETS Equitable Threat Score
EUMETNET Network of European Meteorological Services
EUMETSAT European Organization for the Exploitation of Meteorological Satel-lites
FAR False Alarm Ratio FP Framework Programme
FPn Framework Programme number n FSE Fractional Standard Error
GANDOLF Generating Advanced Nowcasts for Deployment in Operational Land-based Flood forecasts
GEO Geostationary Earth Orbit
GNDCI Gruppo Nazionale per la Difesa dalle Catastrofi Idrogeologiche (National group for the prevention of hydrogeological disasters of Italy)
GOES Geosynchronous Operational Environmental Satellite GPM Global Precipitation Measurement
HK Hanssen-Kuipers Skill Score HRV High Resolution Visible
H-SAF EUMETSAT Satellite Application Facility on Support to Operational Hy-drology and Water Management
HSS Heidke Skill Score
IFAC Istituto di Fisica Applicata ’Nello Carrara’ - Applied Physics Istitute ’Nello Carrara’
vii
IPWG International Precipitation Working Group IR Infrared
ISAC Istituto di Scienze dell’Atmosfera e del Clima Institute of Atmospheric Sci-ences and Climate (CNR)
LAMPOS Lotta alle Alluvioni Mediante Prodotti di Osservazione Satellitare LEO Low Earth Orbit
LINET Lightning Detection Network MHS Microwave Humidity Sounder MLP Multi-Layer Perceptron
MODIS Moderate Resolution Imaging Spectroradiometer MSG Meteosat Second Generation
MVIRI Meteosat Visible and InfraRed Imager MW Microwave
NBIAS Normalized Bias NIR Near infrared
NOAA National Oceanic and Atmospheric Administration (USA) NRLT Naval Research Laboratory Technique
NWP Numerical Weather Prediction OOM Object Oriented Model
OPERA Operational Programme for the Exchange of weather RAdar information PALSAR Phased Array type L-band Synthetic Aperture Radar
PDF Probability Density Function
PERSIANN Precipitation Estimation from Remotely Sensed Information using Artificial Neural Networks
PERSIANN-GT PERSIANN GOES-IR-TRMM TMI PMW Passive Microwaves
POD Probability Of Detection PoP Probability of Precipitation
PROSA Prodotti di Osservazione Satellitare per Allerta Meteorologica QPE Quantitative Precipitation Estimation
QPF Quantitative Precipitation Forecast RADAR RAdio Detection and Ranging RMSE Root Mean Square Error
RR Rain-rate
SAF Satellite Application Facility
SAFNWC Satellite Application Facility to support Nowcasting SAR Syntetic Aperture Radar
SEVIRI Spinnig Enhanced Visible and Infrared Imager
SICI Sistema Informativo Catastrofi Idrogeologiche (Information System on Hy-drogeological Catastrophes)
SPOT Systme Pour LObservation de la Terre SSM/I Special Sensor Microwave/Imager
SSMIS Special Sensor Microwave Imager/Sounder SSP Sub Satellite Point
STEPS Short Term Ensemble Prediction System TAMORA TAMSAT, Met Office Rainfall for Africa TB Brightness Temperature
TAMSAT Tropical Applications of Meteorology using SATellite data and ground-based observations
ix
TBV Brightness Temperature (vertical polarization) TBH Brightness Temperature (horizontal polarization) TRMM Tropical Rainfall Measuring Mission
TS Threat Score
UNISDR United Nations International Strategy for Disaster Reduction UTC Coordinated Universal Time
UW-NMS University of Wisconsin - Nonhydrostatic Modeling System. VIS Visible
WGS84 World Geodetic System 84
WMO World Meteorological Organization WV Water Vapor
Introduction
High-impact meteorological events have in the last decade received increasing inter-est for the relevant negative consequences on both social and economical matters. Considerable efforts have been made to mitigate the effects of floods and landslides on human life and economy, on one hand trying to mitigate ground effects with progresses in civil engineering, environmental protection and in the strategies to optimize the reaction of the population to the predicted hazard, and on the other hand improving the monitoring and forecasting of meteorological forcing.
Many projects addressing different aspects of the risk mitigation strategy have been financed from Governmental Institutions, focusing on meteorological, hydrological, management and social aspects. Among others, one of the last project is PROSA (Prodotti di Osservazione Satellitare per l’Allerta Meteorologica - Satellite prod-ucts for meteorological alert), funded by the Italian Space Agency (ASI) as a pilot study designed to provide institutional end users, such as the Italian Civil Protection Agency, with advanced nowcasting tools. With the term nowcasting are indicated a class of algorithms and techniques that aim to provide the detailed description of the current weather and the state of the atmosphere at a local scale and the extrap-olation of the current state in the forthcoming hours. PROSA represents the Italian attempt to solve the meteorological side of the hazard mitigation scheme and it is oriented to design, develop, test and demonstrate a prototype system dedicated to the innovative dynamic characterization of meteorological parameters at the ground by means of satellite data.
This Thesis work arises from PROSA and finds its development as implementation and optimization of a satellite precipitation estimation algorithm. Started from a similar algorithm implemented over British Isles, the algorithm uses Artificial Neu-ral Networks to correlate multi-sensors satellite data, in the Visible, Infrared and Microwave bands, and precipitation rate at ground.
The whole work is divided in three main steps, following the PROSA structure: the first version of the algorithm gives a qualitative precipitation estimate divided in rain and no-rain classes, with seasonal and day-time characterization of the precipitation maps. The second version gives a quantitative estimate, dividing the rain-rate in five precipitation classes. Finally, the last version provides precipitation maps with quantitative values expressed in mm h−1.
The study carried out and the results obtained are reported here in four chapters, followed by a final concluding section.
Chapter 1 gives an overview of the meteorological hazard problem with a quan-tification of human and economic losses and the possible solutions in order to miti-gate the risk. In this chapter many projects addressed to mitigation strategies are described and in particular the Italian PROSA Project with all its aspects and al-gorithms developed.
Chapter 2 illustrates precipitation retrieval instruments and satellite sensors, giving a description of the spectral bands used for this work and of the physical principles on which the use of satellite measured reflectance and radiance to infer precipitation is possible.
Chapter 3 describes the theoretical basis of Artificial Neural Networks, mention-ing some examples of the use of Neural Network for precipitation estimates.
Chapter 4 gives a detailed description of the algorithms developed in this work. Main characteristics of the used technique are explained and major problems are illustrated. Finally, validation results are reported and the performances of the technique are discussed, with insights on possible future work.
Chapter 1
Nowcasting and flood risk
mitigation
Over recent years we are experiencing destructive precipitation events, many of which generate floods with consequent relevant effects at the ground, i.e. a great number of casualties and economic losses worldwide. This is due not only to an increasing of high-impact weather events, but also to the vulnerability created by various human activities. Considerable efforts have been made to mitigate the ef-fects of floods on human life and economy, on one hand trying to mitigate ground effects, and on the other hand improving the monitoring and forecasting meteoro-logical aspects.
With the term Nowcasting, after Scofield (1977) [1], is intended the detailed descrip-tion of the current weather and the state of the atmosphere at a local scale and the extrapolation of the current state in the forthcoming hours. The ability to make frequent and detailed observations of the atmosphere is fundamental to any attempt to nowcast the evolution of mesoscale processes, such as, for example, high-impact weather events.
This chapter gives an overview of the research efforts undertaken in the last years to mitigate the meteorological risk, and presents a review of different nowcasting approaches, illustrating some example of successful operational systems. Finally, a description of the system designed under the PROSA project is presented.
1.1
High-impact meteorological events
Heavy precipitation is the most dangerous meteorological hazard affecting the Eu-ropean and Mediterranean countries, followed by windstorms and hail. Generally speaking, the impact of a meteorological event on the society mainly depends on four different factors: the severity of the meteorological phenomena, the geomor-phological characteristics of the ground, the population density and assets value and the readiness of the ground structures (and population) to react to the hazard [2]. Following the United Nations International Strategy for Disaster Reduction ter-minology (UNISDR, 2009) the term hazard can be used to mention the first two factors, while the term vulnerability refers to the other two. Thus, the actual dam-age is determined by the complex interactions of the four basic factors: in order to mitigate the effects of high-impact meteorological events, a strategic action on any of them is strongly required. While improving numerical weather predictions, with an emphasis on extreme events, is recognized to be of primary importance, an effective losses reduction can only be achieved if the improvement in forecast is accompanied by progresses in civil engineering and in the strategies to optimize the reaction of the population to the predicted hazard. Quite often, however, meteorology could be regarded as the dominant factor in case of very high rain intensities, especially if pro-duced by rapidly growing cloud systems (such as thunderstorms). Convective cloud systems at all scales, from isolated, single-cell thunderstorm to large storm cluster, are often responsible for high rain-rates and their initiation and development are difficult to forecast with conventional numerical weather prediction tools. For these cases, a forecasting approach based on detailed observation and simple evolution models, such as nowcasting, can be considered a valuable operational choice for a more effective prevention strategy [3][4].
1.1.1
Global, continental and local relevance of the problem
The collection of detailed and complete data about floods and hydro-meteorological hazards at regional to continental scales is made difficult because of the need of in-formation of different nature, from a quantitative description of the meteorological settings to the estimates of human and economic losses.
Local authorities and hydrological institutes often collect flood data at basin, re-gional or national scale: a valuable option to create a flood episodes database is the
1.1. HIGH-IMPACT METEOROLOGICAL EVENTS 5
search of newspaper records. As an example, the Swiss Federal Institute for Forest, Snow and Landscape Research has been systematically collecting informations on flood and mass movement damage in a database since 1972, estimated direct finan-cial damage as well as fatalities and injured people have been documented using press articles as the main source of information [5]. This strategy allowed the AVI (Aree Vulnerate Italiane - Italian Areas affected by mass-movements and floods) and SICI (Sistema Informativo Catastrofi Idrogeologiche - Information System on Hydrogeological Catastrophes) Italian Projects [6] to create a database on flood and landslide in Italy from 1918 onwards, and similar efforts are carried on for Catalonia (Spain) to record local flood episodes since 1982 [7]. Moreover, the press, and more generally mass-media, can play a relevant role in increase the population readiness to the hazard and significantly influence how the population and the government view, perceive, and respond to hazards and disasters [8].
A further source of information for flood episodes are records of insurance compa-nies, that usually collects data for internal purposes. Porc´u et al. (2003) [9] used at European scale the data of the reinsurance company Munich RE to create a short term climatology of flood episodes: the Munich RE archive was searched for rele-vant damages and meteorological archives (of both conventional and satellite data) to complete the classification of flood episodes. At smaller scale, Llasat et al. (2008) [8] used the record of the Consorcio de Compensacion de Seguros, a Spanish insur-ance company, to evaluate damages produced by floods in Catalonia and to evaluate the trend.
The Munich RE Natural Catastrophes archive (MRNatCat) issues periodical re-ports with some statistics about natural catastrophes occurrence and distribution. In fig.1.1 are shown the number of natural catastrophes recorded from 1980 to 2010 in the world, distributed in four categories: geophysical (earthquakes and volcano eruptions) in red, meteorological (storms, wind, hail) in green, hydrological (floods and landslides) in blue and climatological (heat waves, droughts, wildfires) in or-ange.
Meteorological and hydrological events represent the large majority of the catas-trophic events in the considered decades and, while earthquakes and climatological catastrophes account for the largest number of human losses (75% of total casual-ties), meteorological and hydrological events causes the 62% of the total estimated losses (2500 billions of US$) [10].
Figure 1.1: Number of significant natural catastrophes over the world from 1980 to 2010. Red bars indicate geophysical events, blue bars indicate hydrological events, green bars indicate meteorological events, and orange bars indicate climatological events. See text for definitions.
A deeper analysis of the he MRCatNat archive shows that hydro-meteorological hazards in Europe are characterized by elevated economic losses and limited number of fatalities if compared with events occurred in Asia or Southern and Central Amer-ica. In 2009-2010 considering the most catastrophic hydro-meteorological events, in Europe were estimated economic losses for 16800 millions of US$ and were recorded 109 fatalities. For the same period, in Asia the economic losses were less than the double as in Europe (27875 millions of US$), but the number of fatalities was as high as 5902. This indicates that in Europe the hydro-meteorological catastrophes prevention and mitigation strategies developed in the latest decades are effective in protecting population but the areas most prone to frequent severe episodes are among the economic heartlands of the European Union, rich in assets and produc-tive capacity, and difficult to defend effecproduc-tively.
Considering the decade 1987-1996, out of the events reported in MRNatCat archive, Porc´u et al (2003) [9] estimated damages for about 27000 millions of US$, and 974
1.1. HIGH-IMPACT METEOROLOGICAL EVENTS 7
fatalities in Europe due to hydro-meteorological events. From a rough comparison with 2009-2010 figures reported above, it seems that the overall number of fatalities has decreased for a factor of 2, while the economic losses has increased of a factor of 3. The spatial distribution of catastrophic events in the 1987-1996 decade re-ported in fig.1.2, points out that a number of European areas are particularly prone to hydro-meteorological catastrophes: Mediterranean coasts of Spain, France and Italy, Alpine region, Po Valley in Italy and Central Germany collect a large part of the total number of events occurred in Europe.
Figure 1.2: Spatial distribution events with recorded damages in Europe in the decade 1987-1996. Crosses indicate events with human and economic losses reported; asterisks indicate only economic losses [9].
Italy is one of the European regions most exposed to hydro-meteorological haz-ards. From the meteorological point of view, the surrounding sea provide a source of moist and unstable air, that in warm month is likely to form convective clouds, while autumn is dominated by cyclonic systems with frontal development, that usu-ally lead to long lasting precipitation [11]. On the other side, the peculiar geomor-phology of the Italian Peninsula is favorable to the triggering and enhancement of
precipitation episodes, given the presence of steep reliefs close to the coasts (such as in Liguria, Toscana, Campania and Calabria), the Alps [12][13][14][15] and the general short hydrological response time of the drainage basins. Moreover, the risk is also strongly influenced by human activities: increasing population density, illegal building practices, continuous deforestation, use of farming methods with little re-spect for the environment and failure to keep the hill and mountain sides and water courses in safe condition, have certainly increased the vulnerability and evidenced the fragility of the Italian territory to a greater degree.
A basic study to understand the relevance of the problem in Italy resulted in the implementation of AVI archive, that collected the Italian areas affected by mass-movements and floods since 1918 [16], and the follow-on project SICI [6]. The AVI Project, based on newspaper records, collected more than 15000 landslide and flood episodes in Italy until 1994, and the SICI continued the archive, adding also more detailed informations coming from other datasets. The SICI archive is online at the website sici.irpi.cnr.it and can be freely accessed to compile plots and maps. As an example, the occurrence maps for Italy for floods and landslides are reported from Guzzetti and Tonelli (2004) [6] in fig. 1.3a and 1.3b, respectively.
These maps confirm the presence of the already mentioned high-risk areas: coastal areas, Central Italy Apennines, different sectors of the Alpine chain, Po Valley, Calabria. The ”patchy” pattern of flood-prone areas in Italy has been more deeply addressed by Salvati et al. (2010) [17] evaluating at the regional scale the societal risk, defined as the relationship between frequency and the number of people suffering from a specified level of harm in a given population from the realization of specified hazards. The geographical distribution of sites where landslides and floods have caused direct damage to the population shows that harmful landslide and flood events are not distributed homogeneously in Italy. To rank the 20 Italian Regions on their societal landslide and flood risk levels, the frequency of the harmful events versus the intensity of the events are computed, revealing that societal landslide risk in Italy is highest in Trentino-Alto Adige and Campania Regions and lowest in the Emilia-Romagna Region, and that societal flood risk is largest in the Piemonte and in Sicilia Regions, and lowest in the Umbria and Basilicata Regions.
Given the impact of meteo-hydrological hazards on the European Countries, The European Union funded in the last decades a number of research and application Projects and Programmes aiming to an improvement of the risk mitigation strategies
1.1. HIGH-IMPACT METEOROLOGICAL EVENTS 9
Figure 1.3: Density of landslide (A) and flood (B) events sampled on a 10×10 km2
in the continent. In the next section an overview of these efforts is presented.
1.1.2
Research activities in Europe
European research focused on flood and hydro-meteorological risk since early ’80s, financing under Framework Programmes a number of Projects addressing different aspects of the risk mitigation strategy. In tab.1.1, a list of EU-funded Projects is reported from the newest to the oldest, attesting these activities: project full name, acronym, total project costs and end year are reported. In the third column is also shown the main focus of the Project in terms of Meteorological (Me) or hydrological (H) aspects, management (Ma) and social (S) issues. Projects with focus on Me and H developed or optimized meteorological and/or hydrological models, respectively, for flood simulation, and/or worked on data analysis for flood study and monitoring. Project labeled with Ma deals with the study of optimal risk reduction strategies, risk management, and often the hydro-meteorological risk is treated as part of a more general risk ensemble, including earthquake, fires, volcanism, drought and others. Projects labeled with S focus on the social aspects, including economical effects and populations reactions and post event organization by civil protection agencies. Other type of projects, dealing with aspects such as the broad impact of floods on ecosystems or on urban structures are not included in this list. After a total cost of more than 56 millions of euro, several achievements have been reached and some example, relevant for this thesis work, will be discussed below.
Table 1.1: EU-founded projects of risk mitigation.
Full project name Acronym Focus Cost
Me
End
Organizing disaster OD S 1.18 2014
Improving preparedness and risk management for flash floods and debris flow events
IMPRINTS Ma, S 3.28 2012
1.1. HIGH-IMPACT METEOROLOGICAL EVENTS 11
Table 1.1: . . . continued from previous page
Full project name Acronym Focus Cost
Me
End
Integrated advanced distributed system for hydro-meteorological monitoring and forecasting us-ing low-cost high-performance X-band mini-radar and cellular net-work infrastructures
HYDRORAD Me, H 1.44 2011
Observations, Analysis and Mod-eling of Lightning Activity in Thunderstorms, for use in Short Term Forecasting of Flash Floods
FLASH Me 1.64 2010
Hydrometeorological data re-sources and technologies for effective flash flood forecasting
HYDRATE H, Ma 3.42 2010
Integrated flood risk analysis and management methodologies
FLOODSITE Ma, S 14.02 2009
Flood and drought risk assess-ment tools using modeling and Earth observation for early warn-ing systems in the Nile basin
FATE-EWS-NILE
H, Ma, S
1.7 2008
Earthquakes, tsunamis and land-slides in the Corinth rift, Greece A multidisciplinary approach for measuring, modeling, and pre-dicting their triggering mode and their effects
3HAZ-CORINTH
Ma 2.01 2007
Mediterranean grid of multi-risk data and models
MEDIGRID Ma 1.36 2006
Achieving technological innova-tion in flood forecasting
ACTIF Me, H,
Ma
0.27 2006
Table 1.1: . . . continued from previous page
Full project name Acronym Focus Cost
Me
End
Real-time flood decision support system integrating hydrological, meteorological and radar tech-nologies
FLOODRELIEF Me, H, Ma
2.5 2006
Near real-time flood forecasting, warning and management system based on satellite radar images, hydrological and hydraulic mod-els and in-situ data
FLOODMAN Me, H 3.35 2006
Towards natural flood reduction strategies
ECOFLOOD H 0.35 2005
Multi-sensor precipitation mea-surements integration, calibra-tion and flood forecasting
MUSIC Me, H 1.9 2004
Investigation of extreme flood processes and uncertainty
IMPACT H 2.6 2004
Decision support system for Risk Assessment and Management of FLOODs
RAMFLOOD H, Ma 1.8 2004
Earth Observation Linking SMES To face real time natural disaster management
EOLES S, Ma 1.8 2004
Mitigation of climate induced natural hazards
MITCH H, Ma 0.198 2003
European satellite rainfall analy-sis and monitoring at the geosta-tionary scale
EURAINSAT Me 2.43 2003
An European flood forecasting system
EFFS Me, H 3.05 2003
1.1. HIGH-IMPACT METEOROLOGICAL EVENTS 13
Table 1.1: . . . continued from previous page
Full project name Acronym Focus Cost
Me
End
Systematic, palaeoflood and his-torical data for the improvement of flood risk estimation
SPHERE H 1.52 2003
Cluster Initiative for Flood and Fire emergencies
CLIFF Ma 0.15 2002
Data Fusion for Flood Analysis and Decision Support
ANFAS Ma 3.8 2002
Runoff and atmospheric processes for flood hazard forecasting and control
RAPHAEL Me, H 2000
Satellite and combined satellite-radar techniques in meteorologi-cal forecasting for flood events
MEFFE Me 1999
River Basin Modeling, Manage-ment and Flood Mitigation
RIBAMOD H 1999
The development of active on-Line hydrological and meteoro-logical models to minimize im-pact of flooding
HYDROMET H, Me,
Ma
1999
Heavy precipitation in the alpine area
HERA Me 1999
Storms, Floods and Radar Hy-drology
H, Me 1995
Flood hazard control by multisen-sors storm tracking in Mediter-ranean areas
Me 1994
A comprehensive forecasting sys-tem for flood risk mitigation and control
APHORISM H 1994
Table 1.1: . . . continued from previous page
Full project name Acronym Focus Cost
Me
End
Flood hazard assessment Me, H 1994
Weather radar and storm and flood hazard
Me, H 1992
European Flood Study 1983
Table 1.1: . . . concluded from previous page
A first task of many Project was to make an inventory of the past flood events over different regions of interest, to increase the knowledge of the event itself and to assess its relevance on the local environment and human activities. As an ex-ample, one of the outcome of the project MEFFE, funded under FP4 [18], was to collect flood events over Europe to propose a classification scheme for a European-level flood database, in which severe flood episodes were related to meteorological conditions and mesoscale settings [9]. It was clear that extratropical cyclones are the most common meteorological phenomena related to flood episodes and any at-tempt to improve meteorological forecast of floods should include better knowledge of extra-tropical cyclones and, thus, better modeling capabilities. These tasks have been pursued by a number of FP funded projects listed in tab.1.1 (HYDROMET, HERA, among others) and also projects funded by other organizations, such as The Observing System Research and Predictability Experiment (THORPEX) [19], funded by WMO.
A number of Project aimed to provide better estimation (or measure) of the precip-itation intensity at different scales, especially using remote sensor such as weather radar and radiometers on earth orbiting platforms. Quantitative Precipitation Es-timates (QPE) from ground weather radar, due to the large spatial coverage, the high resolution and the availability in real time, provides reliable data for spatially detailed hydrological simulations [20][21]. However, the set up an effective ground radar network for QPE could be difficult and costly in case of complex terrain [22][23][24], and often the QPE has large uncertainties that can impact on both hy-drological modeling results and hyhy-drological model parameter estimates [25]. Radar
1.1. HIGH-IMPACT METEOROLOGICAL EVENTS 15
operational activity in Europe are harmonized under the Operational Programme for the Exchange of weather RAdar information (OPERA 3) a joint effort of the European Network of National Weather Services (EUMETNET). The main tasks of this long lasting Project (OPERA 1 has started in 1999) are: to maintain an inventory on European weather radars, their characteristics, their data, and prod-ucts derived from them and to foster the exchange and harmonization of weather radar data and products throughout Europe and to maintain the Odissey data cen-ter [26][27].
European Commission coordinated cooperation on radar meteorology also by means of COST Actions: COST (European Cooperation in Science and Technology) is one of the longest-running European instruments supporting cooperation among scien-tists and researchers across Europe. In particular, COST Actions 72 and 73 estab-lished first cooperation protocols among member states on radar operational uses and networking [28]. More recently COST Action 717 examined and defined the re-quirements on European radar data for their use in Numerical Weather Prediction (NWP) and hydrological models, and, in order to increase the level of management of river flow in rural and urban catchments, brought together radar engineers, me-teorologists and hydrologists. They initiated a European-wide action to homogenize procedures related to radar data [21]. This effort continues beyond the duration of the Action in the above mentioned EUMETNET‘s OPERA initiative. COST Action 731, focused more on the quality and uncertainty of meteorological obser-vations, along with their impacts on hydro-meteorological outputs from advanced forecast systems. The Action also made a major contribution to the genesis of se-ries of European Conferences on Radar Meteorology, which became one of the main channels of the dissemination of the results [29].
A space view of rainfall pattern and intensity can be obtained by satellite rainfall estimation techniques. Among the first efforts to the use of satellite data it has to be mentioned the FP4 Project MEFFE [18], that used combination of satellite (both microwave and visible-infrared spectra) and detailed ground radar observa-tion to optimize the accuracy of instantaneous rainfall maps. Significant results were reached in studying the clouds and precipitation structures of cyclonic devel-opment [30][31][32][18], in proposing new nowcasting-oriented, satellite estimation techniques [33][34] and multi-sensor studies on severe convective systems [35][32][36]. Moreover, an attempt was made to introduce satellite rainfall maps as direct input
in hydrological models [37].
The FP5 Project EURAINSAT focused on the satellite precipitation retrieval tech-niques development and assessment, exploiting the new capabilities of multispectral satellite sensors, cloud resolving numerical models and weather radar [38]. A large part of the results are collected in the book Measuring Precipitation from Space: Eurainsat and the Future [39]. The main tasks of the Project were: 1) contribute to improving the knowledge of clouds and precipitation formation processes using meteorological satellite sensors, and 2) make available new precipitation products for weather analysis and forecasting. The first task has been accomplished by study-ing the impact of aerosols in determinstudy-ing the structure of convective clouds [40][41], and the relationship between lightning cloud activity and convection for the discrim-ination of convective and stratiform regimes [42]. As for the second task, several approaches have been pursued, publishing a number of new techniques based on microwave data or on combination of data from different platforms [43][32][44][45]. The European Commission funded projects related to the prevention and mitigation of hydro-meteorological hazards also under the Interreg programmes (now in the IV stage) designed to promote the cooperations among European Regions, financed by the European Fund for Region Developing. In particular, Interreg III funded the Risk Advanced Weather forecast system to Advise on Risk Events and Management (Risk-Aware) with two general objectives: the prevention of geo-hydrological natural disaster at regional, national and trans-national level forced by meteorological sit-uation, and the design and implementation of regional, national and trans-national programmes for geo-hydrological hazards assessment and risk management. A part of the efforts under Risk-Aware aimed to increase the knowledge of precipitating sys-tems by means of new multi-sensor techniques [46] based on polarimetric radar and multispectral satellite observation to infer internal structure of relevant precipitat-ing cloud systems. New techniques were also introduced to improve the quantitative precipitation estimates from weather radar [47] and satellite data [48][49], and also to optimize the use of raingauges data [50]. More oriented to operational activities, Verdecchia et al. (2008)[51] introduced a flood forecasting platform that uses based on coupled mesoscale atmospheric and a newly developed distributed hydrological model with in-situ and remote sensing data integration. The focus is on small-catchment flood forecast in complex topography in Central Italy, with emphasis on the integration of numerical models and retrieval algorithms with aim to provide
1.1. HIGH-IMPACT METEOROLOGICAL EVENTS 17
an overview of an objective system for hydro-meteorological alert-map emission. A fully model-based approach has been proposed by Diomede et al. (2008)[52], based on a hydrological ensemble forecasting approach that uses multiple precipitation scenarios provided by different high-resolution NWP models, driving the same hy-drological model. In this way, the uncertainty associated with the meteorological forecasts can propagate into the hydrological models and be used in warnings and decision making procedures relying upon a probabilistic approach. A strategy based on geostationary satellite, weather radar and lightning network data, has been intro-duced by Tafferner et al. (2008)[53] to track the development of deep convection in Central Europe for nowcasting purposes. The same objective has also been pursued by Zinner et al. (2008)[54] only relaying on Meteosat 7 SEVIRI 6.2 µm and 10.8 µm channels data and tropopause temperature obtained from ECMWF analysis. Under Interreg III has been also funded the Project Weather Risk Reduction in the Central and Eastern Mediterranean (RISKMED) with the aim to create an Early Warning System (EWS) for the eastern Mediterranean [55]. A further Inter-reg III funded project was HYDROPTIMET, with the main goal to improve of the knowledge of severe events phenomena, the optimization of the meteorological and hydrological aspects for the prevention of natural hazards, the experimentation of new tools (such as numerical models) to be used operationally for the Quantitative Precipitation Forecast (QPF) and the improvement of the collaboration between the partners (exchange of data, methodologies, information). The territory affected by the activities of the project includes the following regions: the Italian side of the western part of the Alps, subject to severe events and to strong vulnerability due to the complex orography; the regions along the Apennines and some region of South Italy, where the interaction with the sea is more pronounced; the northeast part of Spain, where severe events are less frequent, but produce intense damages due to the vicinity of the sea with the mountains; the south-eastern France is also prone to heavy precipitating events, specially during fall. The results of the project after the three years of activity, can be subdivided into four main categories [56]: gen-eral description of the test cases, results of the meteorological applications, meteo-hydrological chain, and connection with the end-users.
To complete the overview of the European coordinated efforts for the mitigation of meteo-hydrological risks it has to be mentioned the set up in 2005 of the Satellite Application Facility on Support to Operational Hydrology and Water Management
(H-SAF), funded by the European Agency for the Exploitation of Meteorological Satellites (EUMETSAT) in the frame of the European network of Satellite Appli-cation Facilities. The aim of this effort (expected to end in 2015) is to provide new satellite-derived products from existing and future satellites with sufficient time and space resolution to satisfy the needs of operational hydrology. In particular, Eu-ropean users will benefit of the following identified products: precipitation (liquid, solid, rate, accumulated); soil moisture (at large-scale, at local-scale, at surface, in the roots region); snow parameters (detection, cover, melting conditions, water equivalent); Moreover, H-SAF performs independent validation of the usefulness of the new products for fighting against floods, landslides, avalanches, and evaluating water resources. These activity includes: downscaling/upscaling modeling from ob-served/predicted fields to basin level; fusion of satellite-derived measurements with data from radar and rain-gauge networks; assimilation of satellite-derived products in hydrological models; assessment of the impact of the new satellite-derived prod-ucts on hydrological applications.
1.2
The research in Italy and the PROSA System
Italian researchers are very active in the European and global efforts to mitigate nat-ural risks, participating in most of the initiatives outlined in the previous section. Nevertheless, significant activities are carried on since 80s funded and coordinated by Italian Ministries and Governmental Institutions devoted to develop and make applicable techniques on the Italian territory. First activities were gathered under the National Group for Hydro-Geological Disaster Prevention (Gruppo Nazionale per la Difesa dalle Catastrofi Idrogeologiche, GNDCI), a research network of the Italian National Research Council (CNR). The group is composed of research orga-nizations from Universities, from State Administration, and from private and public organizations. Since 1986, the GNDCI has been the operating group of the Italian Civil Protection Department (Dipartimento della Protezione Civile, DPC) for issues related to hydro-geological disasters, with the following main tasks:
Coordination of interdisciplinary activities to improve the scientific knowledge in the fields of civil defense against flood, landslides, aquifer deterioration and coastal erosion;
1.2. THE RESEARCH IN ITALY AND THE PROSA SYSTEM 19
Provision of scientific and technical consulting in the field of hydro-geological risk, to the national, regional and local authorities, with particular attention to the civil protection authorities;
Management of the scientific community in support to the hydro-geological disasters mitigation activities of the Italian Civil Protection Department. In parallel, the Italian Space Agency (ASI) started financing national earth ob-servation programs with focus on precipitation systems. The project ’Hydrological Cycle from Satellite: Clouds and Precipitation’ lasted for 5 years (1995-2000) to work on case studies of severe events over Italy using combined infrared-passive microwave techniques [57]. As a follow on project, in 2001 MeditRain (Use of newly-available advanced space-borne instruments for prototype generation of precipitation infor-mation over the Mediterranean area) has been funded by ASI for 2 years to continue on satellite estimation techniques development.
The 2003-2005 National Space Plan of ASI assumed as main mission of the Earth Observation branch the improvement of the capability of prevention natural disas-ters in Italy by means of satellite products. To set up the research structure and to identify potential users, the Pilot Project LAMPOS (Lotta alle Alluvioni Mediante Prodotti di Osservazione Satellitare - Flood mitigation by means of satellite obser-vations) was funded and completed the preliminary study, suggesting the guidelines for the implementation of a National Project to provide operational satellite tools for the prevention of meteo-hydrological catastrophes.
The Project PROSA (Prodotti di Osservazione Satellitare per l’Allerta Meteorolog-ica - Satellite products for meteorologMeteorolog-ical alert) started in 2007 to: design, develop, test and demonstrate a prototype system dedicated to the innovative dynamic char-acterization of meteorological parameters at the ground. This project will be illus-trated in detail in the next section.
1.2.1
The PROSA structure
PROSA is based on combined use of EO satellites data, ”in situ” data and tradi-tional technologies. PROSA is aimed at supporting the Italian DPC in managing the risks associated with floods and hydro-geological hazardous events. The project,
started on October 2007 is managed by Carlo Gavazzi Space SpA whereas the sci-entific coordination is carried out by CNR-ISAC Bologna (Prof. Franco Prodi). PROSA system had been developed in three years time; three incremental versions of PROSA had been developed, along with the gradual integration in the system of the technical innovations coming from research activities of the scientific institutes (CNR-ISAC, CNR-IFAC and CETEMPS) and universities (University of Rome ”La Sapienza”, University of Ferrara and Politecnico di Bari). PROSA system had been developed in collaboration with ASI and the institutional end-user, the Italian DPC. The PROSA system can be divided into three main sub-systems: 1) instantaneous and cumulate precipitation estimate and observation; 2) numerical weather predic-tions; 3) surface products (snow parameters and soil moisture). A scheme of the whole system is shown in fig.1.4
PROSA is a prototype system developed to be used in a demonstration mode and de-signed to receive near-real-time data from satellite sensors (SSM/I, SSMI/S, AMSR-E, AMSU-A, AMSU-B, MHS in the MW band, MSG in VIS-IR bands, that will be introduced in the next chapter) and LINET data for lightening. Algorithms based on MSG data can produce final products every 15 minutes, just some minutes after the availability of data. MW algorithms, instead, are usually intermediate products, used in others algorithms as calibrating data. This type of products, depending on sun-synchronous satellite, can be available just in presence of a satellite track passing on the target area. The project had been developed in three years time span with 41 products available for operational application as part of the PROSA operational chain. Many of these products are different versions of the same algorithm, released in three versions during the project.
1.2.2
PROSA Products
Before entering in the detail of Ferrara University work-packages, we want to men-tion the different algorithms developed for PROSA. They are 20 EPP products (Precipitation Products Elaboration), 11 EMN products (Elaboration of Numerical Modeling prediction products) and 10 EPS products (Surface Products Elabora-tion).
1.2. THE RESEARCH IN ITALY AND THE PROSA SYSTEM 21
1.2.2.1 PROSA Precipitation Products
The PROSA structure provides several precipitation products, obtained with differ-ent techniques and satellite data in order to provide the uses a wide range of possible options to have precipitation maps [58]. The validation program undertaken under PROSA and the operational use of the different products is expected to give a trade-off of potential and drawbacks of each technique, and to drive the user to choose the more suitable product to describe at best the current weather situation. The tech-niques used in PROSA will be briefly described below. The EPP MULS technique, developed within this PhD thesis work will be only briefly introduced because it will be the subject of chapter ??.
Instantaneous precipitation estimates by PMW conical scanning radiome-ters This technique provides ground instantaneous precipitation (in mm h−1)
ob-served in the MW (Microwave) band (with liquid or solid phase flag) from SSM/I (Special Sensor Microwave/Imager) - SSMI/S (Special Sensor Microwave Imager/-Sounder) sensors [59][60][61]. The algorithm uses as input the TB of PMW channels and a Digital Terrain Model (DTM). The first part of the algorithm, that works of-fline, aims to solve the direct problem: a database is constructed (Cloud Dynamics and Radiation Database CDRD) where the TBs as would be measured by a satellite sensor are associated with synthetic cloud structures generated by a Cloud Resolving Model (CRM). In the CDRD each cloud microphysical vertical profile is associated the set of simulated TBs, the terrain structure, the dynamic and thermodynamic characteristics, and the lightning activity as measured by the LIghtning NETwork (LINET). The second part solves the inverse problem, computing the actual rain-rate. For each satellite Instantaneous Field of View (IFOV), the CDRD is searched to find the set of simulated TBs that are closes, in terms of Bayesian analysis, to the set of actual TBs, as measured by the sensor. The precipitation rate is assigned to the IFOV as computed from the assigned cloud profile microphysical characteristics. The CDRD includes 23 different simulations (with about 106 cloud profiles) carried
on by the University of Wisconsin Nonhydrostatic Modeling System (UW-NMS, Tripoli, 1992), on precipitation events occurred in the Mediterranean area, focusing on heavy precipitation cloud systems. Finally, a screening procedure is adopted in a
1.2. THE RESEARCH IN ITALY AND THE PROSA SYSTEM 23
data pre-processing phase, to separately consider coastal IFOV, where the retrieval is made difficult by the different emissivity of land and sea. The algorithm applies on data from conical scanners, such as SSM/I, SSMIS on board the Low Earth Orbit (LEO) satellites of the US Defense Meteorological Satellite Program (DMSP), and the Advanced Microwave Scanning Radiometer for EOS (AMSR-E) on board the Earth Observing System (EOS) Aqua LEO spacecraft. Specific CDRDs are needed for the different sensors, since the number and the central frequency of the chan-nels varies, and the radiative transfer simulations have to be performed accordingly. These algorithms are used to retrieve the products labeled EPPn PI-A (for SSM/I and SSMIS) and EPPn PI-B (for AMSR-E), where n indicates the number of the product release in the PROSA system. Precipitation maps are delivered from 4 to 8 times/day (depending on the LEO satellite overpasses) at a ground resolution of 12×12 km2 over Italy.
Instantaneous precipitation estimates by PMW cross-track scanning ra-diometers This algorithm computes instantaneous precipitation rates by means of data from the PMW cross-track scanning sensors Advanced Microwave Sounding Unit (AMSU), on LEO satellites NOAA, EOS-Aqua, MetOp, and Microwave Hu-midity Sounder (MHS) on MetOp and NOAA [62].
The first phase of the algorithm aims to reduce the IFOVs of the different channels (ranging from 16 to 52 km at nadir) at the same resolution, the one of the final product, i.e. 16 km at nadir; moreover, in this phase a correction for the slant path of the radiation through the atmosphere in case of larger viewing angle (the so called limb broadening effect). In the second phase, a screening is applied to the TBs, in order to eliminate contaminate IFOV, for example due to snow at the ground. In the third phase the retrieval of precipitation rate at the ground is performed, by an Artificial Neural Network (ANN) algorithm. The training of the ANN has been performed on a supervised dataset using 38 NOAA15 orbits and the corresponding precipitation data as computed by the US weather radar network NEXRAD. Input data to the ANN are for each valid IFOV: the actual sensor scanning angle, 3 TBs in the water vapor absorption band, the first 3 principal components of the TBs in the oxygen absorption band and the first 2 principal components of the TBs in the window channels. The Principal Component Analysis has been applied in parallel to the ANN training aiming to select the TBs with more information related to the
precipitation layers.
This product is labeled EPP1 PI-C in the PROSA system, and it is delivered in real time just 30 minutes after the reception of the satellite data. The has a ground resolution at nadir of 16 km, to be intended as the diameter of the circular IFOV, that become elliptical and larger close to the edge of the swath (ellipsis axes around 23 and 52 for the last IFOV in the swath). The product is available depending on the satellite orbits and availability, from 4 to 8 times a day.
Finally, it has to be mentioned that this EPP1 PI-C is the only PMW product available in near real time, and thus it is used as input for other PROSA products. Multi sensor precipitation estimates from VIS-IR and PMW data The products of these algorithms are labeled by the PROSA system as EPPn PI-MULS. Three version of the ANN-based algorithm are released: the first algorithm computes the probability of precipitation from geostationary satellite Visual-Near Infrared-Infrared (VIS-NIR-IR) data, the second one computes precipitation rates divided in 5 intensity classes, using VIS-NIR-IR data, the last makes use of PWM (Passive Microwave) precipitation products combined to VIS-IR-NIR data and the output is given as rain-rate in mm h−1.
Since the development and implementation of this algorithms is the main subject of this PhD Thesis, they will be described in details in chapter ??.
Precipitation estimate by means of a blended technique This algorithm makes a synergistic use of satellite IR and PMW data to retrieve instantaneous pre-cipitation rate. It is based on the Naval Research Laboratory Technique (NRLT) [45] and uses co-located SEVIRI IR TB (at 10.8 µm) and rain-rate from PMW algo-rithm (in this case EPP1 PI-C product). Statistical relationships between TB and rain-rate are created based on the dataset, and updated every time a PMW sen-sor overpasses the region of interest. The matching is performed on wide boxes of 2.5×2.5 degrees. The SEVIRI images preprocessing includes a screening to exclude certainly non precipitating pixel based on thresholds applied to different SEVIRI channels: considered channels are: 0.65 µm (during daytime to screen out thin clouds, 1.6 µm (during daytime to screen out snow at the ground), 3.9 µm (to screen out partially cloudy pixels), while 6.2 µm and 12.0 µm are used in
combina-1.2. THE RESEARCH IN ITALY AND THE PROSA SYSTEM 25
tion to flag overshooting top of convective clouds. The products is at the resolution of SEVIR sensor, i.e. 3.5×4.5 km2 over Italy.
The 15-minutes output of this algorithm is also used to construct cumulated precip-itation products (labeled EPP3 PC-BLE) at 3, 6, 12 and 24 hours.
Precipitation estimates by hybrid techniques This technique aims to pro-vide a forward extrapolation of the rainfall fields produced by other algorithms of the PROSA system. In particular, SEVIRI images and the EPP2 PI-BLE product are entered as input, and the algorithm provides the precipitation map for one hour later.
The approach used here is the Steady State Displacement [63]: two successive SE-VIRI IR images are processed and the displacement of the cloud entities in the images is computed as motion vector. Given the short time lag between SEVIRI images (15 minutes), it is assumed that the image characteristics and cloud shapes do not change significantly: the nowcasted image will be the last received image, translated accordingly to the computed motion vector. The motion vector is com-puted by a cross-correlation algorithm between subsequent SEVIRI images.
This product is labeled and EPPn PI-IBR in the PROSA system, has the same ground resolution of SEVIRI (around 3.5×3.5 km2 over Italy) and it is delivered for
Italy and surrounding area every 15 minutes.
Instantaneous and cumulated precipitation estimates by means of a mor-phing algorithm The mormor-phing algorithm is derived from the CPC MORPHing (CMORPH) technique developed for global precipitation estimates [64] and it is tailored for Italian region for the PROSA system, and new features are also added. The technique ingests the last PMW precipitation product (in this system EPP1 PI-C product is used), and the nearly simultaneous IR SEVIRI TB image (at time t0),
and the rain-rate is re-sampled over the IR TB image, identifying in the IR image the precipitating areas (as defined by the PWM algorithm) by a pattern matching technique. At time t0+15 min a new IR image is available, and the rain areas are
searched on this image, by means of a cross correlation algorithm, and new precip-itating areas are identified in the t0+15min image by translation and deformation
the new areas and the estimate at time t0+15min is produced. This procedure goes
on iteratively at every 15 min step, for each new SEVIRI TB map, until a new PMW precipitation map becomes available, and the procedure starts from the beginning.
1.2.2.2 PROSA soil products
The final design of PROSA structure includes the delivery of six soil products derived from satellite observations. These products are listed below.
Low resolution soil moisture content (bare and vegetated soil) This prod-uct is derived by AMSR-E data at 6.9 GHz. The algorithm is based on an ANN procedure trained with archive data: it takes as input TB6.9V (sensitive to soil mois-ture), polarization indices at 10.65 and 18.7 GHz (sensitive to vegetation coverage) and TB36.5 to estimate the soil temperature. The output is given as percentage on a 30×30 km2 grid on a daily basis.
High resolution soil moisture (bare and vegetated soil) This product is derived by SAR (PALSAR on board ALOS and ASAR on ENVISAT) data and it based on a Bayesian inversion technique. Optical data and land use maps are also used to classify the land cover (bare/vegetated). The output is as percentage of water over dry soil in the surface layer, it is delivered on a grid of 100×100 m2, and
can be obtained over regional scale areas. The revisiting time spans between 15 to 35 days, depending on SAR data availability.
Medium resolution snow water equivalent and snow cover The algorithm works on ENVISAT-ASAR data and optical data from the SPOT4 satellite. It is based on neural networks, the output is on a 500×500 m2 grid, and the revisiting
time is between 15 to 35 days.
Medium resolution snow surface condition (wet/dry) This algorithm uses ENVISAT-ASAR data and classify the areas as wet snow/dry on a grid 500×500 m2 over small areas. The revisiting time is between 15 to 35 days.
Low resolution snow water equivalent This product is derived by AMSR-E data at 10.65, 18.7 and 36.5 GHz by means an ANN algorithm trained on archive
1.2. THE RESEARCH IN ITALY AND THE PROSA SYSTEM 27
data and validated on field campaigns over basin-scale target areas. The output is delivered daily on a 20×20 km2 grid, as meters of water.
High resolution snow water equivalent and snow cover The algorithm works on SAR data (ALOS-PALSAR, ENVISAT-ASAR, COSMO-SkyMed-X-SAR) and optical satellite data (SPOT4). Provides snow water equivalent in meters of water and a flag for wet snow. The output is available on a regional scale over a grid with variable (depending on the sensor used) between 100 and 200 m. The revisiting time is between 15 and 35 day.
1.2.2.3 PROSA Numerical Weather Prediction products
In addition to the remote sensing products, PROSA provides also NWP products, despite they are usually not considered in nowcasting systems, given the relatively longer leading time of the forecast (12 hours). Two series of products are operatively disseminated, based on two Limited Area Models: BOLAM and MOLOCH.
BOLAM [65][66] is an hydrostatic model and it is designed to operate within PROSA system on a grid of 15×15 km2. The MOLOCH model [67][68] is a non-hydrostatic
model operating at an horizontal resolution of 0.0225×0.0225 degrees (about 2.5 km). The operational chain takes in input low resolution analysis for BOLAM ini-tialization (GFS from NCEP on a 0.5×0.5 degree grid) and geographical data, and starts the BOLAM processing. BOLAM outputs are delivered after post-processing as a medium resolution products, and also are used to initialize MOLOCH that runs nested on the BOLAM outputs. MOLOCH outputs are post-processed and disseminated as high resolution forecasts. Data assimilation of satellite products (EPP2 PI BLE) is performed during the BOLAM runs by means of a nudging scheme [66].
NWP product are: high and medium resolution precipitation rate forecast in mm h−1;
medium resolution convective precipitation forecast; medium and high resolution snow rate forecast in mm h−1; medium and high resolution cumulated precipitation
forecast at 3, 6, 12 and 24 hours in mm; medium and high resolution soil moisture forecast as fraction of water mass respect to dry soil mass in m3m−3; medium and
high resolution snow amount forecast in m of water equivalent. All the products are updated every 12 hours on grids covering whole Italy.
1.2.3
PROSA validation and demonstration activities
Within the PROSA project efforts have been devoted to validate the satellite prod-ucts with respect to independent rainfall measurement, that are assumed as ground truth. Validation of satellite products with other datasets, of different nature, is a thorny issue not yet resolved by the scientific community at any spatial and tempo-ral scale ([69], [70], [71], among others). From one side, the user community needs a detailed knowledge of the error structure of the products to better exploit their capability and get aware of their limitations; from the other side, the algorithm developers claim that validation of satellite products by matching with rainfall data measured by instruments operating with different physical principles. The latter is particularly true when we validate satellite instantaneous, areal integrated rain-rate with time-integrated, point-like rain-gauges measurements.
1.3
Nowcasting systems
Before to describe in a detailed way the algorithm developed for this Thesis, it is useful to introduce few examples of current nowcasting systems developed or in op-erational use, with a particular attention to precipitation retrievals. It is important to stress that nowcasting systems have the relevant role of forecasting meteorological events in the few minutes after the availability of the data: a powerful and rapid computational system is fundamental to deliver products in near-real-time. Also an user-friendly interface is very important to facilitate public users to interpret products and, in case, to quickly disseminate warnings. Nowcasting systems devel-opers made great efforts to take into account all these characteristics and implement complete and rapid systems [3][4].
1.3.1
UK Met Office Nowcasting Systems
1.3.1.1 The Nimrod System
Nimrod is the first operationally used system of the UK Met Office. Developed dur-ing the early 1990s, it integrated nowcastdur-ing techniques with NWP model products to provide forecasts over the UK and surrounding waters up to six hours ahead. With this system it was possible to analyze and forecast the main weather variables,
1.3. NOWCASTING SYSTEMS 29
such as precipitation, clouds and visibility. The visibility and precipitation products were generated on a 5 km grid, while cloud and most of the derived products were produced on a 15 km grid. Cloud and visibility analyses and forecasts were updated hourly, with forecasts generated half-hourly to six hours ahead. The precipitation component, however, used a cycle of 15 minutes with forecasts also generated every 15 minutes. The NWP component used by Nimrod was the Mesoscale Model ver-sion of the Met Office’s Unified Model and its input was updated every 6 hours at present, the new data becoming available about 3 hours after data time.
The system was divided into five major components: observation processing, NWP, data blending, merged forecasts and product generation.
The main source of observation were satellite imagery, radar imagery and surface synoptic reports. Upper air information was obtained indirectly through the NWP assimilation procedure. Satellite imagery was received from both geostationary (Me-teosat) and polar orbiting (NOAA) platforms. Radar imagery were pre-processed at the radar site to calibrate the observed reflectivity, to remove fixed clutter and to re-map to a common 5km grid.
The NWP used a version of Unified Model with a grid spacing of about 17 km for short range forecasting. Forecasts to at least 18 hours ahead were updated four times a day. For data blending two basics algorithms were used. The visibility and precipitation rate analyses used a two-dimensional variational scheme based on a standard descent algorithm, while the cloud analysis used a two-dimensional recur-sive filter algorithm applied to each level.
The forecast procedure consisted of two main steps: computation of an extrapola-tion from recent values or trends and optimal merging of this with other independent forecast estimates [72].
1.3.1.2 The GANDOLF System
A disadvantage of Nimrod’s precipitation forecasting was represented by its lim-ited ability to generate new areas of precipitation. In the short-range prediction of frontal precipitation, the modeling of atmospheric disturbances with time scale of many hours or days is not required, and it is more effective to extrapolate the current weather and its recent trends in such a way to preserve the most significant features. In the nowcasting of showers associated with outbreaks of air mass convection this
sort of approach is much less successful. With this assumption, the Environment Agency requested to develop an operative system to make the Nimrod system more complete.
GANDOLF (Generating Advanced Nowcasts for Deployment in Operational Land-based Flood forecasts) system had been designed to address this problem. Developed in the mid-1990s, this system is able to forecast the development of ’daughter cells’ associated with existing convective cells.
System data inputs were received from various operational and database computer systems at Met.Office HQ. These included near-real time multi-site radar network data with a 5 km spatial resolution and 15 minutes time step and Satellite data from geostationary satellite (Meteosat) sampled every 30 minutes with a spatial res-olution of 5 km in the IR and 2.5 km in the VIS band at the sub satellite point. Mesoscale Model data from Nimrod system were also used for forecast with a 15 km spatial resolution and updated four times daily.
The precipitation model implemented in GANDOLF was the Object-Oriented con-ceptual Model of convection (OOM): it could benefit of 2 km spatial resolution and 10 minutes temporal step. This means that a GANDOLF product could be received within 10 minutes of Data Time. The OOM incorporated a conceptual model of the life cycle of a shower cloud. Five cell growth stages were recognized, among which the developing, mature (young and fully mature), early dissipating and dissipating phases in the life of a convective cloud. Cell stages were distinguished on the basis of vertical rain rate profiles, derived from multi-beam, single-site radar data. The development potential of a cell was determined by comparing the current develop-ment stage with that classified 10 minutes and 20 minutes earlier [73].
The OOM was specifically designed to run during periods of non-frontal air mass convection. On occasions when precipitation was frontal in origin, or was associated with convection embedded in a frontal feature, the life cycle model was not appli-cable. The accurate identification of meteorological conditions suitable for running the OOM was therefore critical to the successful operation of the GANDOLF sys-tem. The main method used operationally for identifying the types of rainfall pixels (convective or non-convective) used a neural network cloud classifier. In the GAN-DOLF system was then implemented a Neural Network Cloud Classifier capable of distinguish four cloud classes. [74].
1.3. NOWCASTING SYSTEMS 31
1.3.1.3 STEPS System
Since 2008, the UK Post-Processing system includes the Short Term Ensemble Prediction System (STEPS). The goal of this algorithm, developed in collabora-tion with the Australian Bureau of Meteorology, is to generate products to replace those previously provided by the Nimrod and Gandolf precipitation nowcasting sys-tems. STEPS is an ensemble-based probabilistic precipitation forecasting scheme that blends an extrapolation nowcast with a downscaled NWP forecast. The use of ensembles allows the scheme to be used for applications that require forecasts of the probability density function of areal and temporal averages of precipitation.
STEPS derives forecast data from two separate sources, radar-based rain analyses and NWP model forecasts. These data are merged with uncertainty estimates, in order to give the right weight to every contribution (extrapolation forecast, NWP model forecast and noise). The output from NWP forecast model is downscaled so that the small scales not represented accurately by the model are injected into the forecast using stochastic noise. As the forecast progresses, the extrapolation com-ponent will become less skillful, especially at the smallest scales. The loss of skill is modeled to allow precipitation features to be smoothed out trough a decreasing in power of the extrapolation forecast cascade. The power lost at the small scales can be replaced by noise. This allows the scheme to better represent the distribu-tion of precipitadistribu-tion rate at spatial scales finer than those adequately resolved by operational NWP. Finally, in order to produce nowcasts with a useful range of at least 6 hours, it is necessary to merge these nowcasts with NWP forecasts. This merging will allow the resultant precipitation nowcasts to reflect the influence of the large-scale dynamical evolution of the atmosphere on the precipitation field [75].
1.3.2
The TAMORA algorithm
A multi-spectral rainfall estimation algorithm has been developed for the Sahel re-gion of West Africa with the purpose of producing accumulated rainfall estimates for drought monitoring and food security. Several Satellite-based techniques have been designed for rainfall estimation over Africa, including TAMSAT [76], an algorithm using only a single IR channel from the SEVIRI instrument on board MSG. After that work, much work has been done on utilizing multiple channel data from SEVIRI
and other similar instruments for cloud classification and rainfall identification. The starting point is the UK Met Office SatPrecip algorithm which uses a real-time radar calibration to produce rainfall estimates over Europe and the North Atlantic. This algorithm, reconfigured and recalibrated to take account of West-African con-ditions, is named TAMORA (TAMSAT, Met Office Rainfall for Africa) algorithm. The most useful combinations of SEVIRI channels for rainfall identification used in both UK Met Office SatPrecip and TAMORA algorithms are the 0.8, 1.6, 3.9 and 10.8 µm channels during daytime and the 3.9, 10.8 and 12.0 µm channels at night. The data from each SEVIRI channel are binned into a number of discrete classes and combining these multi-channel binned data into a contingency table, a number of satellite pixel data classes are obtained. Taking the radar data as ”truth”, coin-cident radar and satellite pixels are compared and a probability of rainfall for each satellite data class is computed. This process is performed for each rain-rate thresh-old used by the algorithm, and in this case ”probability of rainfall” is the probability of a rain-rate greater than the rain-rate threshold. The probability threshold is cho-sen for each rain-rate by the ”minimum percent” method, whereby the difference between the number of observed and diagnosed rainy pixels is minimized by an it-erative procedure.
The differences between SatPrecip and TAMORA start with a different calibration of the two algorithms, the first from the Uk and European networks and the latter from Niamey (Niger) radar. As well as using different calibration data, several other changes are made in order to optimize TAMORA for use in Africa. The relationship between SEVIRI brightness temperature/reflectance and probability of rainfall vary greatly between European and Niamey data, so binning of radiances in the con-tingency tables is altered increasing bin resolution for areas where the probability of rainfall is relatively high for Niamey. An other big difference between the two algorithms is in the long timescale accumulation: SatPrecip simply estimates in-stantaneous rain-rate every hour and accumulates this directly to longer timescales, TAMORA uses an half-hour estimate obtained averaging over 4 scans (one every 10 minutes) of radar data and maps them to the equivalent half-hourly mean by histogram matching. This equivalent half-hourly rain-rate is used as output of TA-MORA and accumulated to decadal timescale [77].