UNIVERSITÀ DEGLI STUDI DELLA TUSCIA DI VITERBO
DIPARTIMENTO PER LA INNOVAZIONE NEI SISTEMI BIOLOGICI, AGROALIMENTARI E FORESTALI
Corso di Dottorato di Ricerca in
BIOTECNOLOGIA DEGLI ALIMENTI - XXVI CICLO
AUTHENTICATION AND TRACEABILITY OF EXTRA-VIRGIN OLIVE OIL BY MEANS OF STABLE ISOTOPES APPLICATIONS
AGR/15
Tesi di dottorato di:
Dott. Silvia Portarena
Coordinatore del corso Tutore
Prof. Marco Esti Dott. Enrico Brugnoli
Firma ……….. Firma ………
Co-tutore Prof. Marco Esti
Firma………
i I would like to thank the following people for their direct or indirect contribution to this thesis: My supervisors Dr. Enrico Brugnoli and Prof. Marco Esti.
All my colleagues at CNR – IBAF are duly acknowledged for providing practical and psychological support especially by means of an enjoyable working environment. In particular, Marco Lauteri, Isacco Beritognolo, Olga Gavrichkova, Angela Augusti and Andrea Scartazza, for their helpful comments and suggestions for my PhD thesis.
Luciano Spaccino, Marcello Cherubini, Giovanni De Simone and Michele Mattioni for their skilfull support in, respectively, Isotope Ratio Mass Spectrometry, oil extraction, field samplings and software setup.
I am also in debt with Prof. Franco Famiani and Daniela Farinelli for their availability in collaborating to my research work.
UNAPROL (Consorzio Olivicolo Italiano) and CESIA project are recognized for providing samples and partially funding this research.
This thesis is dedicated to my family and in particular to my husband, Alessandro, my daughter, Maria and my son Nicola.
ii
CONTENTS
Contents i Abstract 1 1 INTRODUCTION 2 1.1. Food authenticity 2 1.2 EU legislation 3 1.3 Current Perspective 42 STATE OF THE ART 5
2.1 Stable isotopes 5
2.2 Natural variation in carbon and oxygen stable isotope abundance 6
2.3 Stable isotopes composition in food authentication 14
3 OLIVE OIL 17
3.1 Introduction 17
3.2 Stable isotopes composition in olive oil authentication 18
3.3 Fatty acids in olive oil 18
3.4 Metabolic pathway of main fatty acids in olive oil 20
3.5 Fatty acid and isotopic composition in olive oil 20
4 AIMS AND OUTLINE OF THE THESIS 22
4.1 Aims of the thesis 22
4.2 Outline of the thesis 22
5 MATHERIALS AND METHODS 24
5.1 Preparation of the samples 24
5.2 Isotope ratios mass spectrometry method 24
6 RESULTS AND DISCUSSION 27
6.1 Carbon and Oxygen stable isotopes composition in olive oils: pedoclimatic traceability 27
6.1.1 Samples 28
6.1.2 Statistical treatment of data 30
6.1.3 Results and discussion 30
6.1.4 Conclusions 35
6.2 Isotopic and fatty acid composition of Mediterranean monovarietal olive oils 36
6.2.1 Material and methods 37
6.2.2 Statistical analysis 38
6.2.3 Results and discussion 39
6.2.4 Conclusions 49
6.3 Effect of ripening stage and climatic conditions on the isotope composition of monovarietal
olive oils 51
iii
6.3.2 Statistical analysis 54
6.3.3 Results and discussion 54
6.3.4 Conclusions 65
7 CONCLUSIONS AND PERSPECTIVES 67
8 REFERENCES 69
1 There is an increasing demand for reliable analytical methods verifying the authenticity of the food we eat. There is, among consumers, a growing enthusiasm for high quality food with a clear regional identity. Numerous food frauds performed by international food producers, have sensitized consumers concerning the authenticity and origin of food products. In the last few years, European Union policy on food has also been orientated towards safeguarding consumers. To achieve this goal the EU has reinforced national control activities, and has driven scientific research to obtain new markers able to control the genuineness and geographical traceability of foods, ensuring their authenticity. Stable isotope ratios of bioelements such as carbon and oxygen have been used for thirty years, in order to check the authenticity of different premium products. With regard to stable isotopes, this ability is based on isotopic fractionation occurring during physical and (bio)chemical processes, as well as along metabolic pathways. For example, in plant material, the different isotope ratios vary according to photosynthetic pathways (plants C3 and C4), climatic, hydrological or geographical conditions. In this study, isotope ratio mass spectrometry (IRMS) analyses have been used to characterise and determine the authenticity of Italian extra virgin olive oils. Furthermore, isotope composition, 13C and 18O, determined in monovarietal extra-virgin olive oils, together with fatty acid compositions, allows distinguishing samples from different cultivars at different maturation degree. Moreover, statistical analyses of obtained results (Multivariate ANalysis Of VAriance (MANOVA), Principal Component Analysis (PCA), and Linear Discriminant Analysis (LDA)), allows grouping oil samples according to their cultivar, demonstrating the usefulness of isotopic composition and fatty acids analysis in differentiating monovarietal olive oils. To conclude the approach used in this study can be proposed for the detection of mislabelling for food products, becoming a tool for checking compliance with the law.
Keywords: stable isotope ratios, IRMS, fatty acid composition, extra-virgin olive oil, cultivar,
2
1. INTRODUCTION 1.1. Food authenticity
Consumers around the world are increasingly demanding information and reassurance of regarding the origin and content of their food. Furthermore, food manufacturers must provide and confirm the authenticity and point of origin of food products and their components. These increased demands come amid legislative and regulatory drives increasing the complexity and level of regulation imposed on the food supply worldwide. Protecting consumer rights and preventing fraudulent or deceptive practices such as food adulteration are important and challenging issues facing the food industry.
Determining the authenticity of foods means uncovering misdescription of foods not meeting the requirements for legally adopting a certain name, substitution with cheaper but similar ingredients, undeclared processes (e.g. irradiation, freezing) and/or extension of food using adulterants (water, starch), and incorrect origin (e.g. geographic), species or method of production.
Food authenticity issues indeed fall into one of the following categories: (i) economic adulteration of high value foods;
(ii) misdescription and/or mislabelling of geographical, botanical or species origin; (iii) non-compliance with the established legislative standards
(iv) implementation of processing practices which are not admitted (e.g. irradiation, freezing). Nowadays, objective assessment of food authenticity has become of paramount importance, as consumers come into daily contact with a wide variety of foods. Globalisation indeed means that more and more foods are traded around the world. Traceability has thus become a cornerstone of the EU’s food safety policy, representing a risk-management tool which enables those in the food industry or the authorities to withdraw or recall products which have been identified as unsafe. The increasing complexity and length of the food chain, as well as recent food scares, have also added to public sensitivity regarding the origin and authenticity of food and have underlined the need for tools ensuring that foods are of a high quality and safe to be eaten when they reach the consumer. In the case of olive oils, the increase in the demand for high-quality olive oils has led to the appearance in the market of olive oils elaborated with specific characteristics. They include oils of certain regions possessing well-known characteristics, that is, olive oils with a denomination of origin, or with specific olive variety composition. There are olive oils obtained from one genetic variety of olive (monovarietal) or from several different varieties (coupage). Monovarietal olive oils have certain specific characteristics related to the olive variety from which they are elaborated. Coupage (or blend) olive oils are obtained from several olive varieties to achieve a special flavour or aroma. The works dealing with olive oil traceability are usually focused on investigating the
3 botanical or geographical origin. However, the concept of geographical traceability, in which the objective is the geographical location of the olive tree, is slightly different from the concept of botanical traceability, in which the olive used for the olive oil production is the aim. In both cases, the selection of the markers (compounds with discriminating power) to be studied is complicated because the composition of extra virgin olive oils is the result of complex interactions among olive variety, environmental conditions, fruit ripening, and oil extraction technology (Araghipour et al., 2008). Therefore, a careful definition of the geographical or botanical origin of an olive oil based on its chemical composition requires that many factors be taken into account, being very difficult to find an appropriate marker. The aim of this work was to develop new and powerful analytical tools to control the traceability and authentication of olive oils from a certain geographical origin, cultivar and ripening degree of olives used for oil extraction to avoid fraud to the consumers.
1.2. EU legislation
In 1979 European controls on food labelling were introduced with Directive 112/79/EEC of the European Parliament. Additional controls and amendments have since been added, creating an array of labelling requirements. Over two decades, most legislation regarding food safety has been standardised in the European Community. Because of the high administrative costs of standardisation the principle of mutual recognition was used for issues which did not directly endanger consumers' health. European law, and in particular the “Cassis de Dijon” ruling (case120/78, Court of Justice of the European Communities, February 1979), now ensures that, while standards might differ across countries, a country cannot oppose importation from another EU country for technical reasons (except in cases involving sanitary issues or toxic waste issues).
In 2000, the original 1979 directive and its amendments were consolidated into Directive 13/2000/EC of the European Parliament, which focuses on preventing fraudulent or deceptive practices and food adulteration. Directive 13/2000/EC requires detailed food labelling including the exact nature and characteristics of a product, enabling informed consumer choice. It also requires the list of ingredients to include the specific names of all raw materials in descending order by weight. The reliance on mutual recognition in order to avoid trade barriers between countries, together with the need to differentiate quality products from the bulk production generated by the Common Agricultural Policy (CAP) arrangements, has resulted in more importance being given to national labelling. For example, national labels of food quality in France and Italy have appeared more and more attractive to consumers, and therefore to producers, who use them to segment the market. Pressure from countries that had developed a labelling system, largely based on geographical indications, namely France and Italy, led to the definition of a EU-wide system of
4 labelling, in what is called the ‘1992 regulation of food quality’. Indeed in 1992 and subsequently in 2006 (2081/92/EEC and 510/2006/EC), the EU Regulations on Protected Designations of Origin (PDO), Protected Geographical Indication (PGI) and Traditional Speciality Guaranteed (TSG) provided a set of common rules across countries to register and protect geographical names used to identify food products and traditional production processes. These two sets of regulations are the basis of quality policy system of the EU because they ensure that only those products genuinely originating in a region can be sold as such, eliminating unfair competition and misleading products that may be of inferior quality or made with different components. Finally, the new European Union Traceability Regulation (178/2002/EC) which came into force in January 2005, defines ‘traceability’ as “the ability to trace and follow a food, feed, food-producing animal or substance intended to be, or expected to be incorporated into a food or feed, through all stages of production, processing and distribution”. While most value chains only allow tracing one step forward and one step back trace, a more detailed traceability system back to the seed is required, for example to ensure that products have not been genetically modified.
1.3. Current Perspective
In the majority of cases paper traceability and livestock tagging systems can guarantee the geographical origin of foods on sale in the retail market. However, increasingly widespread circulation of foodstuffs all over the world can ‘lead into temptation’ unscrupulous traders who may attribute false descriptions and incorrect origin labelling to foodstuffs. The prospect of high profits combined with a low risk of detection and the lack of stringent penalties associated with food fraud has attracted crime syndicates into illegal food trading. Thus, the food industry urgently needs methods screening non-targeted food samples to provide proof of origin and prevent deliberate or accidental undeclared admixture to food samples.
Isotopic analysis have been applied to a range of foodstuffs for about thirty years, with varying degrees of certainty in order to develop methods that could verify their authenticity. Application of isotopic compositions in order to verify the authenticity of olive oil is based on evidence that these parameters are affected by various complementary factors. In particular stable isotope ratios of organic material mostly depend on botanical, climatic or geographical conditions where the plant grows.
5
2. STATE OF ART 2.1. Stable isotopes
In bio-organic material, the main elemental constituents (H, C, N, O, S) have different stable isotopes (D, H; 13C, 12C; 15N, 14N; 18O, 17O, 16O; 36S, 34S, 33S, 32S), the main one being the lighter, as evident in Table 1, showing their mean abundance. The natural isotopic composition of organic compounds shows fluctuations around these mean values and these variations, even if on the order of ppm, can be measured precisely and accurately using dedicated analytical techniques such as Isotope Ratio Mass Spectrometry (IRMS). Measurements are reported as relative variation compared to a standard as ‰ in comparison to international reference standards (Table 1), according to the following equation:
where R is the ratio between heavier and lighter isotopes. is dimensionless and normally indicated in per mill.
Table 1. Mean natural abundance of some stable isotopes and relative international reference
standards.
Natural variation in isotopic composition is due to the different chemical-physical characteristics of the different isotopes of a certain element, owing to different weight and nuclear spin. In a chemical/biochemical reaction or in a phase transition, these differences can both interfere with the speed of reaction (kinetic effect) and affect the energetic state of the system (thermodynamic effect). Due to the smaller weight the lighter isotopes have greater mobility and smaller bound strength and consequently lower activation energy (kinetic effect). The thermodynamic effect is due to the different free energy of isotopically different molecular species: heavier molecules have
6 lower free energy, so they have greater inertia in reaction and tend to concentrate in the condensed phase. Isotopic fractionation can also be due to situations with an altered reaction equilibrium, such as an instantaneous change in temperature, removal of a reactant or of a reaction product. This kind of fractionation (of non equilibrium, such as enzymatic reactions) determines the enrichment of a particular isotopic species, but without pre-established rules. Subsequently, factors affecting the variability of the isotopic ratios investigated in this thesis (D/H, 13C/12C, 15N/14N, 18O/16O, 34S/32S) were broadened, in order to clarify their applicative capability.
2.2. Natural variation in carbon and oxygen stable isotope abundance
CARBON
Figure 1 shows the carbon isotopic composition of some natural substances. There are essentially three fundamental processes in the carbon cycle involved in isotopic fractionation:
- intake of carbon from the environment by organisms with 13C depletion,
- exchange between atmosphere and hydrosphere leading to an enrichment of 13C (Galimov, 1985), - group of reactions in animal and plant bio-systems causing further fractionation. Uptake of CO2 through photosynthesis is the main reaction involved in biological fractionation. In the formation of C-C bound, lighter and more movable carbon atoms are favoured, so photosynthetic products are enriched in 12C and depleted in 13C as compared to atmospheric CO2 (13C of CO2 is at present around -8‰). Furthermore, photosynthetic products show different ranges of 13C according to the different pathways of photosynthetic cycle (C3, C4 or CAM) because of the different CO2 concentrating mechanisms and different isotopic effects associated with different primary carboxylase enzymes involved in CO2 fixation, in different plants types.
Figure 1. Scale of qualitative isotopic composition of carbon in some natural substances. (Galimov,
7
C3 cycle
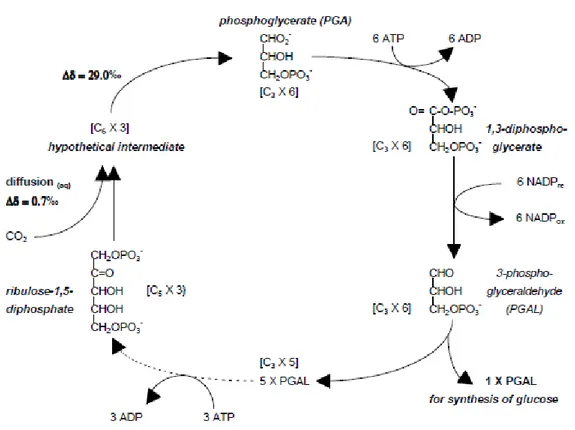
The main CO2 assimilation pathway described by Calvin, called C3 because CO2 is fixed in intermediate products with three atoms of carbon, is characteristic of plants from cold temperate areas (e.g. tomatoes, potatoes, beetroot, wheat, rice, oats, barley, rye, soya bean, grapes, oranges and apples). Atmospheric CO2 enters into leaf’ parenchyma through the stomata, crosses the cell wall, dissolves in the liquid phase, is transported through the plasmalemma into the cytoplasm, and finally enters the chloroplast (Hatch and Slack, 1966; Smith and Epstein, 1971). In the chloroplast stoma, with a series of reactions catalysed by the enzyme riblose-1,5-bisphosphate carboxylase-oxygenase (Rubisco) CO2 binds to ribulose-1,5-bisphosphate (RuBP), producing two molecules of phosphoglycerate (PGA), which are subsequently reduced to phosphoglyceraldehyde (PGAL), the first sugar of photosynthesis (Figure 2) (Taiz and Zeiger, 1998). Five out of six new PGAL molecules are used to synthesise more RuBP via a series of complex reactions driven by ATP (not shown in Figure 2). The sixth molecule of PGAL may be used to synthesise glucose (usually regarded as the end product of photosynthesis) via combinations
and rearrangements. The glucose may be subsequently used to synthesise complex carbohydrates such as sucrose, structural materials such as cellulose, or energy storage compounds such as starch and lipids (Ting, 1982). Although the initial reaction of CO2 with RuBP produces the overriding 13C isotope effect associated with these species, there are many other factors which contribute to the final 13C value of plant material, such as water availability, evaporative demand of the atmosphere, temperature, fertilisation, salinity, CO2 concentration, light intensity and photorespiration (O'Leary, 1981). The interplay of all of these factors results in 13C ‰ values between -22‰ and -34‰ for 80% to 90% of plants utilising the C3 pathway (Krueger and Reesman, 1982).
8
Figure 2. Synthesis of carbohydrate by the Calvin (C3) cycle.
Hatch-Slack or C4 cycle
The carboxylase enzyme Rubisco responsible for carbon fixation in the Calvin cycle is also capable of catalysing the oxidation of RuBP with atmospheric oxygen and this process is known as photorespiration. In other words CO2 and O2 are both competing substrates for the carboxylase enzyme (Taiz and Zeiger, 1998). Consequently, the C3 mechanism will not operate with atmospheric CO2 concentrations of less than approximately 50 ppm. Below this level of concentration the plant photorespires more CO2 than it assimilates and will eventually die (Krueger and Reesman, 1982). However, there is another group of plants that can carry out photosynthesis with conditions of high temperature, intense light, low moisture, low CO2 and high O2 concentrations. The mechanism of carbon fixation used by these plants was elucidated independently by Kortschak (1965) and by Hatch and Slack in the late 1960s, and it is called the C4 pathway (Hatch and Slack, 1970). C4 plants are able to utilise CO2 concentrations as low as 0.1 ppm. This is achieved by two sequential carboxylation reactions shown in Figure 3, occurring in two separate leaf compartments, namely the mesophill cells (MC), and the bundle sheet cells (BSC). When CO2 initially enters leaf stomata diffuses in the liquid phasein the MC. CO2 in the liquid phase is in equilibrium with bicarbonate (HCO3-) which combines with a 3-carbon compound, phosphoenolpyruvate (PEP), to form oxaloacetate (OOA), a 4-carbon acid, which is the origin of the term C4 synonymous with the Hatch-Slack cycle. This reaction is catalysed by the enzyme PEP carboxylase whose substrate is HCO3- in contrast with Rubisco which uses gaseous
9 CO2 as a substrate. Adding up the various isotope effects associated with dissolution and liquid phase diffusion of CO2, the equilibrium fractionation for the hydration of CO2 to bicarbonate and PEP carboxylation results in a much smaller fractionation against 13C as compared to the C3 cycle, -variation ~ 2‰ (O’Leary, 1981). OAA is then rapidly reduced by NADPre to form malate (MAL, a C4 acid) or aminated to form aspartate (ASP, a C4 acid). These acids are transported deeper to the BSC into the C4 plant leaves. These acids are then decarboxylated using NADPox to form a C3 compound and CO2. The CO2 released in such confined compartment causes a high CO2 concentration and the entire process can be regarded as a CO2 concentrating mechanism (CCM). Such high CO2 concentration can serve as a substrate for Rubisco without any significant photorespiration and then enters the Calvin Cycle (Figure 2). The C3 compound is converted to PEP, pyruvate or alanine and then to PEP by the action of ATP.
Figure 3. The Hatch-Slack pathway of C4 photosynthesis.
It is important to note that although C3 carboxylase enzyme Rubisco shows extensive 13C isotope fractionation (30‰), this is not expressed in the Hatch-Slack photosynthetic pathway. This is because the BSC constitute a relatively gas-tight system and the CO2 decarboxylated there has little opportunity to express it intrinsic fractionation because it has to fix all the CO2 available, independent on its isotopic composition. The only fractionation eventually expressed is due to the fact that BSC and therefore Rubisco has the opportunity to discriminate against 13C, to an extent
10 depending on the fractionation of BSC CO2 leakage. Consequently, plant biomass formed by C4 plants shows relatively enriched 13C‰ values ranging between -10‰ and -14‰ (Winkler, 1984). Examples of C4 plants are sugar cane, corn, sorghum, millet and some types of pasture grasses.
Crassulacean Acid Metabolism (CAM) Plants
There is a third group of plants which utilises an adaptive modification of the basic photosynthetic metabolism. This carbon metabolism is characterised by the storage of high concentrations of organic acids during the night and is known as Crassulacean Acid Metabolism (CAM). This term derives from a large succulent plant family, the Crassulaceae, many of which use the CAM metabolism (Ting, 1982). CAM plants tend to be grow in hot and dry climates and as a general rule, they have their stomata closed during the day and open at night. Consequently, the plant strongly reduces its transpiration in the hot daytime hours and only transpires and fixes CO2 at night with lower air temperature and this causes a reduction in starch and other storage glucans that energise the metabolism. However, if the daytime temperature is relatively low, the stomata may open and the plant will adopt direct C3 metabolism of CO2. When daytime temperatures are high the stomata remain closed to prevent water loss through transpiration (Krueger and Reesman, 1982). At night, when temperatures drop, the stomata open and CO2 is fixed by PEP carboxylase, in a process similar to that occurring in C4 mesophyll cell. The organic acids are then converted back to CO2 for C3 photosynthesis during daytime with closed stomata. Therefore, while the two processes are separated in two spatial compartments in C4 species, in CAM plants they are separated in time between night and daytime. The metabolism adopted by CAM plants is therefore linked to local climatic conditions and in extreme cases may be predominantly C3 or C4. Consequently, the 13C‰ value of CAM plant material varies widely between -30‰ and -12‰ (Winkler, 1984). Pineapple, vanilla and cacti are the most well known plants that use this metabolism.
Secondary carbon metabolism
Further fractionation between plant components from the same primary source (even at specific positions within plant compounds) is a result of kinetic isotope effects (KIEs) in metabolic processes involving side reactions or branching (Schmidt & Kexel, 1999). As a result secondary metabolites such as protein and lipid show systematic deviations from their carbohydrate precursors. As a general rule secondary metabolites tend to be relatively depleted in 13C. This is most notable in lipid fractions that may differ from whole leaf carbon by as much as 10‰. This depletion is known to be caused by an isotope effect associated with the decarboxylation of pyruvic acid and the formation of the C2 substrate for acetyl coenzyme A (De Niro and Epstein, 1977). The repetition of this process during fatty acid chain construction results in alternating 13C depletions (Monson and Hayes, 1982).
11 OXYGEN
The compositional variability of δ18O in meteoric water is based on cycles of its evaporation from oceans and subsequent condensation in terms of precipitation. The oxygen isotopic composition of oceanic water (from -1 to 0.7‰) (Clark and Fritz, 1997) is close to that of V-SMOW (0‰), the international reference standard for the measurement of δ18O (Table 1), although it has changed considerably during different geological eras. The evaporative flux of oceanic water is mainly governed by temperature, and most tropospheric vapour (more than 70%) originates in sub-tropical oceans. During evaporation there is an enrichment of the lighter isotope in vapour, calculated in a hypothetical situation of equilibrium as:
δ18O = -10.0‰ for oceans at 20°C δ18O = -11.6‰ for oceans at 10°C
which leads, according to these theoretical estimations, to the following values for precipitation, considering cooling of 15°C and 5°C:
δ18O = 1.5‰ for precipitations at 15°C δ18O = 2.2‰ for precipitations at 5°C
These calculations do not agree with the mean isotopic composition of world precipitation (δ18O = -4‰), proving that from an isotopic point of view evaporation and condensation are non-equilibrium processes (mainly determined by low humidity level, temperature, wind and degree of salinity). Precipitation occurs when humidity is 100%, so isotopic fractionation is mainly due to temperature. Oceanic vapour from subtropical areas moves towards the poles, becoming cooler and condensing in the form of precipitation, becoming depleted in heavier isotopes that concentrate in initial rainfall (Figure 4). Consequently, latitude is a factor discriminating oxygen isotopic fractionation. This situation is clear in Figure 5, where it can be seen that 18O depletion in precipitation increases with latitude. Thus, equatorial water is richer in heavier isotopes than water at the poles with an intermediate situation of continuum according to latitude. However, in the same figure considerable deviations can be noted (e.g. on the east coast of South America or in the Atlantic Ocean between Mexico and Scandinavia), due to warm oceanic currents. In addition to the ‘latitude’ effect there is a ‘continental’ effect due to the distance from the sea, related to the vapour masses moving over continents (with the increasing distance from the primary source of vapour the δ18O of precipitation decreases due to previous precipitation) causing precipitation along the coasts
which is isotopically richer than that in continental areas (mean depletion of -2.8‰/1000 km from the coast). Moreover, different altitudes inland lead to 18O depletion of around - 0.15‰ to -0.5‰ per 100 meters of height, because at higher altitude there is lighter vapour. Finally, deviation is also due to seasonal trends; during the summer there is 18O enrichment, especially inland.
12
Figure 4. Isotopic fractionation of vapor mass in relation to temperature (Clark and Fritz, 1997).
Figure 5. Distribution of mean 18O values for precipitation in 1992 and 1993 (Rozanski, 1993)
To summarize, the factors affecting δ18O content in meteoric water are latitude, distance from the sea, altitude and seasonal trends. Ground water has an isotopic composition related to the mean annual isotopic composition of precipitation water and its δ18O depends only on geographical factors (altitude, latitude, distance from the sea) but not on the season. In plants, the isotopic composition of plant water is related to the water absorbed from the soil, so it is affected by the factors mentioned above. Furthermore, leaf water is subjected to an isotopic fractionation during evapotranspiration processes which are affected by temperature and relative humidity and leading to an enrichment in heavier isotopes. Plant compounds derive their oxygen atoms from vegetal water but also from air CO2 and O2 with δ18O values that are essentially constant and stand at around
13 +40.3/+42.5‰ and +23.5/+23.8‰ respectively. Oxygen integration in organic compounds through metabolic processes causes considerable isotopic fractionation. For example, the δ18O of cellulose is correlated with the δ18O of leaf water, with an enrichment of around 27‰ caused by the isotopic fractionations occurring during exchanges between the carbonylic group and water (Schmidt et al., 2001; Barbour, 2007).
2.3. Stable isotopes composition in food authentication
Stable isotope analysis, performed using Isotope Ratio Mass Spectrometry (IRMS) has taken on increasing importance in determining the authenticity of fruits, vegetable and food of animal origin for producers and food controls.
Olive oil (together with wine) is one of the most studied food items with regards to commercial frauds and adulteration. Angerosa et al. (1999) made measurements of δ13C and δ18O of the whole oil and some of its fractions in order to gain information about the geographical origin of olive oil produced in Greece, Morocco, Spain, Italy, Tunisia, and Turkey. By applying statistical procedures they demonstrated that oil samples show the trend to cluster according to the different climatic areas of growing environment of fruits. Some confusion were observed for samples coming from neighboring countries having similar climates. Kelly and Rhodes (2002) highlighted emergent techniques such as compound and position specific-isotope mass spectrometry. These latter developments offer the potential to provide more rapid and improved detection of the economic adulteration of vegetable oils.
In wine IRMS can be used both for origin assignment of samples and to detect adulteration. Gremaud et al. (2004) characterized Swiss vineyards and were able to distinguish five main production zones. They obtained this result by combining via a multivariate approach δ 18O variations with elemental (Mn, Al, B, Ba, Ca, Fe, Mg, Na, Rb, Sr, Zn) and FT-IR (ethanol, pH, total acidity, volatile acidity, malic acid, fructose, tartaric acid, lactic acid, succinate, citric acid, glycerol, 2,3-butandiol, dry matter and relative density) analyses. Not only carbon and oxygen ratios can be useful for wine authenticity certification, as a matter of fact Almeida and Vasconcelos (2001) set up an ICP-MS for 87Sr/86Sr determination and showed that the isotopic profile of strontium is a promising fingerprint of wine origin. Adulteration of wine with glycerol is considered to be a problem in European wine-producing countries. As there is little chance of being able to identify glycerol from different sources on the basis of a method which uses only one isotope, Rossmann et al. (1998) developed a multielement approach using NMR. Glycerol from wine showed the lowest relative enrichment with deuterium, was mainly in position C-2, and had a relatively high 18O content, together with very negative δ13C values, which significantly correlated with those of
14 ethanol from the same wines. Isotopic data of glycerol samples from different sources were in agreement with those given by indices of origin. These data allowed identification of the origin of these glycerol samples, i.e. whether they were produced industrially or synthesized by animals or plants. Glycerol of plant origin was most similar to glycerol found in wine. The combination of several isotopic data by discriminant analysis yielded clusters of data obtained from glycerol samples of similar origin. Taking into account the characteristics of possible mixtures, proof that wine has been adulterated depended on the origin and isotope levels of the added compound. It was shown that it is possible to prove that wine has been adulterated with glycerol from other sources when the latter is present at a concentration of 15% of total glycerol content.
As proved by Brescia et al. (2001) IRMS can be a tool suitable to provide information about the geographical origin of durum wheat. As a matter of fact though the application of chemometrics to isotopic determinations they performed the discrimination of semolina by cultivar and geographical origin.
Due to the huge consumption and to the consequently large commercial movements the authenticity of orange juice is an issue too. Pupin et al. (1998) used isotopic analyses to determine the authenticity of Brazilian orange juice. The mean ratios found for these parameters in authentic hand-squeezed orange juice were as follows: δ13C = -26.6‰; and δ18O = +2.27‰. Simpkins et al. (2000) found similar values for Australian orange juices. The mean of their (273) samples was δ13C -24.77 (min. -27.3‰, max. -22.5‰).
15
3. OLIVE OIL 3.1. Introduction
European and Italian law require that the origin of some premium products, such as virgin and extra virgin olive oils must be declared on the label. This is particularly important with the growth and promotion of “added value” regional foods such as those produced under “Designated Origin” labels. But at the moment no analytical methods exist that are capable of verifying the truthfulness of the assertions on labels so, to achieve this aim the EU is urging to investigate new markers able to support food characterization and geographical traceability assuring its genuine origin. World olive oil production currently stands at around 2.9 million tons (2009 data provided by FAO, http://faostat.fao.org/) and the olive oil industry employs about 2.7 million people, of whom approximately two million are ‘family producers’ living in the less economically favored regions of southern Europe (http://www.oliveoiltimes.com). Indeed European producers on the Mediterranean basin – Greece, Spain, Portugal, Italy and France – supply the bulk of overall production. Thus olive oil is a fundamental part of the farmers' income and represents as much as 15% of the gross agricultural domestic product in countries such as Greece (Luchetti, 2002). Extra virgin olive oil commands a high retail value (2 to 4 times that of other oils) because of its organoleptic qualities and the purported health benefits of consuming oils high in mono-saturated fatty acids (Gurr, 1999). These factors and the increasing demand for olive oil have encouraged many Mediterranean countries to invest in olive oil production. Consequently throughout Europe there is an enormous range of quality olive oils. However, when a product acquires a reputation extending beyond national borders it can find itself in competition with products which pass themselves off as the genuine article and take the same name. This unfair competition not only discourages producers but also misleads consumers. This is why the European Union created the PDO and PGI systems in 1992 to promote and protect foodstuffs of particular quality (Regulation 2081/92/EEC subsequently replaced with Regulation 510/2006/EEC). Furthermore in February 2009 labelling of origin for virgin and extra virgin olive oils became compulsory by European law (Regulation 182/2009/EC). Nevertheless, within the framework of limits prescribed by European regulations there is potential for mislabeling olive oil without risk of detection. Indeed, official olive oil quality control methods are based on maximum or minimum limits of certain chemical components, e.g. fatty acids, sterols, alcohols or stigmastadiene (Regulation 2568/91/EEC and amendments), and it is impossible to verify the real geographical origin of olive oil using these. This situation can influence consumers’ perception of the benefits of consuming olive oil and the current image of uncontrolled provenance in the olive oil market poses a considerable risk to the opportunity for economic growth in many Mediterranean countries. In particular, Italy has the highest number of PDO and PGI registered
16 foodstuffs in Europe (N=206) and extra virgin olive oil is the second most important commodity, with forty recognized brands (Wesseler, 2010). So this commodity is very important for the Italian economy, being Italy the second largest producer in the world (588,000 tons in 2009, data provided by FAO, http://faostat.fao.org/) after Spain and the largest consumer (International Olive Oil Council, http://www.internationaloliveoil.org). This situation highlights the increasing demand for analytical methods and statistical tools capable of effectively verifying claims of origin.
3.2. Stable isotopes composition in olive oil authentication
Initial studies of the stable isotope ratios of olive oils focused on their use for detecting the adulteration of olive oil with cheaper oils. In particular, 13C/12C measured using an Elemental Analyzer – Isotopic Ratio Mass Spectrometer (EA-IRMS) or Gas Chromatography/Combustion/Isotopic Ratio Mass Spectrometer (GC/C/IRMS) in bulk olive oil or in some sub-components (individual fatty acids or aliphatic alcohols and sterols) has been shown to be useful for detecting the adulteration of olive oil with cheaper Pomaceae olive oil or with other vegetable oils (Angerosa et al., 1997; Spangenberg et al., 1998). Subsequently, stable isotope ratio analysis, in particular 13C/12C in combination with the 18O/16O of bulk oil, proved to be a good tool for characterizing geographical origin. Royer and co-workers (1999) studied the 13C/12C of palmitic, oleic and linoleic fatty acids of olive oils, observing differences between French and Italian olive oils as compared to Greek ones and obtaining a regional classification of Greek olive oils. Some authors (Bréas et al., 1998; Angerosa et al., 1999) found that both the 13C/12C and 18O/16O of olive oils from Italy, Greece, Spain, Tunisia, Morocco and Turkey change according to latitude, suggesting distance from the sea and environmental conditions during the growing of plants (water stress, atmospheric moisture and temperature) as co-factors of variability. Finally, Aramendia et al. (2007) observed that the 18O/16O values of bulk olive oils were influenced by the variety of the olives and by their geographical origin, but not by the altitude, ripening degree and harvesting date of olives.
3.3. Fatty acids in olive oil
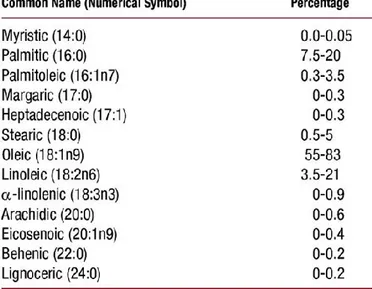
Fatty acids are simple structures made up of long chains of various numbers of carbon atoms, with a carboxylic acid group at one end. The main fatty acids present in olive oils are presented in Table 2.
17
Table 2. Percentage of the different Fatty Acids present in olive oil (Rev Esp Cardiol. 2009;
62:294).
High amounts of monosaturated fatty acids are present in olive oils, which confer to them a high nutritional value. Moreover, oil characteristics are influenced by the proportions of fatty acids present. As it can be seen in Table 2, the studies on the composition of fatty acids in olive oils were usually performed by gas chromatography (GC) coupled with flame ionization detection (FID) (Di Bella et al., 2007; D’Imperio et al. 2007; Mannina et al., 2003). In most papers collected in Table 2, the use of chemometric tools was required to perform an olive oil differentiation according to the fatty acid composition. The fatty acids content was used by some researchers to differentiate olive varieties (Tsimidou et al., 1993; Alonso et al., 1993; D’Imperio et al.,2007). For example, D’Imperio et al. established a qualitative similarity among olive oils of different cultivars and showed that these varieties were grouped together by discriminant analysis. This fact revealed that the fatty acid composition of olive oils was strongly influenced by several factors such as cultivar, maturation stage of fruit, and zone of origin (Alonso et al. 1993). To relate the fatty acid composition of olive oils with the cultivar influence, Mannina et al. (2003) studied olive oil in a well-limited geographical region, neglecting the pedoclimatic factor (soil characteristics such as temperature and humidity) and finding a relationship between the fatty acid composition and some specific cultivars. However, Di Bella et al. (2007) maintained that although the effect of the cultivar was significant in an olive oil classification based on the fatty acid composition, a predominant and well-defined geographical effect was also present. It is important to consider that chemometric tools can be used not only to describe the characteristics of oils and classify them but also to select the best variables to obtain satisfactory results (Gurdeniz et al., 2009). For example, variability in fatty acid and triglyceride concentrations among olive oil samples was used by some authors (Olliver et
18 al., 2003; Aranda et al., 2004) applying chemometric methods. Moreover, in comparison with other markers, the fatty acid and triglyceride composition allowed a better differentiation of olive oils than the sterol composition (Brescia et al., 2003).
3.4. Metabolic pathway of main fatty acids in olive oil
Fatty acid biosynthesis involves the cyclic condensation of two-carbon units in which acetyl-CoA is the precursor. The enzymes of the pathway are thought to be held together in a complex that is collectively referred to as fatty acid synthase.
Some 16:0-ACP is released from the fatty acid synthase machinery, but most molecules that are elongated to 18:0-ACP are efficiently converted to 18:1- ACP by a desaturase enzyme. The repetition of this sequence of events makes 16:0-ACP and 18:1-ACP the major products of fatty acid synthesis in plastids. Fatty acids may undergo further modification after they are linked with
glycerol to form glycerolipids. Additional double bonds are placed in the 16:0 and 18:1 fatty acids by a series of desaturase isozymes.
The methabolic pathway in the synthesis of fatty acids is shown in figure 4.
Figure 6. Metabolic pathways in the synthesis of fatty acids.
3.5. Fatty acid and isotopic composition in olive oil
Although the vast majority of plants (>300,000) belongs to the C3 group with δ13C values of <−24‰, differences in enzyme kinetics of biochemical pathways (mainly caused by environmental
19 factors, such as climate and geographical location) result in subtle variations in the 13C signature at natural abundance level of bioorganic compounds, such as fatty acids. The information locked into organic molecules due to these kinetic isotope effects provides valuable information on origin, authenticity and food webs, to name but a few, and can only be accessed by GC/C–IRMS techniques.
It has been established that the fatty acids, particularly oleic acid, are formed in the chloroplasts of leaves or proplastids of seeds (Stumpf, 1980). Acetyl co-enzyme A is the basic unit for fatty acid biosynthesis. While the olive oil accumulation occurs in the fruit, the precursors for its synthesis have to be imported from the leaves. The carbohydrates in the olive fruit pericarp evidently reflect the influx of metabolites from the leaves to the fruits and serve as a source for the acetyl needed for fatty acid biosynthesis, as demonstrated in castor bean seeds (Simcox et al., 1979 ).
The isotopic fractionations involved in the biosynthesis of lipids has been the subject of many investigations based on the IRMS determination of overall isotope ratios (Meinschein, et al.1974; De Niro, M.J. and S. Epstein, 1977; Monson and Hayes, 1980). It has been observed that 13C contents of saponifiable lipids are lower than those of corresponding carbohydrates. Using appropriate degradations reactions it has been also shown that kinetic isotope effects occurring in the oxidation of pyruvate to acetyl-CoA by Pyruvate dehydrogenase are the source of enhanced 13C depletion at the carbonyl site and that fatty acid synthesis may than introduce some alteration in 13C distribution along the chain. It has been claimed that, in addition, kinetic isotope effects in the reaction leading to 18:2, causing 13C to pass preferentially from 18:1 to 18:2, yielding a net depletion of carbon 13 at the carboxyl position in 18:1 lipid (Monson and Hayes 1981). Another isotopic effect is associated with the elongation pathway leading from 16:0 to 18:0 and may be responsible for the enrichment of 13C in 18:0 (Monson and Hayes 1981).
Woodbury et al found the saturated 16:0 fatty acid in maize oil to be more depleted in 13C than the unsaturated fatty acids (18:1 and 18:2) from the same oil. In addition, consistent differences were observed for δ13C values of vegetable oils from the same plant species but from different geographical regions. For example, the major fatty acids in maize oil (16:0, 18:1 and 18:2) from Argentinean maize showed on average +2‰ higher δ13C values than those from maize grown in Italy. In subsequent work, Woodbury et al. determined fatty acid composition and δ13C values of the major fatty acids of more than 150 vegetable oils, thus establishing a database that provides isotopic information for authenticity control of vegetable oils. Variability in δ13C values could be related to geographical origin, year of harvest and the particular variety of oil. Their findings suggest that ultimately δ13C values of fatty acids are determined by a combination of environmental and genetic factors.
20
4. AIMS AND OUTLINE OF THE THESIS 4.1. Aims of the thesis
The general aim of this thesis was to verify the applicability of the analysis of multielement stable isotope ratios using IRMS (Isotopic Ratio Mass Spectrometry) in food authenticity. Especially, analytical approaches based on these techniques were developed for the traceability of different extra-virgin olive oils. The origin of this product must be declared by law, but to date no analytical methods exist that are capable of verifying the truthfulness of the assertions and description given on labels.
In detail the research focused on:
- characterization of Italian extra virgin olive oils: creation and validation of a dataset with isotopic values;
- Analysis of isotopic and fatty acid composition of Mediterranean monovarietal olive oils collected in the same experimental field: multivariate statistical analysis usable to verify the authenticity of compound specific cultivar;
- Study of the effect of ripening stage and climatic conditions on the isotopic and fatty acid
composition of mono-varietal olive oils in two experimental fields.
4.2. Outline of the thesis
The first introductory chapter gives an overview of the question of food authenticity and the provisions of EU law. Furthermore, natural variation in the stable isotopes of bio-elements (C, O) is illustrated, with the potential implications for food authenticity control.
In Chapter 2 analysis of the stable isotope ratios of bioelements is described in general.
Chapter 3 is dedicated on olive oil describing stable isotopes and fatty acids compositions as powerfull markers in traceability studies.
In this chapter 4 the scope and the outline of the thesis are illustrated. In Chapter 5 materials and methods used in this work are presented.
Subsequent chapter is devoted to three individual experimental works, presenting the results obtained during the PhD thesis.
Specifically, Chapter 6.1 focuses on the possibility of improving traceability of the geographical origin of extra virgin olive oils using carbon and oxygen isotope ratios. This analytical technique
was applied to authentic Italian oils collected at nine regions for three different years of harvest. The isotope ratios of monovarietal olive oils collected in the same experimental field, combined with fatty acids composition, were investigated in Chapter 6.2 providing direct evidences of the relationship between the Fatty Acid (FA) and isotopic composition of olive oils and specific
21 cultivars grown within a well-limited geographical region. In particular the appropriate multivariate statistical analysis combining the used variables can be used as a tool for verifying the cultivar of origin. In Chapter 6.3 the isotopic and fatty acid composition of different olive oil cultivars grown in the same olive orchard at different maturation degree was studied to investigate the effect of the degree of ripeness of the olive on carbon and oxygen isotopic composition in relation with fatty acid composition.
22
5. MATHERIALS AND METHODS 5.1. Preparation of the samples
Isotopic ratios were performed on bulk sample for determination of 13C and 18O in olive oil. The detailed preparation procedures are described in the relative chapters.
5.2. Isotope ratio mass spectrometry method
For analysis of stable isotope ratios, the sample was weighed in tin or silver capsules. The quantities of sample weights ranged from around 0.3 mg to 1 mg depending on the commodity and the isotope ratio analyzed. More details on the methods are provided in the specific chapters.
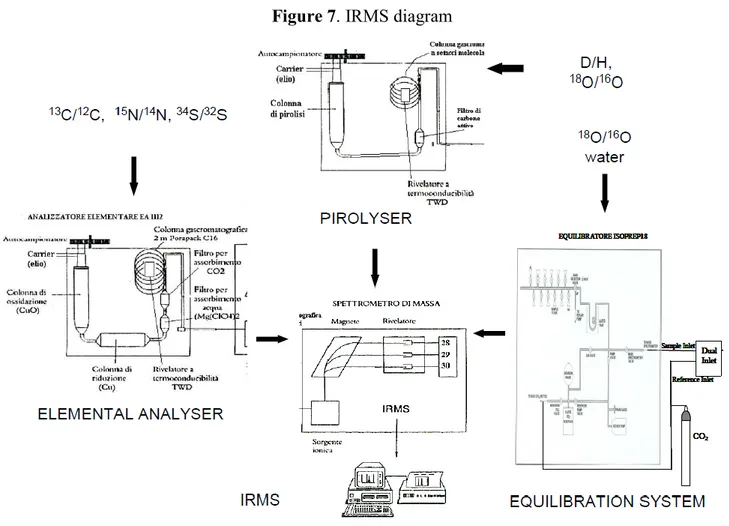
Analysis was carried out using an IRMS (Isotope Ratio Mass Spectrometer, Isoprime, Cheadle, UK) equipped with an elemental analyzer (NA1500, Carlo Erba, Milan, Italy) for 13C and a pyrolyser (Euro Pyr-OH, Euro Vector Instruments & Software, Milan, Italy) for 18O measurement (Figure 7). In detail, for determination of 13C the sample was dropped into an oxidation reactor inside the elemental analyzer, where it combusted (1050°) with development of CO2.
For measurement of 18O the sample was dropped into a high-temperature conversion/elemental analyzer where it was subjected to high temperature pyrolysis (1450°) with development of carbon monoxide gas. Then the weighed samples were put in the carousel of the auto-sampler equipped with a suitable cover.
23
Figure 7. IRMS diagram
The developed gases (CO2, CO) were then separated in a GC column at 80°C and transferred from the elemental analyzer or pyroliser after the separation into the ion source of an IRMS by the gas carrier helium (100 mL/min). In each analytical batch, every ten samples, a working in-house standard was analyzed and used to calculate the isotope ratios values of the samples (see below). In IRMS the gases are ionized in the ionic source and ions pointed through a semicircular flight tube. In the flight tube they are subjected to a constant magnetic field and, depending on the acceleration potential applied, only ions with specific masses can hit the electron multiplier detector (Table 2). Table 2. Masses measured using IRMS to determine stable isotope ratios
24 The isotope ratios were expressed as ‰ referred to the international standard V-PDB (Vienna—Pee Dee Belemnite) for 13C and V-SMOW (Vienna - Standard Mean Ocean Water) for 18O according to the expression:
,
where Rs is the isotope ratio of the sample and Rstd is the isotope ratio of the international standard, and indicates the isotopic composition for C (13C) or O (18O). The standard deviation of replicate measurements of standards was 0.1‰ for 13C and 0.3‰ for 18O measurements.
25
6. RESULTS AND DISCUSSION
6.1. Carbon and Oxygen stable isotopes composition in olive oils: pedoclimatic traceability
The importance of assessing food authenticity is increasing due to expanding global markets. Additionally, fast and cheap transportation, as well as various subvention schemes within a growing EU, are stimulating the need for reliable monitoring systems on the food sector (Rossmann, 2001; Luikx, 2008). Besides conventional analysis, isotope ratio measurements have proved especially useful in this field (Rodrigues, Maia, Lauteri, Brugnoli & Máguas, 2013). Certain biological and environmental processes characteristically discriminate against light or heavy isotopes (Aramendia et al., 2007). Consequently, the stable isotope composition of different elements in biological products provides information about geographical and ecological origin (Bréas, Guillou, Reniero, Sada & Angerosa, 1998; Angerosa et al., 1999; Rossmann et al., 2000; Manca et al., 2001; Camin et al., 2004). In particular, isotope signatures can serve as indicators of geographical origin (Schwertl, Auerswald, Schäufele, & Schnyder, 2005; Rodrigues et al., 2009, Camin et al., 2010a,b). The most relevant advantage of stable isotope techniques, as applied to foodstuffs, is time-consuming pre-treatments are not usually required. Carbon isotope composition in plants varies systematically, largely determined by the photosynthetic pathways, (C3, C4 or CAM [crassulacean acid metabolism]), used by plants to fix atmospheric CO2 in organic matter (Farquhar et al., 1989; O’Leary, 1995; Brugnoli & Farquhar, 2000). Olive trees belong to the C3 group, where carbon isotope composition (13C) ranges from about -22 to -33‰. The variation in 13C is also related to genetic determinants at the inter- and intra-specific level (Lauteri et al. 2004), although a number of environmental factors are known to affect isotopic fractionation, causing enrichment or depletion of certain isotopes during growth. Hence, within the same species, and within the same genotype, a wide variation in 13C is expected, especially with changing environmental conditions during the vegetative and reproductive (fruit setting and ripening) stages (Scartazza et al., 2004).
In details, the overall fractionation along the C3 assimilation path with respect to the air CO2 isotopic composition (carbon isotope discrimination, 13C) is linearly related to the ratio of intercellular to atmospheric CO2 concentrations (Ci/Ca). Such a robust model (Farquhar, O’leary & Berry, 1982) explains how environmental or genetic factors driving the Ci/Ca ratio in a C3 plant is reflected in the levels of discrimination against the heavy isotope 13C. Thus, any factors affecting the level of stomatal closure or the activity of carboxylating enzymes is expected to influence the isotopic composition of photo-assimilates and the composition of (plant) organic matter.
Many studies performed under controlled and field conditions have shown that plants grown in drought conditions are relatively enriched with 13C (O’Leary, 1993; Barbour et al. 2005). The
26 18O/16O ratio in plant material reflects the (a) isotopic ratio of the water sources (linked to latitude, elevation, distance from the evaporation source, temperature, amount of precipitation) (Clark et al. 1997; Van der Veer et al. 2009), (b) isotopic effects during transpiration (affected by relative humidity, temperature, isotope composition of water vapor) (Hermann et al. 2008, Gavrichkova et al. 2011) and (c) biosynthetic pathways including isotopic exchange between organic molecules and plant water (Barbour 2007, Schmidt et al 2001). A variation in stomatal conductance affects the isotopic signal of leaf water and, hence, of photosynthetic products and related oil (Scheidegger, Saurer, Bahn, & Siegwolf, 2000). In fact, photosynthetic products (carbohydrates) are exported from the leaves to the fruits to fulfil the metabolic requirements for oil synthesis (Sànchez & Harwood, 2002). Moreover, a number of studies have shown that variation in 18O of leaf water is reflected in the organic matter of the fruit (Barbour, 2007).
The aim of this work was to elucidate the influence of environmental and geographical factors on the stable isotopes (C and O) to ascertain the geographical origin of virgin olive oil. With this objective in mind, isotope measurements were extended to a large number of Italian olive oil samples, originating from regions with different climatic conditions along a north-south transect. C and 18O were compared with climatic and environmental factors including mean annual temperature, amount of rain, humidity, elevation, and xerothermic index (Xi).
6.1.1. Samples
A total of 387 virgin olive oil samples produced in different Italian regions and from three different years of production (2009, 2010, 2011) were analyzed. The olive growing areas were differentiated by latitude, longitude, altitude and climatic conditions. Mean values for temperature, total rainfall and relative humidity for the different sites in 2009, 2010 and 2011 were provided by colleagues from the Institute of Atmospheric Sciences and Climate of CNR (CNR-ISAC). A xerothermic index (Xi) for each site was calculated using the formula (taking into account each growing season month): Xi = ∑ (2TM – P) if 2TM > P or Xi = 0 if 2TM ≤ P, where, TM is the monthly mean temperature and P is the monthly precipitation. Latitude and Longitude were taken from Google Earth; the farmers provided altitude, based on their local knowledge. The geographical origin of the samples, climatic data and the geographical parameters are shown in Table 3.
Table 3. Geographical and climatic characteristics of sites of origin of olive oil samples analyzed.
Number of samples, geographical (latitude, longitude) and climatic data (mean annual temperature, amount of precipitations) of the provenience area. (Institute of Atmospheric Sciences and Climate of CNR-ISAC).
27 Region N Lat deg Long deg Altitudo m a.s.l.
Mean annual temperature °C Annual precipitation mm Relative humidity % Xerothermic index
Mean Mean Mean Mean DS Min Max Mean DS Min Max Mean DS Min Max Mean DS Min Max 2009 Lombardia 2 45.6 10.4 310 9.9 0.3 9.5 10.1 1126.6 208.3 970.9 1394.3 69.3 1.9 67.9 70.6 8 11 0 16 Toscana 10 42.8 11.0 150 15.7 0.5 15.6 17.1 817.2 45.0 697.2 832.2 72.1 0.3 71.2 72.2 77 16 72 125 Lazio 33 41.8 12.9 376 14.7 0.5 13.4 14.9 930.8 58.6 883.3 1095.0 74.2 0.7 73.0 75.5 55 30 2 122 Molise 18 41.7 14.8 310 16.1 0.5 14.9 17.0 784.0 62.0 755.6 930.8 73.3 0.6 73.1 74.9 83 14 46 88 Puglia 32 41.2 16.5 130 16.7 0.7 15.0 17.0 736.8 65.5 693.5 887.0 70.2 2.5 68.5 74.2 117 32 48 132 Calabria 25 40.0 14.7 272 16.4 1.0 14.2 17.8 787.1 112.9 631.5 1043.9 73.5 1.0 71.3 74.9 121 34 46 178 Sicilia 24 37.4 13.5 214 17.1 0.3 16.5 17.3 636.0 8.7 624.2 646.1 71.1 0.3 70.7 71.7 166 16 150 189 Sardegna 7 40.6 8.5 250 16.8 0.2 16.2 16.9 544.4 11.1 507.4 547.5 73.5 0.7 72.4 73.9 159 2 158 162 2010 Lombardia 6 45.8 10.0 225 8.8 0.2 8.6 9.1 1328.6 184.0 1200.9 1565.9 71.4 1.6 70.1 73.4 0 0 0 0 Liguria 10 44.0 9.1 189 13.1 1.5 10.0 15.1 1143.5 177.8 865.1 1430.8 73.8 2.1 72.3 78.3 20 14 0 32 Toscana 9 42.8 11.1 100 15.1 0.5 14.9 16.4 960.4 53.5 817.6 978.2 73.6 0.5 72.2 73.8 45 19 39 96 Lazio 10 42.1 12.9 395 14.3 0.5 13.0 14.4 1064.7 24.5 1054.9 1131.5 76.1 1.4 73.4 79.1 37 13 10 59 Molise 10 40.6 15.1 397 15.7 0.5 14.4 16.8 707.7 124.2 649.7 985.5 73.6 1.2 73.0 76.1 50 13 44 89 Puglia 27 41.2 16.3 160 16.3 0.7 14.7 16.7 668.5 62.3 598.6 784.8 69.1 2.5 67.4 75.5 85 19 44 102 Calabria 25 40.0 14.7 281 16.2 1.1 13.8 17.6 877.6 132.9 649.7 1054.9 73.7 1.4 71.2 77.7 102 45 16 178 Sicilia 8 37.5 13.6 224 17.5 0.7 16.5 18.4 596.8 15.5 580.4 624.2 73.1 0.4 72.5 73.7 160 10 153 173 Sardegna 13 40.1 8.8 198 15.9 0.2 15.7 16.5 699.7 32.2 613.2 715.4 75.7 0.5 74.0 75.9 116 5 110 129 2011 Lombardia 15 45.8 10.0 250 10.1 0.3 9.9 10.5 884.5 151.6 693.5 1003.8 68.7 2.1 65.7 70.3 0 0 0 0 Liguria 11 44.7 9.6 216 13.6 1.0 10.8 14.0 829.5 89.5 693.5 1058.5 70.9 3.0 64.6 75.6 84 30 24 121 Toscana 15 42.9 11.1 174 15.6 0.4 15.5 17.0 566.0 28.4 474.5 573.1 71.1 0.1 70.6 71.1 68 0 68 68 Lazio 24 42.0 12.7 369 15.0 0.9 13.6 16.4 661.6 77.3 584.0 839.5 73.1 1.5 69.7 76.4 80 32 38 136 Molise 10 41.8 14.7 397 15.7 1.0 14.3 16.5 627.8 109.9 547.5 803.0 73.6 1.6 72.6 76.4 76 34 32 102 Puglia 13 41.8 15.7 82 17.1 0.4 16.5 17.4 491.3 32.0 474.5 547.5 69.0 2.1 67.9 72.6 119 9 102 123 Sicilia 12 37.6 13.3 248 17.6 0.6 17.1 18.3 517.1 37.6 474.5 547.5 70.2 0.5 69.8 70.7 164 30 140 199 Sardegna 14 40.1 8.8 217 16.9 0.3 16.8 18.0 525.0 32.7 463.6 562.1 72.7 0.5 72.3 73.3 159 18 138 184
28
6.1.2. Statistical treatment of data
For isotopic data, mean values, standard deviation, minimum, maximum and the confidence interval (95%) were calculated. Pearson coefficients were calculated for isotope compositions against other climatic and geographical parameters. These values were compared with the critical value (F) for a confidence level of 95%. In the case of a significant correlation, the equation for the isotopic values and climatic factors was determined. Two-way ANOVA, applying Fisher’s test, was performed to determine if the distribution of the isotope parameters for the 2009, 2010 and 2011 was specific to the year of production. The data were statistically evaluated using Statistica 8 (StatSoft Italia s.r.l, Padova, Italy).
6.1.3. Results and Discussions
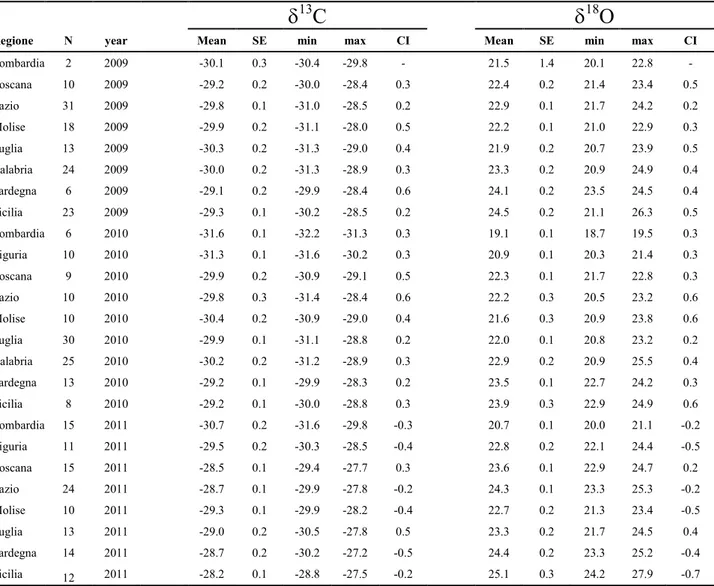
The mean δ13C and δ18O values for olive oil samples, along with the standard error, minimum and maximum, and confidence interval (CI) are shown in Table 4.
Table 4. Mean, Standard Error (SE), minimum and maximum values and 95% mean confidence interval (CI) of the δ13C and δ18O values for each region of oil origin, in different years production.
13C
18O
Regione N year Mean SE min max CI Mean SE min max CI
Lombardia 2 2009 -30.1 0.3 -30.4 -29.8 - 21.5 1.4 20.1 22.8 - Toscana 10 2009 -29.2 0.2 -30.0 -28.4 0.3 22.4 0.2 21.4 23.4 0.5 Lazio 31 2009 -29.8 0.1 -31.0 -28.5 0.2 22.9 0.1 21.7 24.2 0.2 Molise 18 2009 -29.9 0.2 -31.1 -28.0 0.5 22.2 0.1 21.0 22.9 0.3 Puglia 13 2009 -30.3 0.2 -31.3 -29.0 0.4 21.9 0.2 20.7 23.9 0.5 Calabria 24 2009 -30.0 0.2 -31.3 -28.9 0.3 23.3 0.2 20.9 24.9 0.4 Sardegna 6 2009 -29.1 0.2 -29.9 -28.4 0.6 24.1 0.2 23.5 24.5 0.4 Sicilia 23 2009 -29.3 0.1 -30.2 -28.5 0.2 24.5 0.2 21.1 26.3 0.5 Lombardia 6 2010 -31.6 0.1 -32.2 -31.3 0.3 19.1 0.1 18.7 19.5 0.3 Liguria 10 2010 -31.3 0.1 -31.6 -30.2 0.3 20.9 0.1 20.3 21.4 0.3 Toscana 9 2010 -29.9 0.2 -30.9 -29.1 0.5 22.3 0.1 21.7 22.8 0.3 Lazio 10 2010 -29.8 0.3 -31.4 -28.4 0.6 22.2 0.3 20.5 23.2 0.6 Molise 10 2010 -30.4 0.2 -30.9 -29.0 0.4 21.6 0.3 20.9 23.8 0.6 Puglia 30 2010 -29.9 0.1 -31.1 -28.8 0.2 22.0 0.1 20.8 23.2 0.2 Calabria 25 2010 -30.2 0.2 -31.2 -28.9 0.3 22.9 0.2 20.9 25.5 0.4 Sardegna 13 2010 -29.2 0.1 -29.9 -28.3 0.2 23.5 0.1 22.7 24.2 0.3 Sicilia 8 2010 -29.2 0.1 -30.0 -28.8 0.3 23.9 0.3 22.9 24.9 0.6 Lombardia 15 2011 -30.7 0.2 -31.6 -29.8 -0.3 20.7 0.1 20.0 21.1 -0.2 Liguria 11 2011 -29.5 0.2 -30.3 -28.5 -0.4 22.8 0.2 22.1 24.4 -0.5 Toscana 15 2011 -28.5 0.1 -29.4 -27.7 0.3 23.6 0.1 22.9 24.7 0.2 Lazio 24 2011 -28.7 0.1 -29.9 -27.8 -0.2 24.3 0.1 23.3 25.3 -0.2 Molise 10 2011 -29.3 0.1 -29.9 -28.2 -0.4 22.7 0.2 21.3 23.4 -0.5 Puglia 13 2011 -29.0 0.2 -30.5 -27.8 0.5 23.3 0.2 21.7 24.5 0.4 Sardegna 14 2011 -28.7 0.2 -30.2 -27.2 -0.5 24.4 0.2 23.3 25.2 -0.4 Sicilia 12 2011 -28.2 0.1 -28.8 -27.5 -0.2 25.1 0.3 24.2 27.9 -0.7
29 The range of variation in δ13C mean was about 3.5‰, (-31.6‰ to -28.2‰). A wider range was found for 18O mean = 6‰, ranging from 19.1‰ to 25.1‰).
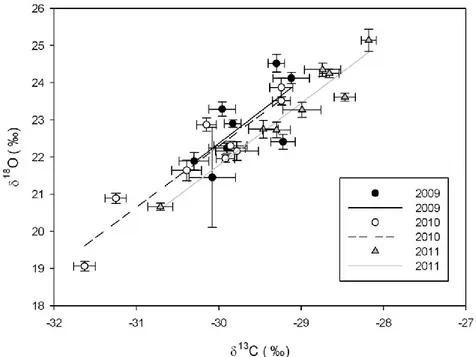
Correlation of δ18O vs δ13C for means from olive oil samples, collected in different regions during 2009, 2010 and 2011, are plotted in Figure 8.
Fig. 8. Relationships between the δ13C and δ18O mean values of olive oil samples collected in different regions during the years 2009, 2010 and 2011. Error bars indicate S.E.
Correlation coefficients (r) between δ18O and δ13C were 0.70 for 2009, 0.90 for 2010 and 0.96 for 2011. The relatively low r obtained in 2009 is probably due to the limited number of samples available from Northern Italy (Table 4). Nevertheless, the correlation was always significant for each year. Therefore, one or more environmental and/or geographical factors influenced both the isotopic variables.
According to the dual-isotopes conceptual model of Scheidegger et al. (2000), a stomatal response to environmental drivers should be reflected in a positive relationship between 13C and 18O in plant material. Hence, the enrichment in 13C and 18O in olives growing in drought prone sites (southern regions) can be due to both environmental factors (such as temperature and precipitation) and plant-related parameters (such as stomatal conductance) and highlights a strong genotype x environment interaction. In fact Italian oils from northern regions had significantly lower isotope ratios than those from southern regions, due to higher precipitation and lower temperatures (Table 3).
The markedly dry Mediterranean climate in Sicily caused 18O values up to 27.9‰ in 2011 as well as relatively high 13C values (up to -27.5‰), indicating the effect of drought and related