A R T I C L E
O p e n A c c e s s
Ceramide-induced BOK promotes
mitochondrial
fission in preeclampsia
Jonathan Ausman
1,2, Joelcio Abbade
1,3, Leonardo Ermini
1, Abby Farrell
1,2, Andrea Tagliaferro
1, Martin Post
2,4,5and
Isabella Caniggia
1,2,4,6Abstract
Mitochondria are in a constant balance of fusing and dividing in response to cellular cues. Fusion creates healthy
mitochondria, whereasfission results in removal of non-functional organelles. Changes in mitochondrial dynamics
typify several human diseases. However, the contribution of mitochondrial dynamics to preeclampsia, a hypertensive disorder of pregnancy characterized by placental cell autophagy and death, remains unknown. Herein, we show that
the mitochondrial dynamic balance in preeclamptic placentae is tilted towardfission (increased DRP1 expression/
activation and decreased OPA1 expression). Increased phosphorylation of DRP1 (p-DRP1) in mitochondrial isolates from preeclamptic placentae and transmission electron microscopy corroborated augmented mitochondrial
fragmentation in cytotrophoblast cells of PE placentae. Increasedfission was accompanied by build-up of ceramides
(CERs) in mitochondria from preeclamptic placentae relative to controls. Treatment of human choriocarcinoma JEG3
cells and primary isolated cytrophoblast cells with CER 16:0 enhanced mitochondrialfission. Loss- and gain-of-function
experiments showed that Bcl-2 member BOK, whose expression is increased by CER, positively regulated p-DRP1/DRP1
and MFN2 expression, and localized mitochondrialfission events to the ER/MAM compartments. We also identified
that the BH3 and transmembrane domains of BOK were vital for BOK regulation offission. Moreover, we found that
full-length PTEN-induced putative kinase 1 (PINK1) and Parkin, were elevated in mitochondria from PE placentae, implicating mitophagy as the process that degrades excess mitochondria fragments produced from CER/BOK-induced fission in preeclampsia. In summary, our study uncovered a novel CER/BOK-induced regulation of mitochondrial fission and its functional consequence for heightened trophoblast cell autophagy in preeclampsia.
Introduction
Mitochondria are critical organelles that provide energy
through oxidative phosphorylation1 and coordinate cell
death via intrinsic apoptosis2. These‘powerhouses’ are in
a constant physiological balance of dividing and fusing; processes collectively known as mitochondrial dynamics. Mitochondrial fusion is a process that forms healthier and functional organelles from fragments with intact inner
mitochondrial membrane (IMM) potentials3. Optic
atrophy 1 (OPA1) and mitofusin 1 and 2 (MFN1/2) are key proteins involved in mitochondrial fusion that are responsible for bringing together the IMMs and outer mitochondrial membranes (OMMs) where they reside,
respectively4,5. Alternatively, during fission, unhealthy,
non-functional mitochondrial fragments, lacking trans-membrane potentials, are discarded and targeted for degradation via a selective autophagic process termed mitophagy. The latter is dependent on the accumulation of phosphatase and tensin homolog (PTEN)-induced kinase 1 (PINK1) in the OMM, which recruits the E3
ubiquitin ligase Parkin, leading to mitophagy6.
Central to mitochondrialfission is the dynamin-related
protein 1 (DRP1), an 80 kDa GTPase7. The activation of
DRP1 occurs as a result of a number of post-translational © The Author(s) 2018
Open Access This article is licensed under a Creative Commons Attribution 4.0 International License, which permits use, sharing, adaptation, distribution and reproduction in any medium or format, as long as you give appropriate credit to the original author(s) and the source, provide a link to the Creative Commons license, and indicate if
changes were made. The images or other third party material in this article are included in the article’s Creative Commons license, unless indicated otherwise in a credit line to the material. If
material is not included in the article’s Creative Commons license and your intended use is not permitted by statutory regulation or exceeds the permitted use, you will need to obtain
permission directly from the copyright holder. To view a copy of this license, visithttp://creativecommons.org/licenses/by/4.0/.
Correspondence: Isabella Caniggia ([email protected]) 1
Lunenfeld-Tanenbaum Research Institute, Sinai Health System, Toronto, ON M5T 1X5 Canada
2
Institute of Medical Science, University of Toronto, Toronto, ON, Canada Full list of author information is available at the end of the article Edited by P. Pinton
1234567890()
:,;
1234567890(
modification events, most importantly phosphorylation of DRP1 (p-DRP1) at specific serine residue 616 leads to its activation and recruitment to the OMM where it interacts
with resident proteins such as mitochondrialfission factor
(MFF). This is followed by p-DRP1 oligomerization8and
consequent hydrolysis of GTP by active DRP1 providing
the mechanic–enzymatic force by which fission occurs9.
Typically mitochondrialfission occurs in highly metabolic
subcellular regions termed mitochondria-associated
endoplasmic reticulum membranes (MAMs)10.
Interest-ingly, in addition to its role in mitochondrial fusion,
MFN2 also plays a role in fission as this protein tethers
together the mitochondria and endoplasmic reticulum
(ER) forming the MAM11.
In humans, excessive mitochondrial fission has been
implicated in the pathogenesis of several diseases12.
Drp1−/− mice exhibit embryonic lethality due to
defi-ciency in the formation of trophoblast giant cells and consequent placental dysfunction, underscoring the
requirement of mitochondrialfission for proper placental
and embryonic development13.
Preeclampsia (PE) is a serious disorder that complicates
5–8% of pregnancies worldwide and represents a significant
cause of maternal and fetal morbidity and mortality14,15. PE
is typically characterized by excessive trophoblast cell death, generating a syncytial debris that is aberrantly extruded into the maternal circulation where it exerts a generalized endothelial inflammatory response clinically manifesting as
hypertension16. To date, the involvement of mitochondrial
dynamics in PE remains elusive.
We have reported that excessive cell death and autophagy in PE are in part dependent on a build-up of ceramides
(CERs), a group of bioactive sphingolipids17. The
accumu-lation of CER in PE has been shown to increase the expression of Bcl-2-related ovarian killer (BOK), a pro-apoptotic Bcl-2 family member, leading to increased
tro-phoblast autophagy and death17,18. The altered MCL-1/
BOK balance toward pro-death BOK has been implicated in
the pathogenesis of PE19, although, to date, this has not
been evaluated in the context of mitochondrialfission.
Herein, we report increased expression of key regulators
of mitochondrialfission in PE. Furthermore, we attributed
CER accumulation as a regulator of increased
mitochon-drial fission, through a novel mechanism involving BOK.
Finally, we localized mitochondrial fission events to the
ER/MAM compartments and show that the degradation of mitochondrial fragments in PE is occurring by PINK1/ Parkin-mediated mitophagy.
Results
Mitochondrialfission is increased in PE
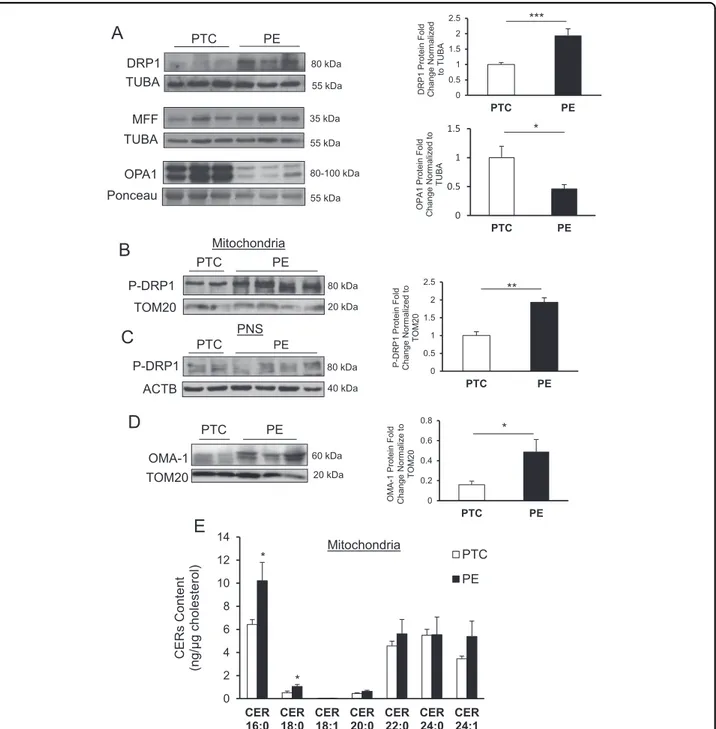
We first examined the expression of DRP1, a key
reg-ulator of fission12, in placental tissues from PE and
nor-motensive control pregnancies. Western blot (WB) analysis
revealed significantly increased DRP1 levels in PE placentae
relative to preterm controls (PTCs) (Fig. 1a, upper panel).
Following its activation, DRP1 is recruited to MFF, a
OMM-resident protein20. WB showed no changes in MFF
levels in PE relative to PTC placentae (Fig. 1a, middle
panel). We next examined the expression of OPA1, a key
marker of fusion. WB analysis demonstrated a significant
decrease in OPA1 expression in PE compared with PTC
placentae (Fig. 1a, lower panel). Activation of DRP1 by
phosphorylation at S616 residue is required for its
mito-chondrial recruitment where it triggers fission events8.
Therefore, we isolated mitochondria from PE and PTC placentae and examined DRP1 activation using a specific antibody that recognizes phosphorylated DRP1 at S616 (p-DRP1). WB showed a significant increase of p-DRP1 in mitochondrial isolates (MIs) from PE relative to MI har-vested from PTC placentae. Phosphorylated DRP1 levels were normalized to TOM20, a marker of the OMM
(Fig.1b). The post-nuclear supernatant (PNS), collected for
comparison, showed no changes in p-DRP1 expression
between the PNS of PTC and PE (Fig. 1c). Loss of
mito-chondrial membrane potential due to stress leads to the accumulation and activation of a peptidase termed OMA-1 that mediates OPA1 proteolytic cleavage thereby inhibiting
mitochondrial fusion21,22. Hence, we examined OMA-1
content in MI using an antibody that recognizes the 60 kDa
active form. WB revealed a significant increase in OMA-1
content in MI from PE compared with PTC (Fig. 1d),
indicating that reduced OPA1 levels could be due to increased OMA-1 activity in the IMM. CER is a cell death
inducer in PE leading to increased trophoblast autophagy17.
Thus, we examined the CER content of MI from PE and PTC placentae using tandem mass spectrometry. A sig-nificant enrichment in CER 16:0 and CER 18:0 was
observed in MI from PE relative to PTC placentae (Fig.1e).
Transmission electron microscopy (TEM) was employed for qualitative surveillance of mitochondrial morphology.
Mitochondrialfission was identified by clear contact points
between adjacent organelles and smaller globular mito-chondrial fragments, in contrast to the elongated ovular morphology typical of healthy mitochondria, which exist in
branching networks23. Augmented mitochondrial fission
events were observed in cytotrophoblast cells from PE
compared with PTC (Fig.2a, i vs. ii). There was a twofold
increase in the number of mitochondria per cytotrophoblast
in PE compared with PTC (Fig. 2a, iii vs. iv; Fig. 2b). In
addition, mitochondria from PE exhibited a significantly smaller mitochondrial width when compared with PTC
(Fig.2a, v vs. vi; Fig.2c).
CER increases DRP1 expression and activation
The presence of increased cytosolic, lysosomal,17 and
mitochondrial CER in PE placentae prompted us to investigate the involvement of CER in mediating
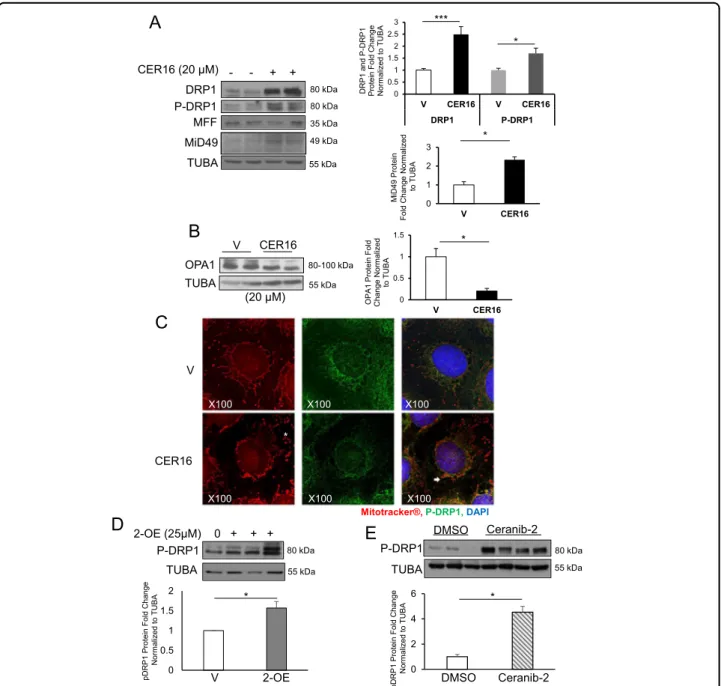
mitochondrial fission. DRP1 expression and
phosphor-ylation were significantly increased in JEG3 cells following
a 6-h treatment with 20 µM CER 16:0 relative to EtOH
vehicle (Fig. 3a). CER 16:0 dosage and time were
opti-mized in pilot experiments (Supplemental Fig. 1a). Similar to PE placentae, no changes in MFF expression levels
A
PTC PE DRP1 TUBA 80 kDa 55 kDa 35 kDa 55 kDa MFF TUBAB
C
OPA1 Ponceau 80-100 kDa 55 kDa P-DRP1 TOM20 80 kDa 20 kDa PTC PE 0 0.5 1 1.5 2 2.5 PTC PE D R P1 Pr o te in Fold Change Norm ali z ed to T U BA *** PTC PE 80 kDa 40 kDa P-DRP1 ACTB * 0 0.5 1 1.5 2 2.5 PTC PE P-D R P1 Pr o te in Fold Change Norm ali z ed to TOM 2 0 **E
0 2 4 6 8 10 12 14 CER 16:0 CER 18:0 CER 18:1 CER 20:0 CER 22:0 CER 24:0 CER 24:1 CERs Conte n t )lor et s el o h c g μ/ g n( PTC PE * * 0 0.5 1 1.5 PTC PE OPA 1 P rot ein Fold Change Norm ali z ed to TUBA Mitochondria PNS MitochondriaD
PTC PE TOM20 OMA-1 60 kDa 20 kDa 0 0.2 0.4 0.6 0.8 PTC PE * OM A-1 Pro tein Fo ld Change Norm ali z e to TOM 2 0Fig. 1 Changes in mitochondrial dynamics in preeclampsia associates with mitochondrial accumulation of ceramide. Representative western blots and associated densitometry of DRP1 (a, upper panel), MFF (a, middle panel), and OPA1 (a, lower panel) in PE vs. PTC. DRP1 WB and densitometry: PE, n= 30; PTC, n = 22; unpaired Student’s t-test ***P < 0.001. MFF WB: PE, n = 18; PTC, n = 9; unpaired Student’s t-test P = ns. OPA1 WB and densitometry: PE, n= 13; PTC, n = 10; unpaired Student’s t-test *P < 0.05). b Representative western blots and associated densitometry of p-DRP1 in mitochondria isolated from PE and PTC placentae (PE, n= 4; PTC, n = 4; unpaired Student’s t-test **P < 0.01). c p-DRP1 expression in the post-nuclear supernatant of PE vs. PTC placentae (PE, n= 4; PTC, n = 4). d OMA-1 expression in mitochondria isolated from PE and PTC placentae (PE, n= 8; PTC, n = 7; unpaired Student’s t-test *P < 0.05). e Ceramide levels normalized to cholesterol in mitochondria isolated from PE and PTC placentae as assessed by LC-MS/MS (PE, n= 4; PTC, n = 4; unpaired Student’s t-test *P < 0.05). All data are expressed as mean ± SEM (standard error of the mean)
A
PTC PE 29 Weeks 29 Weeks 30 Weeks vB
vi i ivC
ii*
*
*
N iii N ** 0 100 200 300 400 500 PTC PE M it o c h ondr ial W idt h (n m ) * 0 5 10 15 20 25 30 PTC PE r e P air d n o h c oti M f o r e b m u N Cyt o tr ophoblas t 500 nm 500 nm 1 μm 1 μm 100 nm 100 nmFig. 2 Preeclampsia is associated with mitochondrialfission morphology in cytotrophoblast cell. a Representative TEM images of cytotrophoblast cells from PE and PTC placentae from 29 to 30 weeks gestation. (i) Canonical mitochondrial morphology in PTC is identified by white arrows (scale bar: 500 nm), and (ii) mitochondrialfission events in PE are denoted by white stars (N, nucleus; scale bar: 500 nm). (iii/iv) Mitochondria in PE and PTC are indicated by white arrows (N, nucleus; scale bar: 1 µm). (v/vi) mitochondrial width is denoted by white dotted lines (scale bar: 100 nm). b Mitochondrial number per cell in PE vs. PTC (PE placentae, n= 8 (167 mitochondria); PTC placentae, n = 7 (63 mitochondria); unpaired Student’s t-test *P < 0.05), and c mitochondrial width in PE vs. PTC (PE, n= 8; PTC, n = 7 separate tissue samples; unpaired Student’s t-test **P < 0.01). Data are expressed as mean ± SEM (standard error of the mean)
were observed following CER 16:0 exposure (Fig. 3a). However, the content of another adaptor protein that
recruits cytosolic DRP1 to the mitochondria, MiD4924,
was increased in cells exposed to CER 16:0 (Fig. 3a).
Interestingly, CER 16:0 markedly decreased OPA1
expression in JEG3 cells (Fig. 3b). Immunofluorescence
(IF) analysis showed a striking redistribution and coloca-lization of p-DRP1 to the mitochondria (Mitotracker®
Red) in JEG3 cells treated with CER 16:0 (Fig. 3c).
Mitochondria from CER 16:0-treated JEG3 cells displayed a fragmented, globular morphology consistent with
increased mitochondrial fission, when compared with
OPA1 80-100 kDa 55 kDa TUBA V CER16 0 0.5 1 1.5 2 2.5 3 V CER16 V CER16 DRP1 P-DRP1 DRP 1 and P -DRP 1 P rot
ein Fold Change
Norm ali z ed t o TUB A *** * 0 0.5 1 1.5 V CER16 OPA 1 P rot ein Fold Change Norm al iz ed to TU BA *
B
C
V CER16 Mitotracker®, P-DRP1, DAPI * X100 X100 X100 X100 X100 X100 55 kDaA
MFF 35 kDa CER16 (20 μM) DRP1 TUBA 80 kDa 80 kDa P-DRP1 MiD49 49 kDa 0 1 2 3 V CER16 * M iD49 Prot ein Fold Change Norm ali z ed to TU BA P-DRP1 TUBA 2-OE (25μM) 0 + + +D
80 kDa 55 kDa P-DRP1 TUBA DMSO Ceranib-2E
80 kDa 55 kDa 0 0.5 1 1.5 2 V 2-OE 0 2 4 6 Ceranib-2 DMSO * * e g n a h C dl o F ni et or P 1 P R D p Norm ali z ed t o TUB A pDRP 1 P rot ein Fold Change N o rm a liz e d to TU BA - - + + (20 μM)Fig. 3 CER stimulates DRP1 expression and activation while reducing OPA1 levels in JEG3 cells. a Representative western blots of DRP1, p-DRP1, MFF, and MiD49 in JEG3 cells treated with CER 16:0 or EtOH vehicle (V) and associated densitometry (n= 10 separate experiments in duplicate; unpaired Student’s t-test *P < 0.05, ***P < 0.001). (b) Representative western blot of OPA1 in JEG3 cells treated with CER 16:0 or ETOH vehicle (n = 3 individual experiments in duplicate; unpaired Student’s t-test *P < 0.05). Data are expressed as mean ± SEM (standard error of the mean). c IF analysis of p-DRP1 in JEG3 cells treated with CER 16:0 or EtOH vehicle (V) and labeled with Mitotracker®. p-DRP1 (green), Mitotracker® (red), and nuclear DAPI (blue). d Representative western blot and densitometric analysis of p-DRP1 in JEG3 cells treated with 2-OE (25 µM) or control vehicle (n= 3 separate experiments; unpaired Student’s t-test *P < 0.05). e Immunoblotting of p-DRP1 and associated densitometry in placentae from CD1 mice injected with ceranib-2 (20 mg/kg), or DMSO vehicle (DMSO, n= 8; Ceranib-2, n = 9; *P < 0.05)
cells treated with EtOH vehicle demonstrating
mito-chondria networks radiating from the nucleus (Fig. 3c).
To further examine the contribution of CER in
mito-chondrial fission, we used 2-oleoylethanolamine (2-OE),
an inhibitor of ASAH1 activity25that increases autophagy
in JEG3 cells17. Exposure of JEG3 cells to 25 µM 2-OE
resulted in a significant increase in p-DRP1 levels
(Fig. 3d). Similarly, administration of another ASAH1
inhibitor, Ceranib-2, to pregnant mice, which we showed to elevate CER content in the murine placentae similar to
that found in PE placentae17, led to a significant increase
in placental p-DRP1 (Fig.3e).
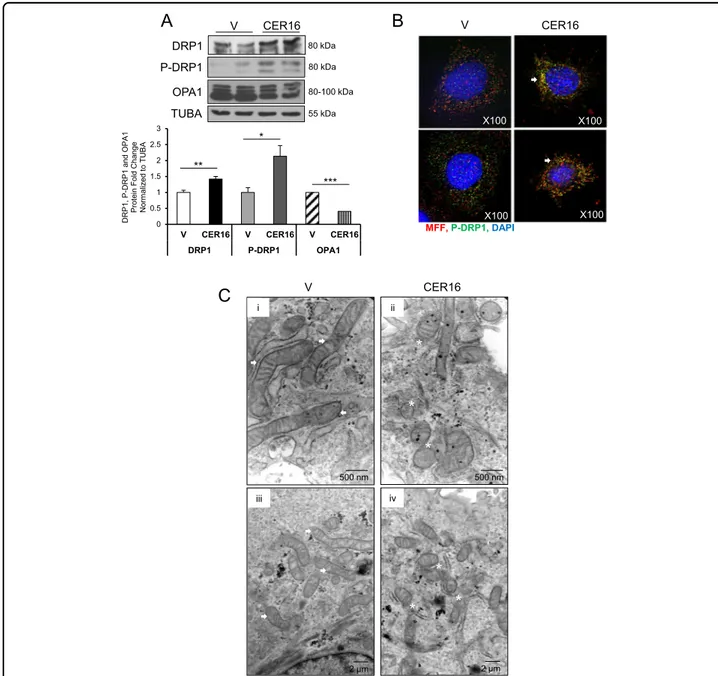
Similar to JEG3 cells, CER 16:0 treatment of primary isolated cytotrophoblasts resulted in a significant increase in both p-DRP1 and DRP1 relative to ETOH vehicle
(Fig. 4a, upper and middle panels), and this associated
with a decrease in OPA1 levels (Fig.4a, lower panel). IF
analysis showed that following CER 16:0 treatment, phosphorylated DRP1 was recruited to MFF on the OMM
of primary isolated trophoblasts (Fig. 4b). p-DRP1
asso-ciation with MFF following CER 16:0 treatment was
corroborated by a Pearsons’ correlation coefficient (PCC)
of 0.50 for the twofluorphores. In addition, TEM analysis
in sections from primary isolated trophoblasts treated with CER 16:0 established the presence of increased
globular mitochondrial fragments and fission events,
when compared with the network-like mitochondria
observed in controls (Fig.4c).
CER augments BOK-induced DRP1 expression
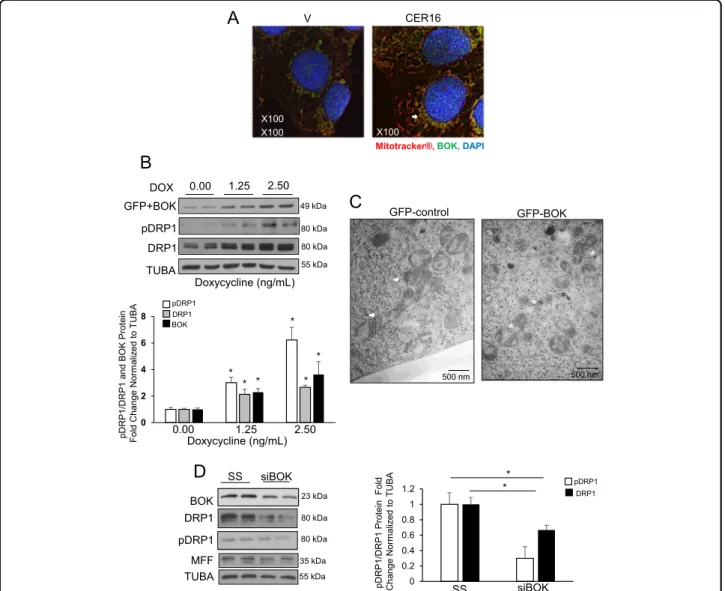
We have reported that CER-induced BOK is responsible
for elevated trophoblast cell death and autophagy in PE17.
CER 16:0 treatment triggered the expression and recruitment of BOK to the mitochondria in JEG3 cells
(Fig. 5a). To examine the role of BOK in mitochondrial
fission, we used an established human embryonic kidney 293 (HEK-293) Flp-In T-Rex cell system that allowed for the controlled expression of BOK upon doxycycline (Dox)
stimulation26. Induction of BOK using Dox resulted in a
significant increase in p-DRP1, DRP1, and BOK
expres-sion (Fig. 5b). Electron microscopy of GFP-BOK
HEK-293-expressing cells revealed the presence of smaller,
globular mitochondria, actively undergoingfission when
compared with the larger mitochondria with well-defined
cristae seen in the controls (Fig. 5c). Small interfering
RNA (siRNA) knockdown of BOK in HEK-293 cells showed a significant decrease in p-DRP1, DRP1 levels
compared with a scrambled control (Fig.5d). Addition of
CER 16:0 to cells following BOK siRNA treatment did not abrogated the knockdown effect on DRP1 (Supplemental Fig. 1b).
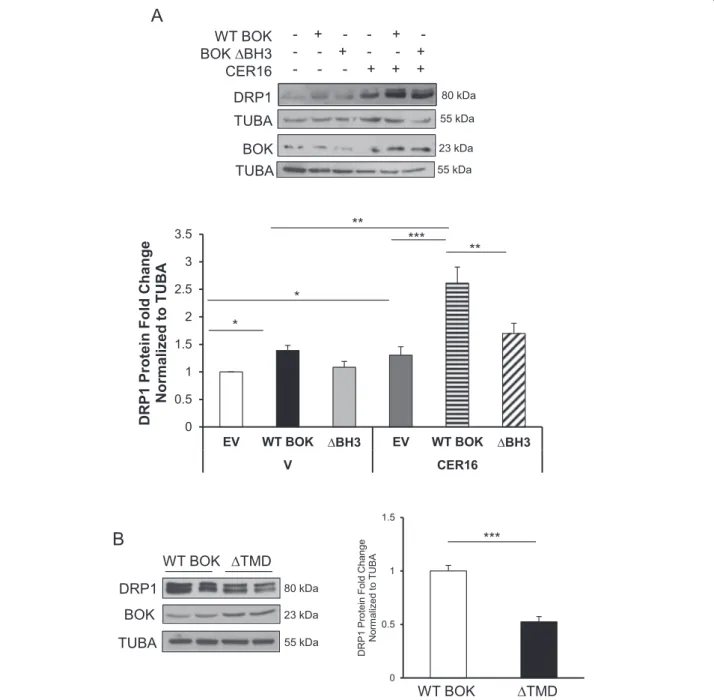
To establish the relative contribution of the BH3
domain in mediating BOK’s effects on DRP1 expression,
we transiently transfected HEK-293 cells with a
plasmid-overexpressing BOK with a 17 base-pair deletion of the BH3 domain (ΔBH3). In line with our inducible model, we found increased p-DRP1 and DRP1 levels in HEK-293 cells following transient overexpression of wild-type (WT)
BOK relative to empty vector (EV) control (Fig. 6a and
Supplemental Fig. 1c). In addition, CER 16:0 treatment
further significantly augmented DRP1 expression in cells
overexpressing WT BOK (Fig.6a). Transient transfection
of BOK,ΔBH3 resulted in significant less DRP1
expres-sion compared with WT BOK (Fig. 6a). Beside the BH3
domain, BOK also contains a C-terminus transmembrane domain (TMD) that is critical for its mitochondrial
translocation27 and depolarization. To ascertain its
rele-vance on mitochondrial fission, we generated
Dox-inducible HEK-293 cells that overexpress BOK with a deleted TMD. A significant decrease in DRP1 and p-DRP1 levels was observed in cells upon Dox induction that
lacked the TMD relative to WT BOK controls (Fig.6b and
Supplemental Fig. 1C).
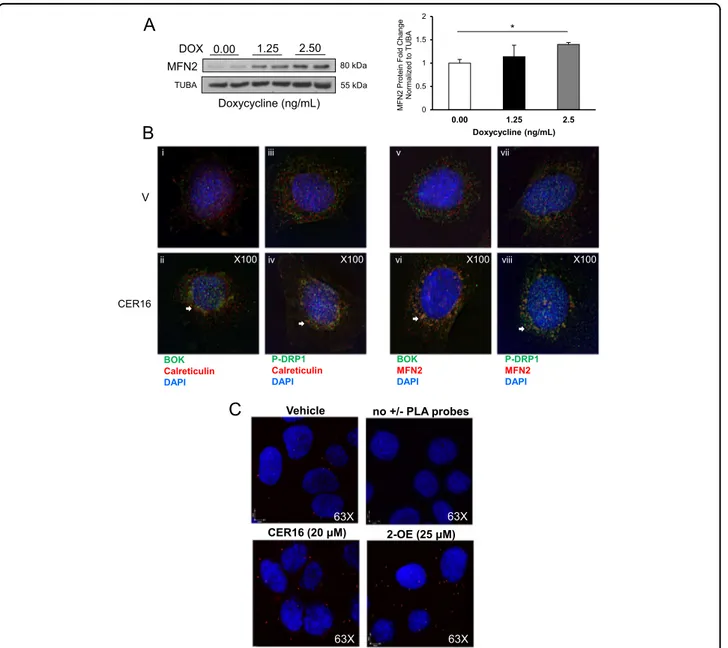
CER induces BOK association with p-DRP1 at the MAMs The MAMs are enriched in glycosphingolipids and represent the microenvironment that enables
mitochon-drialfission28. Tethering of the mitochondria to the ER is
essential for MAM formation that requires MFN229. BOK
induction by Dox in HEK-293 cells stably transfected with
GFP-BOK (Fig. 5b) resulted in increased MFN2
expres-sion (Fig.7a). Treatment of primary trophoblast cells with
CER 16:0 resulted in a striking appearance of BOK and p-DRP1 in the ER/MAM compartments relative to control
vehicle (Fig.7b, i–iv) as assessed by calreticulin IF staining
(MAM/ER marker) and association of both proteins with
MFN2 (Fig.7b, v–viii). Mean fluorescence intensity (MFI)
analysis revealed an increase in p-DRP1 (1.78-fold), BOK (1.32-fold), and MFN2 (1.32-fold) in CER 16-treated cells relative to control vehicle. To convincingly demonstrate the importance of CER in promoting mitochondria-ER tethering, we employed in situ proximity ligation assay targeting voltage-dependent anion channel (VDAC1) and inositol 1,4,5-trisphosphate receptor (IP3R), two proteins
found at the MAM interface30. Following a 6-h treatment
with either CER 16:0 (20μM) or 2-OE (25 μM) in JEG3
cells, we found a marked increase in the number of
VDAC1/IP3R interactions points (Fig.7c), indicating that
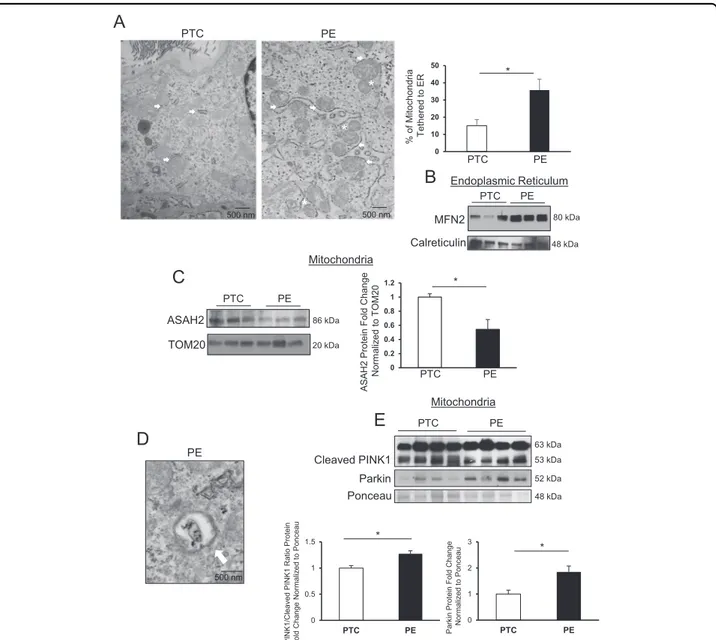
excess CER increases mitochondria–ER tethering. TEM analysis of PE placentae showed a significant
increase in the presence of mitochondrialfission events in
close proximity to the ER compared with PTC (Fig.8a). In
line with our observations of MFN2 accumulation in the ER of primary cells following CER 16:0 exposure, WB revealed increased MFN2 content in ER of PE placentae
relative to PTC (Fig. 8b). No significant changes in
dif-ferent CER species were detected in MAM isolated from PE and PTC placentae (Supplemental Fig. 2). Our data
indicates that CER accumulation in PE that is responsible
for mitochondrial fission pertains to the mitochondria
(Fig. 1e) and not to the ER/MAM. We next examined
whether the increase in mitochondrial CER was due to changes in one of its regulatory enzymes, neutral cer-amidase (ASAH2). Immunoblotting revealed decreased
levels of ASAH2 (Fig. 8c) in mitochondria from PE
pla-centae relative to PTC, suggesting that CER breakdown
via ASAH2 is decreased in PE mitochondria leading to CER accumulation.
Mitophagy is a selective autophagic process that degrades non-functional mitochondrial fragments
pro-duced by fission31. TEM analysis of PE placentae
identi-fied mitophagy in cytotrophoblast cells (Fig.8d). PINK1 is
63 kDa mitochondrial protein that is cleaved by PARL to an inactive 53 kDa isoform in the IMM; however, in
V CER16
B
MFF, P-DRP1, DAPIA
V CER16 DRP1 TUBA 80 kDa 55 kDa P-DRP1 80 kDa OPA1 80-100 kDa 0 0.5 1 1.5 2 2.5 3V CER16 V CER16 V CER16
DRP1 P-DRP1 OPA1 P , 1 P R D-1 A P O d n a 1 P R D e g n a h C dl o F ni et or P A B U T ot d e zil a mr o N * ** *** V CER16 iv
*
*
*
iii i ii*
*
*
C
X100 X100 X100 X100 500 nm 500 nm 2 μm 2 μmFig. 4 Ceramide induces mitochondrialfission in primary isolated trophoblast cells. a Representative western blots of DRP1, p-DRP1, and OPA1 and associated densitometry in primary isolated cytotrophoblast cells treated with CER 16:0 or EtOH vehicle (V) (n= 3 different primary cell isolations; *P < 0.05, **P < 0.01, ***P < 0.001; Data are expressed as mean ± SEM: standard error of the mean). b IF analysis of p-DRP1 (green) and MFF (red) in primary isolated cytotrophoblast cells following exposure to CER 16:0 or EtOH vehicle (V). Nuclei were stained with DAPI (blue). c Representative TEM of primary isolated cytotrophoblast cells from term placentae treated with CER 16:0 or ETOH vehicle (n= 5 different primary cell isolations). (i/iii) Mitochondrial morphology in vehicle-treated cells is identified by white arrows (scale bar: (i) 500 nm; (iii) 2 µm); (ii/iv) mitochondrial fission events and fragments in CER 16:0-treated cells are identified by white stars (scale bar: ii) 500 nm; (iv) 2 µm)
damaged mitochondrial fragments, PINK1 cleavage is inhibited, and its 63 kDa isoform accumulates on the OMM where it phosphorylates cytoplasmic Parkin and ubiquitin resulting in the recruitment of the mitophagic
machinery to carry out degradation32. Hence, we
deter-mined the PINK163kDa/PINK153kDaratio in MIs from PE
and PTC placentae and found a significant increase in the pro-mitophagy 63kDa isoform relative to the non-active
cleaved 53 kDa isoform in PE (Fig. 8e). Furthermore,
immunoblotting showed increased mitochondrial Parkin
levels in PE relative to PTC mitochondria (Fig.8e).
Discussion
In the present study, we demonstrate that
mitochon-drial fission occurs in the human placenta, and is
aug-mented in PE. Furthermore, we show that CERs play a
critical role in mitochondrialfission via a mechanism that
involves BOK, a pro-apoptotic member of the Bcl-2 family. We identified the MAM as the microenvironment in which the interplay between BOK and key players of
mitochondrial fission occurs, and that mitophagy is a
cellular defense that removes excess mitochondrial frag-ments in PE. GFP-control GFP-BOK
*
*
*
55 kDa 23 kDa MFF 35 kDa DRP1 TUBA BOK 80 kDa SS siBOKD
A
V CER16Mitotracker®, BOK, DAPI
* X100 500 nm 500 nm 80 kDa 80 kDa pDRP1
B
55 kDa DRP1 TUBA 80 kDa GFP+BOK 49 kDa 0.00 1.25 2.50 Doxycycline (ng/mL) DOX X100 pDRP1 0 2 4 6 8 X100 Doxycycline (ng/mL) 0.00 1.25 2.50 1 P R D/ 1 P R D p K O B d n an i et or P e g n a h C dl o F d e zil a mr o NA B U T ot pDRP1 DRP1 BOKC
0 0.2 0.4 0.6 0.8 1 1.2 pDRP1/DRP1 Protei n Fol d Change Norm al iz ed to T U BA SS siBOK * pDRP1 DRP1 * * * * * *Fig. 5 CER augments BOK-induced DRP1 expression leading to mitochondrial fragmentation. a IF analysis of BOK (green) in JEG3 cells treated with CER 16:0 or EtOH vehicle (V), and stained with Mitotracker® (red) and DAPI (blue). b Representative western blot and associated densitometry of BOK, p-DRP1, and DRP1 in HEK-293 cells stably transfected with GFP-BOK and induced with doxycycline (Dox 0, 1.25, or 2.5 ng/mL, n= 3 individual experiments carried out in duplicate; one-way ANOVA, Tukey’s post-test *P < 0.05, **P < 0.01). c Representative TEM images of HEK-293 cells stably transfected with GFP-BOK and induced with 2.5 ng/ml Dox (right panel) or treated with dH2O (control: left panel). Healthy mitochondrial morphology is indicated by white arrows, whereas mitochondrialfission events are depicted by white stars (scale bar: 500 nm; Dox 0 (vehicle control) and 2.5 ng/ mL, n= 3 separate experiments). d Representative western blots and densitometric analysis of BOK, p-DRP1, DRP1, and MFF expression in HEK-293 cells following transient transfection with BOK siRNA or a scrambled sequence (SS); n= 3 separate experiments run in duplicate; unpaired Student’s t-test (*P < 0.05)
Excessive DRP1-driven mitochondrialfission has been implicated in the pathogenesis of several human diseases, where accumulation of fragments with impaired mito-chondria membrane potentials increases reactive oxygen species generation that overwhelms the inadequate
anti-oxidant defenses33. Fission can participate in pathways
leading to cell death, as seen in post myocardial infarction
and in heritable juvenile Parkinsonism12, conditions
associated with release of Ca2+ and34loss of glutathione
antioxidant defense35. PE placentae exhibit shallow
tro-phoblast invasion and impaired transformation of
maternal spiral arteries, which render the placenta
vul-nerable to hypoxia/oxidative stress16. Herein, we
identi-fied increased DRP1 expression, phosphorylation, and WT BOK ∆TMD DRP1 80 kDa TUBA 55 kDa
B
BOK 23 kDa 0 0.5 1 1.5 DRP 1 P rotein Fold Change
Norm ali z ed t o TUB A *** * 0 0.5 1 1.5 2 2.5 3 3.5 EV WT BOK ∆BH3 EV WT BOK ∆BH3 V CER16 e g n a h C dl o F ni et or P 1 P R D A B U T ot d e zil a mr o N ** *** * ** WT BOK ∆TMD
A
DRP1 80 kDa WT BOK BOK ∆BH3 CER16 TUBA 55 kDa - + -- - + - - -- + -- - + + + + TUBA BOK 23 kDa 55 kDaFig. 6 BH3 and TMD domains are responsible for BOK-induced mitochondrialfission. ) Representative western blots of DPR1 and BOK in HEK-293 cells transfected with plasmids containing empty vector (EV), WT BOK, and BOK-ΔBH3, following exposure to CER 16:0 or EtOH vehicle (V). (a, lower panel) Densitometric analysis of DRP1 in HEK-293 cells transfected with EV, WT BOK, and BOK-ΔBH3, following exposure to CER 16:0 or V, (n = 4 different experiments; one-way ANOVA, Tukey’s post-test *P < 0.05). b Representative western blot of DRP1 and BOK in HEK-293 cells stably transfected with inducible GFP-BOK-ΔTMD with associated densitometry for DRP1 (Dox 0 (vehicle) and 2.5 ng/mL, n = 3 individual experiments in duplicate, ***P < 0.001)
augmented mitochondrialfission events in placentae from pregnancies complicated by early onset PE, which we
previously reported to have impaired oxygen sensing36
and elevated hypoxia-inducible factor 1-alpha (HIF1A)
expression37. It should be noted that mitochondrial
dynamics involve a balance between mitochondrialfission
and fusion. In pulmonary arterial hypertension, increased
HIF1A promotes DRP1-driven mitochondrial fission and
fragmentation in human lung and pulmonary arterial
smooth muscle cells, while decreasing MFN2 activity38.
Loss of the fusion regulator OPA1 in HeLa cells has been found to alter mitochondrial membrane integrity and cristae remodeling, leading to increased mitochondrial
fragmentation and apoptosis39. Conversely, transfection
of HL-1 cells with mutant Drp1(K38A) abrogates mito-chondrial fragmentation in a similar manner as MFN1
A
2.50 MFN2 TUBA 80 kDa 55 kDa 0.00 1.25 Doxycycline (ng/mL) DOX 0 0.5 1 1.5 2 0.00 1.25 2.5 M F N2 P rot ein Fold Change Norm al iz ed t o T U B A Doxycycline (ng/mL) * BOK Calreticulin DAPI P-DRP1 Calreticulin DAPI BOK MFN2 DAPI P-DRP1 MFN2 DAPI V CER16 ii iii iv v vi vii viii iB
X100 X100 X100 X100 X100 X100 X100 X100 Vehicle 63X no +/- PLA probes 63X 63X CER16 (20 μM) 2-OE (25 μM) 63XC
Fig. 7 Ceramide triggers BOK association with p-DRP1 and MFN2 and VDAC1 to IP3R at the mitochondria-associated ER membranes. a Representative western blot and densitometry of MFN2 in HEK-293 cells stably transfected with GFP-BOK and induced with Dox (Dox: 0 (dH2O vehicle), 1.25 and 2.5 ng/mL, n= 4 separate experiments in duplicate; one-way ANOVA, Tukey’s post-test *P < 0.01). b Primary isolated cytotrophoblast cells treated with CER 16:0 or EtOH vehicle were stained for: (i/ii) BOK (green), calreticulin (red), and nuclear DAPI (blue) (n= 3 separate experiments); (iii/iv) p-DRP1 (green), calreticulin (red), and nuclear DAPI (blue) (n= 3 separate experiments); (v/vi) BOK (green), MFN2 (red), and nuclear DAPI (blue) (n= 3 separate experiments); and (vii/viii) p-DRP1 (green), MFN2 (red), and nuclear DAPI (blue) (n = 3 separate experiments). c Representative confocal images of in situ proximity ligation assay targeting VDAC1 and IP3R interactions in JEG3 cells exposed to CER 16:0 (20μM) and 2-oleoylethanolamine (2-OE; 25μM) for 6 h. Reactions without positive and negative PLA probes were used as negative controls
and MFN2 overexpression40. In support of the idea of a rheostat in mitochondrial dynamic events, herein we demonstrate that increased DRP1-dependent
mitochon-drialfission inversely correlates to fusion as identified by
decreased OPA1 expression and augmented levels of active OMA-1 in PE placentae, and in trophoblast cells
following CER 16:0 treatment. Our finding on impaired
cell fusion in PE are in line with a study reporting downregulation of MFN2 mRNA and impaired mito-chondrial ATP production in PE placentae and in TEV-1
cells subjected to hypoxia41.
CERs are powerful inducers of intrinsic cell death in
several systems42. We recently reported that specific CER
species (eg., CER 16:0 and CER 18:0) are increased in PE
C
Parkin Ponceau Cleaved PINK1 63 kDa 52 kDa 48 kDa PTC PE 53 kDaE
0 0.2 0.4 0.6 0.8 1 1.2 * ASAH2 Protein Fold Change Norm al iz ed to T O M20 0 0.5 1 1.5 PTC PE * P INK 1/ Cleaved P INK 1 Rat io P rot ein Fold Change Norm ali z ed to P o nc eau 0 1 2 3 PTC PE * Pa rk in P rot ein Fold Change Norm ali z ed t o P o nc eau PTC PE PTC PE ASAH2 TOM20 20 kDa Mitochondria Mitochondria 86 kDa PED
500 nmA
PE, 29 Weeks*
*
*
PE 500 nmB
Endoplasmic Reticulum PTC PE MFN2 Calreticulin 48 kDa 80 kDa 0 10 20 30 40 50 % of Mi tochondria T e thered to ER PTC PE * 500 nm PTCFig. 8 Mitophagy contributes to removal of excess mitochondrial fragments in preeclampsia. (a, left panel) Representative TEM image of a cytotrophoblast from PTC and PE placenta collected at 29 weeks. Mitochondrial proximity to ER (MAM) is indicated by white arrows, mitochondrial fission events are depicted by white stars (scale bar: 500 nm; n = 8 separate PE placentae). (a, right panel) percentage of mitochondrial tethering to the ER in in PE vs. PTC (PE placentae, n= 8; PTC placentae, n = 7; unpaired Student’s t-test *P < 0.05). b Representative western blots for MFN2 and calreticulin in ER isolated from PE and PTC placentae (PE and PTC, n= 3 separate samples). c WB and associated densitometry of ASAH2 (normalized to TOM20) in mitochondria from PTC and PE placentae. d Representative TEM depicting mitophagy (white arrow) in cytotrophoblast cell from PE placenta (scale bar: 500 nm, n= 8 separate PE placentae). e Western blot and associated densitometry of PINK1 and Parkin in PE vs. PTC mitochondrial isolates. Densitometry for PINK1 blot was used to calculate the ratio of full-length PINK63kDato cleaved PINK153kDa(PE and PTC, n= 4 separate placentae, *P < 0.05)
placentae17. This increase in CER is dependent on the oxidative stress status of PE that impinge on CER reg-ulatory enzymes, ultimately leading to increased
tropho-blast cell death rates17. Herein, we show that p-DRP1 is
highly present in the mitochondria of PE placentae that are enriched in CER 16:0 and CER 18:0. Treatment of neonatal rat cardiomyocytes with synthetic CER 2:0 resulted in increased DRP1 expression and this was accompanied by a more spherical mitochondrial
con-formation favouring the initiation of apoptosis43. In line
with this observation, we show that exposure of primary
isolated cytotrophoblast cells—and JEG3 cells—to
natu-rally occurring CER 16:0 increased DRP1 expression and phosphorylation, as well as p-DRP1 recruitment to the mitochondria, an event plausibly triggered by the pre-sence of increased adaptor protein MiD49. Furthermore, we demonstrate that ASAH1 inhibition in JEG3 cells and in pregnant mice resulted in heightened p-DRP1 levels in cells and murine placentae, underscoring the importance
of CER in the induction of mitochondrial fission in
tro-phoblast cells during pregnancy.
Key to the formation of permeable channels at the mitochondria are the Bcl-2 family members, a group of proteins that act as either pro-apoptotic (BAK, BAX, and BOK) or pro-survival (Bcl-2, Bcl-XL, and Mcl-1)
indu-cers44,45. The OMM produces CERs, which has been
referred to as the‘mitochondrial CER-rich macrodomain’
(MCRM), a platform by which BAX inserts, oligomerizes, and forms channels responsible for apoptosis in irradiated
cells46. Mitochondrial fission is attenuated in primary
neurons isolated from Bak-deficient mice brains,
under-scoring the importance of BAK as a regulator offission47.
Moreover, studies conducted in HeLa cells, demonstrated that DRP1 membrane association with the mitochondria
is BAX/BAK dependent48, and BAX oligomerization is
dependent on DRP1-induced membrane hemifusion,
resulting in apoptosis49. Our present data highlight a
novel and direct role for BOK on DRP1 expression and in fission events further underscoring the importance of pro-apoptotic Bcl-2 proteins in orchestrating mitochondrial dynamics. Notably, we have reported that accelerated trophoblast cell death rates, typical of PE, are due to high
BOK levels18,26,50, and that CERs alter the BOK/MCL1
rheostat in favor of BOK leading to enhanced
autophagy17,18.
Pro-apoptotic Bcl-2 family members can contain up to four Bcl-2 homology domains (BH1–4); however, the BH3 domain is crucial to apoptosis. Interestingly, its deletion in the Bcl-2/adenovirus E1B 19-kDa interacting protein 1
(BNIP1) results in diminished mitochondrial fission in
HeLa cells51. Our current data on the abrogation of the
BOK-induced effect on fission following transient
over-expression of BOK-ΔBH3 in JEG3 cells further
under-score the significance of this domain in regulating fission.
Most Bcl-2 family members, including BOK, also contain
a C-terminalα-helical TMD that functions to anchor the
protein to the mitochondrial membranes aiding to its
apoptotic function52. It has been reported that the TMD is
critical for BOK recruitment to the ER and Golgi
com-partments27, and here we show that the TMD of BOK is
also important for mitochondrial fragmentation likely by facilitating BOK recruitment to the ER/MAM compart-ments together with p-DRP1.
ER–mitochondria crosstalk is crucial for intracellular
calcium signaling as it functions as a critical membrane
contact site for lipid exchange and conversion53. MFN2 is
the GTPase responsible for tethering the ER and
mito-chondria together54, although its most notable function is
in mitochondrial fusion5. Of note, BOK has been shown
to play a role in regulating the apoptotic response to ER
stress55. Our present study demonstrates a significant
increase in MFN2 protein following BOK induction. Hence, we propose that BOK increases MFN2 tethering between the ER and mitochondria to facilitate the process
of mitochondrial fission. Notably, we found a marked
increase in ER tethering to the mitochondria in PE and this associated with high MFN2 levels in the ER isolated from PE placentae. Emerging evidence suggests that CER produced in the ER is transported to the mitochondria via
the MAM44. However, we did notfind any CER changes
between MAM isolated from PE and PTC placentae, indicating that the observed CER accumulation in the mitochondrial OMM is likely due to reduced breakdown of CERs. In support of the latter, we observed reduced mitochondrial levels of neutral ASAH2 (enzyme that hydrolysis CER to sphingosine) in PE placentae. We speculate that mitochondrial CER accumulation in PE results in more MCRM platforms in the OMM for BOK
insertion thereby contributing to mitochondrial fission
and trophoblast cell death.
Mitophagy is a highly specialized autophagic degra-dation pathway required to remove non-functional
mitochondrial fragments31, and we have reported on
the occurrence of mitophagy in PE placentae18.
Mito-phagy is classically dependent on PINK1 and Parkin56.
In particular, mitochondrial fragments with impaired IMM potentials fail to import PINK1 to the IMM for cleavage, resulting in PINK1 accumulation to the OMM where it can recruit Parkin, which is responsible for
OMM polyubiquitination required for mitophagy57.
Herein we report increased levels of full-length PINK1 relative to its cleaved non-active isoform, and this is associated with increased Parkin levels in mitochondria isolated from PE placentae indicating that excess frag-ments are disposed by means of mitophagy. We propose that PINK1/Parkin regulated mitophagy is primed in PE
likely as a defense against oxidative stress that typifies
Summarizing (see Fig.9 for putative model), our data show that elevated CER in mitochondria from PE pla-centae, favors pro-apoptotic BOK recruitment to the OMM, and increased p-DRP1-dependent mitochondrial fission, resulting in elevated mitophagy. Thus,
mito-chondrial dynamic events favoring fission contribute to
the exuberant cell death and autophagy characteristic of PE.
Materials and methods
Placental tissue collection
Informed consent was obtained from all clinical sub-jects, and placental collection was conducted in accor-dance with the ethical guidelines of the University of Toronto Faculty of Medicine and Mount Sinai Hospital by the Placenta BioBank, Mount Sinai Hospital, Toronto. All
experiments are in agreement with the Helsinki
Declaration of 1975, including its current 7th revision in 2013. The study was approved by the Mount Sinai Hos-pital Research Ethics Board (REB number: 11-0287-E). PE
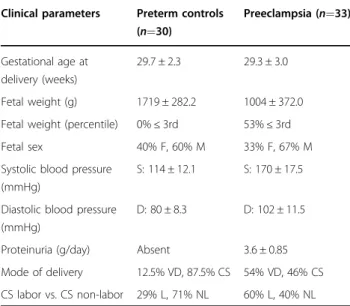
subjects (n= 33) were selected based upon the American
College of Obstetrics and Gynecology (ACOG) criteria of maternal hypertension and proteinuria, or in the absence
of proteinuria–thrombocytopenia, impaired liver
func-tion, pulmonary, renal, or cerebral disease58.
Normoten-sive age-matched PTCs (n= 30) were selected based on
the absence of placental disease with appropriate-for-gestational-age foetuses. Clinical parameters of PE and
PTC subjects are listed in Table1.
Transmission electron microscopy
PE (n= 8) and PTC (n = 7) placental tissue were
col-lected and processed for TEM analysis immediately upon delivery. Primary isolated trophoblast cells from term
placentae (n= 5) were treated with CER 16:0 (Avanti
Polar Lipids) or EtOH vehicle, and HEK-293 cells stably
induced with GFP-BOK were induced with Dox or dH2O
as control (n= 3). Tissue and cell samples were fixed in
2% glutaraldehyde in 0.1 M cacodylate buffer (pH 7.3) for up to 24 h at 4 °C. The samples were processed by the Advanced Bioimaging Centre, Mount Sinai Hospital, Toronto. Placental tissue was processed into thin sec-tions, and cells were embedded in coverslips containing Quetol resin (Electron Microscopy Scieneces, 20440), cut into 90 nm sections, picked up on copper grids and stained with uranyl acetate and lead citrate. Imaging was
MFF DRP1 P DRP1 P DRP1 P BOK BOK BOK Mitochondrion ↑ Mitochondrial Fission MFN2 ↑ Mitophagy ER MAM DRP1 P
Fig. 9 Putative model of the mechanisms underlying increased mitochondrialfission in PE. Putative model of the mechanisms underlying increased mitochondrialfission in PE. Elevated ceramide in mitochondria from PE pregnancies activates DRP1 and increases its recruitment to MFF at the OMM. p-DRP1 oligomerizes and completes the process of mitochondrialfission. Ceramide triggers the recruitment of BOK to the OMM, which; in turn, contributes to both augmented p-DRP1 expression and increases MAM tethering by inducing MFN2 expression. Mitochondrial fragments are degraded by means of PINK1/Parkin dependent mitophagy
conducted on a FEI Technai 20 Transmission Electron Microscope.
TEM images of cytotrophoblast cells from PE (n= 8) and
PTC (n= 7) placentae were obtained. For each placenta,
three cytotrophoblast cells were identified, the number of
mitochondria was counted, and an internal mean was generated. Mitochondrial width was measured using Ima-geJ® 1.49v software, where the minimum short-axis was recorded for each mitochondrion in at least three
cyto-trophoblast cells from all PE (n= 8) and PTC (n = 7)
sub-jects. Statistical analysis was conducted as described below. Isolation of primary cytotrophoblast from term placentae
Whole, term placentae (n= 5), from normotensive,
otherwise healthy women undergoing elective cesarean sections (C/S) for fetal malpresentation or previous C/S, were obtained within 10 min of delivery. Approximately 60 g of placental tissue was dissected, avoiding areas of
calcification and large vasculature and was cut into
smaller pieces. Primary cell isolation was carried out as
previously described59, following a modification of Kliman
methods60. Isolated cells were counted using Trypan blue
and a hematocytometer, and cultured at a concentration
of 1 × 10⁷cells per 35 mm well, on coverslips for IF, or not
for WB, in Dulbecco’s modified Eagle’s medium (DMEM) F:12 media (GIBCO-BRL, 11039-021) containing fetal
bovine serum (FBS) and penicillin–streptomycin
(Gibco®). Cells were cultured for 24 h at 8% pO2
(phy-siological oxygen tension for term placentae) and were subsequently treated with 20 µM synthetic CER 16:0 or EtOH vehicle for 6 h prior to collection for WB analysis,
orfixation for IF in 4% paraformaldehyde solution.
Cell culture and analysis
JEG3 human choriocarcinoma cells
JEG3 cells (ATCCHTB36TM) were cultured in six-well
plates or coverslips in 20% O2at 37°C in Eagle's Minimum
Essential Medium (EMEM) media (ATCC, 30-2003)
containing FBS and penicillin–streptomycin (Visent Inc).
Once the cells attained 80% confluency, they were treated
with either 20 µM CER 16:0 (Enzo Life Sciences,
BML-SL115), 25μM 2-OE (Invitrogen, 0383), or EtOH vehicle
for 6 h, and either collected for protein analysis by WB, or fixed with 4% paraformaldehyde for IF.
HEK-293 cells
HEK-293 cells (ATCC®, CRL 1573TM
) were cultured in high glucose DMEM media (Lunenfeld-Tanenbaum
Research Institute, Toronto, Ontario) at 20% O2at 37 °C
to a confluency of 60–80%. Cells were used for transfec-tion to silence (siRNA) and overexpress BOK, and to
overexpress BOKΔBH3 (described below). HEK-293 cells
were stably transfected with GFP-hBOK using a
Flp-In-T-Rex-293 cell line (ThermoFisher Scientific®) as previously
described26. GFP-hBOK cells lines included WT and
those with the following deletions:ΔBH3, ΔTMD.
BOK-ΔBH3 plasmid was obtained by deletion of residues 65–82 corresponding to the BH3 domain of WT BOK. BOK-ΔTMD lacked the complete TMD domain. BOK WT and mutant expression was induced in the transfected cell lines by Dox at 1.5 or 2.5 ng/mL for 36 h.
BOK transfection experiments BOK silencing
HEK-293 were cultured as described above, and when a confluency of 60–80% was attained, cells were transfected with either 30 nM of Silencer® select siRNA targeted against the mRNA of BOK (Ambion, AM16708), or scrambled siRNA sequences as a control, using a
jet-PRIME® protocol (Polyplus Transfection®, 89129-922).
Cells were cultured at 37°C and collected 24 h later for protein analysis by WB.
BOK/ΔBH3 overexpression experiments
HEK-293 cells were transfected with 2 µg/35 mm cul-ture well of pcDNA L (WT BOK), pcDNA BOK-ΔBH3, and pcDNA3.1 (EV) (ThermoFisher Scientific®) using a jetPRIME® protocol. Protein was collected after incubation at 37°C for 24 h.
Mitochondrial isolation
PE and PTC placentae were cut into smaller pieces, rinsed with isotonic saline (0.9% NaCl solution), and suspended in ice-cold buffer A (0.25 M sucrose, 0.001 M EDTA, 10 mM Tris-HEPES, pH 7.4). The tissue was subjected to two, 1-min homogenizations: one at low and
the next at medium speed (Homogenizer: VWR®,
82027-Table 1 Clinical parameters of the study population
Clinical parameters Preterm controls (n=30) Preeclampsia (n=33) Gestational age at delivery (weeks) 29.7 ± 2.3 29.3 ± 3.0 Fetal weight (g) 1719 ± 282.2 1004 ± 372.0 Fetal weight (percentile) 0%≤ 3rd 53%≤ 3rd Fetal sex 40% F, 60% M 33% F, 67% M Systolic blood pressure
(mmHg)
S: 114 ± 12.1 S: 170 ± 17.5
Diastolic blood pressure (mmHg)
D: 80 ± 8.3 D: 102 ± 11.5
Proteinuria (g/day) Absent 3.6 ± 0.85 Mode of delivery 12.5% VD, 87.5% CS 54% VD, 46% CS CS labor vs. CS non-labor 29% L, 71% NL 60% L, 40% NL
F female, M male, S systolic, D diastolic, CS cesareanc section, VD vaginal delivery, L labor, NL non-labor
184). The homogenate was centrifuged at 1300 g for 5 min at 4 °C and the supernatant (PNS) was further centrifuged at 12,000 g for 15 min at 4 °C, and yielded a MI pellet and post-mitochondrial supernatant (PMS). All three fractions (PNS, PMS, and MI) were validated using TOM20, a
marker of the OMM, andβ-actin (ACTB), a cytoskeletal
protein marker. The MI was assessed biochemically by WB for p-DRP1 and a portion was used for CER analysis using liquid chromatography linked to tandem mass spectrometry (LC-MS/MS).
MAM isolation
Subcellular fractionation and isolation of the MAM was
carried out as previously described61. Briefly, the
mito-chondrial pellet of PE and PTC placentae isolated as described above was resuspended in 2 mL of EMEM media, and subsequently placed on a 30% Percoll gradient and centrifuged at 95,000 g for 30 min at 4 °C. The Percoll gradient was separated into the heavy fraction, containing the mitochondria, and the light fraction (LF) containing the MAMs. The LF fraction was centrifuged at 6300 g for 10 min at 4 °C, and the supernatant further centrifuged at 100,000 g for 1 h at 4 °C. The resulting pellet was the MAM isolate, which was validated by WB for absence of TOM20 and enrichment of calreticulin. DRP1 expression was evaluated by WB, and an aliquot was used for CER analysis by LC-MS/MS.
CER measurements
MI and MAM isolates from PE and PTC placental
tis-sues were processed for lipid extraction62and CERs were
measured by LC-MS/MS as previously described17.
LC-MS/MS was performed at the Analytical Facility for Bioactive Molecules (The Hospital for Sick Children, Toronto) using an Agilent 1200 Series binary pump (Agilent Technologies Canada Inc.) linked to an API5500 triple-quadruple mass spectrometer (AB SCIEX). Mouse experiments
CD1 mice were purchased from Charles River (St. Constant, QC). Animal studies were conducted according to the criteria set up by the Canadian Council for Animal Care and approved by the Animal Care and Use Com-mittee of the Hospital for Sick Children, Toronto, ON. Pregnant CD1 mice were intraperitoneally injected daily with Ceranib-2 (20 mg/kg; Cayman Chemical, 11092) commencing at E7.5 till E13.5. Ceranib-2 was dissolved in dimethyl sulfoxide (DMSO) and mice solely injected with DMSO were used as controls. At E13.5, placentae were snap frozen for biochemical analysis.
WB analysis
WB analysis was conducted as previously described63.
Briefly, PE and PTC snap-frozen tissue was pulverized in
liquid nitrogen and homogenized in RIPA buffer (150 mM NaCl, 50 mM Tris, 1% NP-40, pH 7.5). The homogenate was centrifuged, and the supernatant transferred to a new tube for protein content analysis prior to WB analysis. Similarly, cultured cells were col-lected in 40 µL of RIPA buffer per well (of a six-well plate) and placed on ice for 1 h, centrifuged and the supernatant transferred to a new tube for protein con-tent and WB analysis. The protein concon-tent of tissue and cell samples was assessed by Bradford protein assay
(Bio-Rad®, 500-0006).
For WB, 30 µg of proteins from tissue and cell lysates were mixed with 8 µL of sample buffer (Tris 0.5% (pH 6.8), glycerol 20%, sodium dodecylsulfate (SDS) 10%, 2-β-mercaptoethanol, bromophenol blue 0.1%), and RIPA buffer to a total sample volume of 32 µL. Samples were subjected to sodium dodecyl sulfate–polyacrylamide gel electrophoresis and then transferred onto
methanol-hydrated polyvinylidene fluoride membranes. The
mem-branes were then blocked in 5% non-fat milk dissolved in tris-buffered saline (TBST) for 1 h, and left overnight in primary antibody at 4 °C. The next day, the membranes were washed three times for 15 min in TBST, and sec-ondary antibody (horseradish peroxidase (HRP)-con-jugated polyclonal antibody) was added for 1 h at room temperature. Blots were imaged using chemiluminescence ECL-plus reagent (PerkinElmer Inc., NEL103001EA) and
X-rayfilm (GE Healthcare).
IF analysis
Following experimental treatments, cells were fixed
with 4% paraformaldehyde (Sigma®, F8775) for 15 min at 37 °C. Cells were permeabilized with 0.2% Triton X-100 for 5 min, rinsed with phosphate-buffered saline (PBS) and blocked with 5% normal horse serum (NHS) (Sigma®, H0146) for 1 h at room temperature. Primary antibodies were diluted in antibody diluent (0.4% sodium azide, 0.625% gelatin) and 5% NHS, and placed on cells for incubation overnight at 4 °C. For negative controls, the primary antibody was replaced with either nonimmune rabbit IgG (Santa Cruz Biotechnology, [sc-2027]) or goat IgG (sc-2028), corresponding to the primary antibodies being used. Following three PBS washes, HRP-conjugated secondary antibodies were diluted in antibody diluent and applied for 1 h at a concentration of 1:2000, after which three additional PBS washes was carried out. Cells were treated with 4’,6-diamino-2-phenylindole (DAPI) for 5
min to detect the nucleus, prior tofixation to 25 × 75 × 1
mm glass slides with Immuno-Mount™ (ThermoFisher Scientific®). IF images were obtained using a DeltaVision Deconvolution microscope (GE Healthcare). Live cell staining in JEG3 cells was conducted using 100 nM
MitoTracker® red (ThermoFisher Scientific®), which was
performed using Volocity Software to determine either Mean Fluorescent Intensity or PCC.
Proximity ligation assay
Duolink in situ Proximity Ligation Assay (Sigma
Aldrich, USA) permits the detection of protein–protein
interactions. JEG3 cells treated with and without CER 16:0
(20μM) and 2-OE (25 μM) for 6 h, were cultured on
eight-well chamber slides (LabTek, ThermoFisher, CA).
Cells were then washed with PBS, fixed with cold 1:1
methanol and acetone for 3 min and permeabilized with 0.2% Triton X-100 for 5 min. Following a blocking step with Duolink blocking solution for 30 min at 37 °C, cells were incubated with VDAC1 and IP3R antibodies over-night at 4 °C. Hybridization of antibodies using plus and minus PLA probes raised against species of respective primary antibodies, ligation, and amplification reactions were performed according to the manufacturer's protocol. Slides were mounted with Duolink in situ mounting medium with DAPI (Sigma Aldrich, USA), and pictures were obtained using spinning disc confocal microscope with Volocity Imaging system.
Antibodies Primary antibodies
Commercially available primary antibodies were
obtained for WB and IF analyses. Antibodies against DRP1 (32898, rabbit [WB 1:1500]), MFF (T-14, sc-168593, goat [IF: 1:200, WB 1:1000]), OMA-1 (sc-515788, mouse monoclonal [WB 1:500]), MFN2 (H-68, sc-50331, rabbit [IF: 1:200, WB 1:1000]), BOK (H-151, sc-11424, rabbit [IF: 1:200, WB 1:1000]), TOM20 (FL-135, sc-11415, rabbit [WB 1:1000]), Neutral ceramidase (S-20, goat polyclonal; WB: 1:500), TUBA (αTubulin; P-16, sc-31779, goat [WB 1:2000]), and ACTB (β-actin; I-19, sc-1616, goat [WB 1:2000]) were purchased from Santa Cruz Bio-technology. Rabbit polyclonal anti-SMCR7 (Mid49) [WB 1:1000], mouse monoclonal anti-VDAC1 (ab14734) [PLA 1:200], and rabbit polyclonal anti-IP3R (ab5804) [PLA 1:200] were obtained from Abcam (Cambridge, UK). Antibodies against p-DRP1 (S616) (3455 S, rabbit [IF: 1:500, WB 1:1000]) were purchased from Cell Signalling
Technology®. OPA1 (612607, mouse [WB 1:1000]) was
purchased from BD Biosciences®; PINK1 (BC100-494, rabbit [WB 1:1000]) was purchased from Novus Biologi-cals®; and Parkin (AB9244, rabbit [WB 1:500]) was pur-chased from Millipore Sigma®.
Secondary antibodies
Secondary antibodies include goat anti-rabbit IgG-HRP 2054 [WB: 1:2000]), donkey anti-goat IgG-HRP 2056 [WB: 1:2000]), and goat anti-mouse IgG-HRP (sc-2005 [WB: 1:2000]) were purchased from Santa Cruz
Bio-technology. For IF, Alexa Fluor® 488 donkey anti-rabbit IgG
(A21206), Alexa Fluor® 594 donkey anti-rabbit IgG (A21207), Alexa Fluor® 488 donkey anti-goat IgG (A11055), Alexa Fluor® 594 donkey anti-goat IgG (A11058), and Alexa Fluor® 594 donkey anti-mouse IgG (A21203) were all purchased from ThermoFisher Scientific®.
Densitometric and statistical analysis
WB densitometric analysis was conducted using
Ima-geQuant® 5.0 software. Samples were normalized to either
ACTB (β-Actin), TUBA (αTubulin), or Ponceau Stain.
Statistical analysis was performed using GraphPad Prism 5 software, where comparison of two means utilized an unpaired Student's t-test, and comparison of multiple means used a one-way analysis of variance (ANOVA) with a Tukey post-test to compare two variables where applicable. Significance was denoted as *P < 0.05, **P < 0.01, and ***P < 0.001.
Acknowledgements
We thank the RCWIH BioBank, the Lunenfeld-Tanenbaum Research Institute, and the Mount Sinai Hospital/UHN Department of Obstetrics and Gynaecology for the human specimens used in this study (http://biobank.lunenfeld.ca). We also thank Doug Holmyard from the Mount Sinai Hospital Advanced Bioimaging Centre for his technical assistance with transmission electron microscopy (TEM). Funding for this research was provided by the Canadian Institutes for Health Research (CIHR, MOP-133436 to I.C.) and National Institutes of Health (1R01HD089660 to I.C.).
Author details 1
Lunenfeld-Tanenbaum Research Institute, Sinai Health System, Toronto, ON M5T 1X5 Canada.2Institute of Medical Science, University of Toronto, Toronto, ON, Canada.3Department of Obstetrics and Gynecology, Botucatu Medical School, UNESP– Sao Paulo State University, São Paulo, Brazil.4Department of Physiology, University of Toronto, Toronto, ON, Canada.5Translational Medicine Program, Peter Gilgan Center for Research and Learning, The Hospital for Sick Children, Toronto, ON M5G 1X8, Canada.6Department of Obstetrics and Gynecology, University of Toronto, Toronto, ON, Canada
Conflict of interest
The authors declare that they have no conflict of interest. Publisher's note
Springer Nature remains neutral with regard to jurisdictional claims in published maps and institutional affiliations.
Supplementary Information accompanies this paper athttps://doi.org/ 10.1038/s41419-018-0360-0.
Received: 2 October 2017 Revised: 15 January 2018 Accepted: 22 January 2018
References
1. Shadel, G. S. & Horvath, T. L. Mitochondrial ROS signaling in organismal homeostasis. Cell 163, 560–569 (2015).
2. Danial, N. N. & Korsmeyer, S. J. Cell death: critical control points. Cell 116, 205–219 (2004).
3. Legros, F., Lombes, A., Frachon, P. & Rojo, M. Mitochondrial fusion in human cells is efficient, requires the inner membrane potential, and is mediated by mitofusins. Mol. Biol. Cell 13, 4343–4354 (2002).
4. Ehses, S. et al. Regulation of OPA1 processing and mitochondrial fusion by m-AAA protease isoenzymes and OMA1. J. Cell Biol. 187, 1023–1036 (2009).
5. Chen, H. et al. Mitofusins Mfn1 and Mfn2 coordinately regulate mitochondrial fusion and are essential for embryonic development. J. Cell Biol. 160, 189–200 (2003).
6. Ding, W. X. & Yin, X. M. Mitophagy: mechanisms, pathophysiological roles, and analysis. Biol. Chem. 393, 547–564 (2012).
7. Smirnova, E., Griparic, L., Shurland, D. L. & van der Bliek, A. M. Dynamin-related protein Drp1 is required for mitochondrial division in mammalian cells. Mol. Biol. Cell 12, 2245–2256 (2001).
8. Taguchi, N., Ishihara, N., Jofuku, A., Oka, T. & Mihara, K. Mitotic phosphorylation of dynamin-related GTPase Drp1 participates in mitochondrialfission. J. Biol. Chem. 282, 11521–11529 (2007).
9. Strack, S. & Cribbs, J. T. Allosteric modulation of Drp1 mechanoenzyme assembly and mitochondrialfission by the variable domain. J. Biol. Chem. 287, 10990–11001 (2012).
10. de Brito, O. M. & Scorrano, L. An intimate liaison: spatial organization of the endoplasmic reticulum-mitochondria relationship. EMBO J. 29, 2715–2723 (2010).
11. Ainbinder, A., Boncompagni, S., Protasi, F. & Dirksen, R. T. Role of Mitofusin-2 in mitochondrial localization and calcium uptake in skeletal muscle. Cell Calcium 57, 14–24 (2015).
12. Archer, S. L. Mitochondrial dynamics - mitochondrialfission and fusion in human diseases. New Engl. J. Med. 369, 2236–2251 (2013).
13. Wakabayashi, J. et al. The dynamin-related GTPase Drp1 is required for embryonic and brain development in mice. J. Cell Biol. 186, 805–816 (2009). 14. Amaral, L. M., Cunningham, M. W. Jr, Cornelius, D. C. & LaMarca, B. Pre-eclampsia: long-term consequences for vascular health. Vasc. Health Risk Manag. 11, 403–415 (2015).
15. Rice, M. M. et al. Pregnancy-associated hypertension in glucose-intolerant pregnancy and subsequent metabolic syndrome. Obstet. Gynecol. 127, 771–779 (2016).
16. Redman, C. W. & Sargent, I. L. Placental debris, oxidative stress and pre-eclampsia. Placenta 21, 597–602 (2000).
17. Melland-Smith, M. et al. Disruption of sphingolipid metabolism augments ceramide-induced autophagy in preeclampsia. Autophagy 11, 653–669 (2015). 18. Kalkat, M. et al. Placental autophagy regulation by the BOK-MCL1 rheostat.
Autophagy 9, 2140–2153 (2013).
19. Soleymanlou, N. et al. Hypoxic switch in mitochondrial myeloid cell leukemia factor-1/Mtd apoptotic rheostat contributes to human trophoblast cell death in preeclampsia. Am. J. Pathol. 171, 496–506 (2007).
20. Loson, O. C., Song, Z., Chen, H. & Chan, D. C. Fis1, Mff, MiD49, and MiD51 mediate Drp1 recruitment in mitochondrialfission. Mol. Biol. Cell 24, 659–667 (2013).
21. Head, B., Griparic, L., Amiri, M., Gandre-Babbe, S. & van der Bliek, A. M. Inducible proteolytic inactivation of OPA1 mediated by the OMA1 protease in mam-malian cells. J. Cell Biol. 187, 959–966 (2009).
22. Anand, R. et al. The i-AAA protease YME1L and OMA1 cleave OPA1 to balance mitochondrial fusion andfission. J. Cell Biol. 204, 919–929 (2014). 23. Westrate, L. M., Drocco, J. A., Martin, K. R., Hlavacek, W. S. & MacKeigan, J. P.
Mitochondrial morphological features are associated withfission and fusion events. PLoS One 9, e95265 (2014).
24. Labbe, K., Murley, A. & Nunnari, J. Determinants and functions of mitochondrial behavior. Annu. Rev. Cell Dev. Biol. 30, 357–391 (2014).
25. Proksch, D., Klein, J. J. & Arenz, C. Potent inhibition of Acid ceramidase by novel B-13 analogues. J. Lipids 2011, 971618 (2011).
26. Ray, J. E., Garcia, J., Jurisicova, A. & Caniggia, I. Mtd/Bok takes a swing: proa-poptotic Mtd/Bok regulates trophoblast cell proliferation during human pla-cental development and in preeclampsia. Cell Death Differ. 17, 846–859 (2010). 27. Echeverry, N. et al. Intracellular localization of the BCL-2 family member BOK
and functional implications. Cell Death Differ. 20, 785–799 (2013).
28. Grimm, S. The ER-mitochondria interface: the social network of cell death. Biochim. Biophys. Acta 1823, 327–334 (2012).
29. de Brito, O. M. & Scorrano, L. Mitofusin-2 regulates mitochondrial and endo-plasmic reticulum morphology and tethering: the role of Ras. Mitochondrion 9, 222–226 (2009).
30. Tubbs E., Rieusset J. Study of endoplasmic reticulum and mitochondria interactions by in situ proximity ligation assay infixed cells. J. Vis. Exp. 118, e54899,https://doi.org/10.3791/54899(2016).
31. Kurihara, Y. et al. Mitophagy plays an essential role in reducing mitochondrial production of reactive oxygen species and mutation of mitochondrial DNA by maintaining mitochondrial quantity and quality in yeast. J. Biol. Chem. 287, 3265–3272 (2012).
32. Bingol, B. & Sheng, M. Mechanisms of mitophagy: PINK1, Parkin, USP30 and beyond. Free Radic. Biol. Med. 100, 210–222 (2016).
33. Yu, T., Sheu, S. S., Robotham, J. L. & Yoon, Y. Mitochondrialfission mediates high glucose-induced cell death through elevated production of reactive oxygen species. Cardiovasc. Res. 79, 341–351 (2008).
34. Sharp, W. W. et al. Dynamin-related protein 1 (Drp1)-mediated diastolic dysfunction in myocardial ischemia-reperfusion injury: therapeutic benefits of Drp1 inhibition to reduce mitochondrial fission. FASEB J. 28, 316–326 (2014).
35. Gilgun-Sherki, Y., Melamed, E. & Offen, D. Oxidative stress induced-neurodegenerative diseases: the need for antioxidants that penetrate the blood brain barrier. Neuropharmacology 40, 959–975 (2001).
36. Rolfo, A. et al. Abnormalities in oxygen sensing define early and late onset preeclampsia as distinct pathologies. PLoS ONE 5, e13288 (2010).
37. Caniggia, I. et al. Hypoxia-inducible factor-1 mediates the biological effects of oxygen on human trophoblast differentiation through TGFbeta(3). J. Clin. Invest. 105, 577–587 (2000).
38. Ryan, J. J. et al. PGC1alpha-mediated mitofusin-2 deficiency in female rats and humans with pulmonary arterial hypertension. Am. J. Respir. Crit. Care Med. 187, 865–878 (2013).
39. Olichon, A. et al. Loss of OPA1 perturbates the mitochondrial inner membrane structure and integrity, leading to cytochrome c release and apoptosis. J. Biol. Chem. 278, 7743–7746 (2003).
40. Ong, S. B. et al. Inhibiting mitochondrialfission protects the heart against ischemia/reperfusion injury. Circulation 121, 2012–2022 (2010).
41. Yu, J., Guo, X., Chen, R. & Feng, L. Downregulation of Mitofusin 2 in placenta is related to preeclampsia. Biomed. Res. Int. 2016, 6323086 (2016).
42. Stiban, J. & Perera, M. Very long chain ceramides interfere with C16-ceramide-induced channel formation: a plausible mechanism for reg-ulating the initiation of intrinsic apoptosis. Biochim. Biophys. Acta 1848, 561–567 (2015).
43. Parra, V. et al. Changes in mitochondrial dynamics during ceramide-induced cardiomyocyte early apoptosis. Cardiovasc. Res. 77, 387–397 (2008). 44. Ganesan, V. & Colombini, M. Regulation of ceramide channels by Bcl-2 family
proteins. FEBS Lett. 584, 2128–2134 (2010).
45. Llambi, F. et al. BOK is a non-canonical BCL-2 family effector of apoptosis regulated by ER-associated degradation. Cell 165, 421–433 (2016). 46. Lee, H. et al. Mitochondrial ceramide-rich macrodomains functionalize Bax
upon irradiation. PLoS ONE 6, e19783 (2011).
47. Brooks, C. et al. Bak regulates mitochondrial morphology and pathology during apoptosis by interacting with mitofusins. Proc. Natl. Acad. Sci. USA 104, 11649–11654 (2007).
48. Wasiak, S., Zunino, R. & McBride, H. M. Bax/Bak promote sumoylation of DRP1 and its stable association with mitochondria during apoptotic cell death. J. Cell Biol. 177, 439–450 (2007).
49. Montessuit, S. et al. Membrane remodeling induced by the dynamin-related protein Drp1 stimulates Bax oligomerization. Cell 142, 889–901 (2010).
50. Soleymanlou, N. et al. A novel Mtd splice isoform is responsible for trophoblast cell death in pre-eclampsia. Cell Death Differ. 12, 441–452 (2005).
51. Ryu, S. W., Choi, K., Yoon, J., Kim, S. & Choi, C. Endoplasmic reticulum-specific BH3-only protein BNIP1 induces mitochondrial fragmentation in a Bcl-2- and Drp1-dependent manner. J. Cell Physiol. 227, 3027–3035 (2012).
52. Schinzel, A., Kaufmann, T. & Borner, C. Bcl-2 family members: integrators of survival and death signals in physiology and pathology [corrected]. Biochim. Biophys. Acta 1644, 95–105 (2004).
53. Raturi, A. & Simmen, T. Where the endoplasmic reticulum and the mito-chondrion tie the knot: the mitochondria-associated membrane (MAM). Bio-chim. Biophys. Acta 1833, 213–224 (2013).
54. Koshiba, T. et al. Structural basis of mitochondrial tethering by mitofusin complexes. Science 305, 858–862 (2004).
55. Carpio, M. A. et al. BCL-2 family member BOK promotes apoptosis in response to endoplasmic reticulum stress. Proc. Natl. Acad. Sci. USA 112, 7201–7206 (2015).
56. Scarffe, L. A., Stevens, D. A., Dawson, V. L. & Dawson, T. M. Parkin and PINK1: much more than mitophagy. Trends Neurosci. 37, 315–324 (2014). 57. Okatsu, K. et al. Mitochondrial hexokinase HKI is a novel substrate of the Parkin
ubiquitin ligase. Biochem. Biophys. Res. Commun. 428, 197–202 (2012). 58. Vest, A. R. & Cho, L. S. Hypertension in pregnancy. Curr. Atheroscler. Rep. 16, 395
59. Sivasubramaniyam, T. et al. Where polarity meets fusion: role of Par6 in tro-phoblast differentiation during placental development and preeclampsia. Endocrinology 154, 1296–1309 (2013).
60. Kliman, H. J., Nestler, J. E., Sermasi, E., Sanger, J. M. & Strauss, J. F. 3rd. Pur-ification, characterization, and in vitro differentiation of cytotrophoblasts from human term placentae. Endocrinology 118, 1567–1582 (1986).
61. Annunziata, I., Patterson, A. & d’Azzo, A. Isolation of mitochondria-associated ER membranes (MAMs) and glycosphingolipid-enriched microdomains
(GEMs) from brain tissues and neuronal cells. Methods Mol. Biol. 1264, 25–33 (2015).
62. Bligh, E. G. & Dyer, W. J. A rapid method of total lipid extraction and pur-ification. Can. J. Biochem. Physiol. 37, 911–917 (1959).
63. MacPhee, D. J. et al. Focal adhesion kinase is a key mediator of human trophoblast development. Lab. Invest. 81, 1469–1483 (2001).