UNIVERSITÀ DEGLI STUDI DELLA TUSCIA DI VITERBO
DIPARTIMENTO DI ECONOMIA E IMPRESA (DEIM)
CORSO DI DOTTORATO DI RICERCA IN ECONOMIA E TERRITORIO
(XXVIII cycle)
BIO-ECONOMIC ASSESSMENT OF CLIMATE-SMART TEA
PRODUCTION IN THE NORTHERN MOUNTAINOUS REGION
OF VIET NAM
(AGR/01)Dottorando:
Tuong The Tran
Coordinatore: Tutors:
Prof. Alessandro Sorrentino Prof. Giacomo Branca
Dr. Aslihan Arslan
Assoc. Prof. Trinh Van Mai
Abstract
Agricultural production in the face of climate change (CC) requires a climate-smart transformation and reorientation at multiple scales. Viet Nam is one of the developing countries that is agriculture-based and severely affected by CC, therefore it is crucial that the agricultural system advances towards the transition. While climate-smart agriculture (CSA) has gained a significant attention at global fora, context-specific evidence is still scarce in Viet Nam. This study examines CSA potentials in tea production systems in the Northern Mountainous Region (NMR) of Viet Nam. Tea cultivation has a crucial role in CSA strategy because it provides an important source to local household (HH) income, while demonstrating a strong potential for CC adaptation and mitigation.
Since CSA concept is multi-dimensional, including food security, adaptation and mitigation, an interdisciplinary analytical framework is employed in this research to assess the economic and biophysical dimensions. Enterprise budgets and representative farms are developed for tea and alternative crops (coffee, maize, rice) as well as livestock (cattle, buffalo and pigs) production to analyze the productivity dimension of food security. In evaluating the adaptation potential of tea production, local farmers’ perceptions and experiences of extreme weather events are combined with ERA-Interim data (1989-2013)1 and HH survey data on income levels. Greenhouse gas (GHG) emissions and carbon sequestration potentials are estimated through partial Carbon Footprint Life Cycle Assessment.
Results show that tea production systems, both under conventional and mini-terracing practices, generate net margins, returns to capital and family labor higher than the alternatives. Farmers therefore have high incentive to switch from other crops to tea production. In face of CC, tea has shown a strong biophysical adaptive capacity compared to other crops in NMR. Tea-producing HHs have higher levels of income and total value of crop production than non-tea producing HHs but mostly under low variability of climate conditions. Tea HHs have demonstrated high potential in buffering climate extremes. Fertilizer application is the single largest GHG emitter at farm level. Tea production systems have a high capability for carbon storage and offsets.
Evidence of strong synergies between food security, mitigation and adaptation is demonstrated for tea production systems in NMR, and potential tradeoffs highlighted where relevant. Policy recommendations are drawn based on combined evidence to support CSA in the region.
Abstract (Italian version)
La produzione agricola di fronte al cambiamento climatico (CC) richiede una trasformazione intelligente del clima e un ri-orientamento a diversi livelli. Il Vietnam è uno dei paesi in via di sviluppo basato sull’agricoltura, gravemente colpito dal CC, quindi è fondamentale che il sistema agricolo avanzi verso la transizione. Mentre l'agricoltura a clima intelligente (climate-smart agricolture) (CSA) ha guadagnato un'attenzione significativa a livello globale, le prove specifiche nel contesto in Vietnam sono ancora scarse. Questo studio esamina i potenziali CSA nei sistemi di produzione di tè nella regione nordica-montana (Northern Mountainous Region) (NMR) del Vietnam. La coltivazione del tè ha un ruolo cruciale nella strategia CSA, poiché fornisce una fonte importante ai redditi locali (HH), dimostrando un forte potenziale per l'adattamento e la mitigazione del CC.
Dal momento che il concetto CSA è multidimensionale, includendo la sicurezza alimentare, l'adattamento e la mitigazione del CC, in questa ricerca viene impiegato un framework analitico interdisciplinare per valutare le dimensioni economiche e biofisiche. I budget aziendali e le aziende rappresentative sono sviluppati per la produzione di tè e colture alternative (caffè, mais, riso), nonché bestiame (bovini, bufali e suini) per analizzare la dimensione produttiva della sicurezza alimentare. Nella valutazione del potenziale di adattamento della produzione di tè, le percezioni degli agricoltori locali e le esperienze di eventi meteorologici estremi sono combinate con dati ERA-Interim (1989-2013) e dati provenienti da interviste sui livelli di reddito familiare. Le emissioni di gas a effetto serra (GHG) e le potenzialità di assorbimento del carbonio sono stimati attraverso la valutazione parziale del ciclo di vita del carbonio (Carbon Footprint Life Cycle Assessment).
I risultati mostrano che i sistemi di produzione di tè, sia sotto pratiche convenzionali che di mini-terrazzamento, hanno più elevati margini netti, ritorno di capitale di cassa e ritorno di lavoro familiare rispetto alle alternative. Gli agricoltori hanno quindi un forte incentivo a passare da altre colture alla produzione di tè.
Di fronte al CC, il tè ha mostrato una forte capacità di adattamento biofisico rispetto ad altre colture nella zona del NMR. Le HHs che producono tè hanno livelli più elevati di reddito e di valori totali della produzione rispetto alle aziende familiari che non producono tè, ma soprattutto in condizioni di bassa variabilità climatica. Le HHs produttrici di tè hanno dimostrato un elevato potenziale nel bloccaggio degli estremi eventi climatici.
L'applicazione del fertilizzante è il singolo più grande emettitore di GHG a livello aziendale. I sistemi di produzione di tè hanno un'elevata capacità di stoccaggio e compensazioni di carbonio. La dimostrazione di forti sinergie tra la sicurezza alimentare, mitigazione ed adattamento è dimostrata per i sistemi di produzione di tè nella zona del NMR e potenziali tradeoffs sono evidenziati, dove rilevanti. Le raccomandazioni in materia di politiche sono elaborate in conformità a prove combinate per supportare la CSA nella regione caso di studio.
Acknowledgement
I would like to express my sincerest and most thankful appreciation and deepest gratitude to the following organizations and individuals for their invaluable support, guidance, assistance, and encouragement in the pursuit of my graduate studies:
The Food and Agriculture Organization of the United Nations, under the CSA Project
“Climate-smart Agriculture: Capturing the synergies among Mitigation, Adaptation and Food Security”,
for funding my research;
The Department of Crop Production for allowing me to go on a study leave;
Professor Giacomo Branca, my principal supervisor, for his academic advice, support, comments and also patience to guide me throughout the entire process of my studies;
Dr. Aslihan Arslan for her professional advice, comments, contributions, corrections and support since the very first days on this journey;
Associate Professor, Dr. Mai Van Trinh for his valuable comments, support and contributions on my work;
Professor Sorrentino for his helpful and timely support to my entire PhD Program in Italy and Professor Julie Caswell for her invaluable suggestions and hospitality during my exchange period in The University of Massachusetts at Amherst;
The CSA Project team in Viet Nam: Dr. Pham Thi Sen, Dr. Nguyen Van Linh and in Italy: Dr. Leslie Lipper, Dr. Andrea Cattaneo, Dr. Adriana Paolantonio, Dr. Romina Cavatassi, Mr. Alessandro Spairani, Dr. Louis Bockel, and Mr. Uwe Grewer for their valuable support;
Staff and colleagues in Tuscia University, Department of Economics and Business for their support and warm friendships;
Colleagues and friends in Viet Nam for their support during my field work; My parents and sisters for their love, understanding and encouragement; and
Last but not the least, my wife, Tran Thi Hoai, wonderful daughters, Tran Ngoc Bao An and Tran Bao Chau, for their endless love and sacrifices.
Without support and encouragement from these organizations and individuals, this study would not have been successfully accomplished.
Table of Contents
Abstract ... i
Abstract (Italian version) ... ii
Acknowledgement ... iv
Table of Contents ... v
List of Tables ... viii
List of Figures ... x
List of Acronyms ... xii
CHAPTER 1. INTRODUCTION ... 1
1.1. Context of the study ... 1
1.2. Problem statement ... 2
1.3. Research aim, questions and scope ... 3
1.3.1. Aim ... 3
1.3.2. Research questions ... 3
1.3.3. Scope of the Study ... 3
1.4. Research design and data ... 3
1.5. Significance of the study ... 4
1.6. Structure ... 5
CHAPTER 2. BACKGROUND AND LITERATURE REVIEW ... 6
2.1. Introduction ... 6
2.2. Agriculture in Viet Nam ... 6
2.2.1. The country overview ... 6
2.2.2. Agriculture ... 7
2.2.3. Tea industry ... 9
2.3. Climate change and agriculture - global, regional and national contexts ... 10
2.3.1. Climate change and weather extremes ... 10
2.3.2. The threats to agriculture from climate change ... 11
2.3.3. Impacts of agriculture and food systems on climate change ... 13
2.4. Climate-smart agriculture... 14
2.4.1. Rationale and concept ... 14
2.4.2. The three pillars of CSA ... 15
2.4.3. Definition of CSA practices ... 18
2.5. Economics of CSA ... 18
2.5.1. Availability of CSA options and strategies ... 18
2.5.3. Economics of the mitigation component of CSA ... 20
2.5.4. Adoption barriers for CSA options ... 24
2.5.5. Economics and other knowledge of the adaptation component of CSA ... 27
CHAPTER 3. METHODOLOGY ... 31
3.1. Introduction ... 31
3.2. Methodology for farm model analysis ... 32
3.2.1. Farm enterprise analysis ... 32
3.2.2. Representative Farms ... 38
3.3. Methodology for adaptation assessment ... 39
3.3.1. Overlaying local and scientific knowledge – climate trend analysis ... 39
3.3.2. Overlaying local and scientific knowledge – household income and determinants ... 44
3.3.3. Overlaying local and scientific knowledge – household resilience ... 47
3.4. Methodology for mitigation assessment ... 48
3.4.1. Goal and scope definition ... 48
3.4.2. Activity data for CFP study ... 50
3.4.3. Choice of emission factors ... 51
3.4.4. Method used to calculate GHG emissions ... 53
3.4.5. Method used to estimate carbon sequestration ... 54
CHAPTER 4. STUDY SITES AND DATA ... 57
4.1. Introduction ... 57
4.2. Study sites ... 57
4.2.1. The Northern Mountainous Region of Viet Nam ... 57
4.2.2. Key farming systems in NMR ... 57
4.2.3. Production of main crops and livestock in the NMR ... 58
4.2.4. Tea production systems in the NMR ... 60
4.2.5. Climatic conditions in the NMR ... 62
4.2.6. Study provinces ... 63
4.3. Data sources ... 63
4.3.1. Data used for food security assessment ... 64
4.3.2. Data used for adaptation assessment ... 65
4.3.3. Data used for mitigation assessment ... 67
CHAPTER 5. RESULTS ... 71
5.1. Introduction ... 71
5.2. Farm model analysis ... 71
5.2.2. Enterprise livestock budgets ... 76
5.2.3. Representative farms ... 78
5.3. Adaptation assessment ... 81
5.3.1. Climate trend analysis: Overlaying local and scientific knowledge... 81
5.3.2. Overlaying local and scientific knowledge – household income and determinants ... 84
5.3.3. Overlaying local and scientific knowledge – household resilience ... 90
5.4. Mitigation assessment ... 93
5.4.1. GHG emissions in tea production systems ... 93
5.4.2. Carbon sequestration in tea plants ... 96
5.4.3. Carbon sequestration in tea soils ... 98
5.4.4. Carbon balance in tea systems... 100
5.4.5. Comparison of carbon storage between different tea plantations... 101
5.5. CSA assessment ... 102
CHAPTER 6. CONCLUSIONS ... 104
References... 109
APPENDIX A. PREPARATION AND CONDUCTING FOCUS GROUP DISCUSSION ... 123
APPENDIX B. PROCESSING AND OUTPUT OF FOCUS GROUP DISCUSSION ... 127
APPENDIX C. STATA DOFILEs ... 133
APPENDIX D. ADDITIONAL COMPARISONS OF INCOME & OTHER INDICATORS ... 139
APPENDIX E. ENTERPRISE BUDGETS FOR CROPS ... 140
APPENDIX F. ENTERPRISE BUDGETS FOR LIVESTOCK ... 150
APPENDIX G. REPRESENTATIVE FARMS ... 158
List of Tables
Table 1.1. Ranking of key export commodities (2013) ... 9
Table 1.2: GHG inventories in Vietnam ... 14
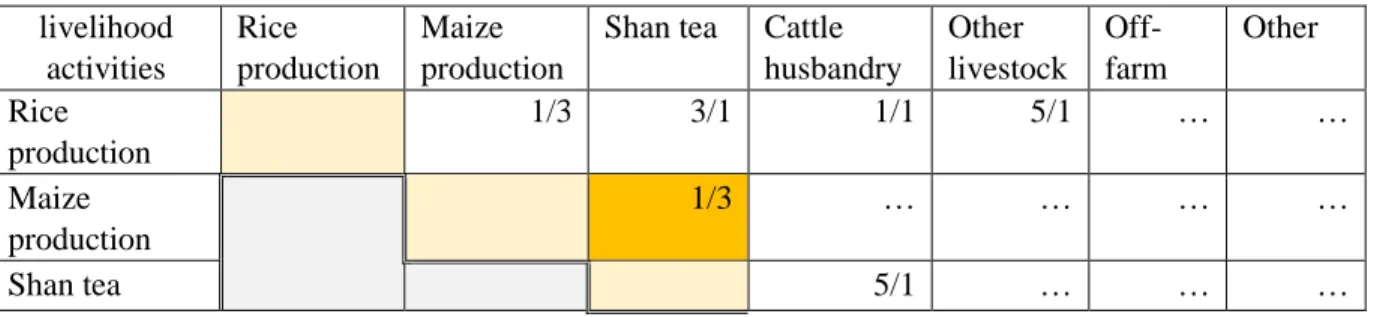
Table 3.1. A pair-wise comparison matrix of importance of livelihood to HH income ... 41
Table 3.2. Seasonality Index classes and rainfall regimes ... 44
Table 3.3. Emission factors used for quantification of GHG emissions in CFP ... 52
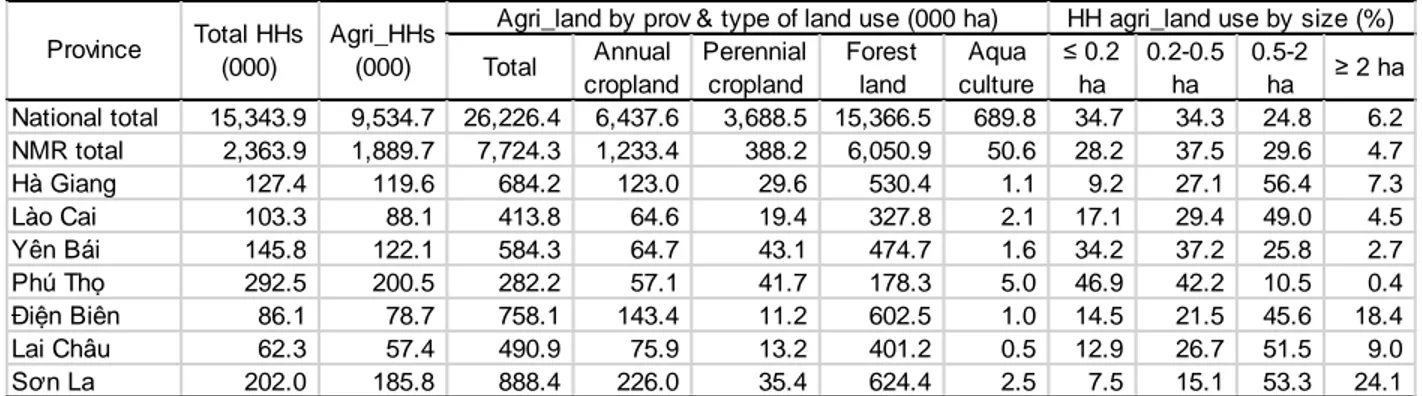
Table 4.1. Agricultural households, agricultural land by type of land use and size in 2011 ... 57
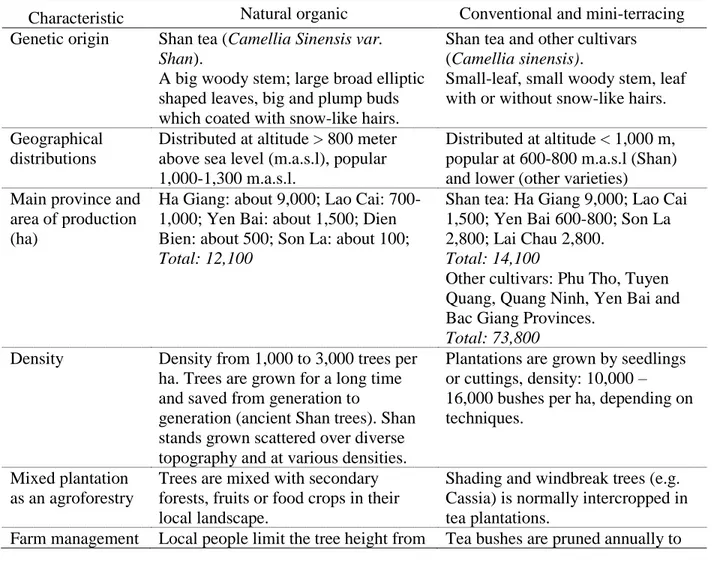
Table 4.2. Main characteristics of natural organic and intensive tea production in the NMR ... 61
Table 4.3. FAO-NOMAFSI survey summary ... 64
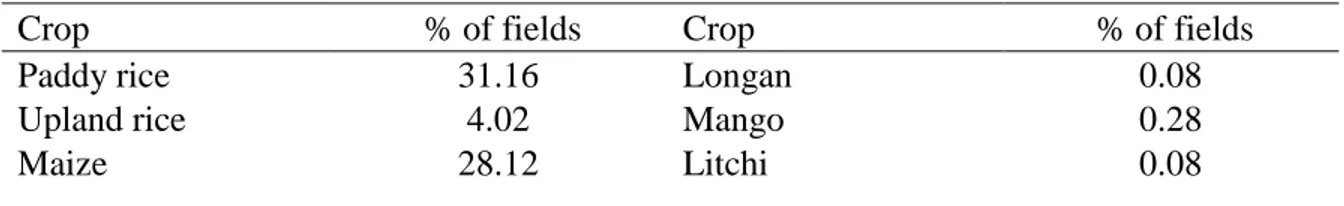
Table 4.4. FAO-NOMAFSI survey: percentage of fields recorded by crop in the main season ... 64
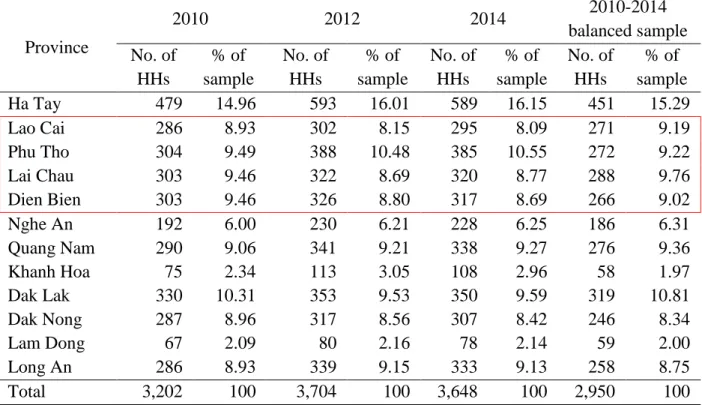
Table 4.5. The 2010-2014 total and balanced sample of households in VARHS data ... 66
Table 4.6. Total number of HHs by tea category and year ... 67
Table 4.7. Averaged inventory data on emission sources used for CFP study ... 68
Table 4.8. Tree diameter of new Shan tea cultivars in Gia Hoi, Yen Bai Province from 2004-2013 ... 68
Table 4.9. Summary distribution of Shan tea stands by diameter class in Lao Cai Province ... 69
Table 4.10. Soil organic carbon in some tea plantations in the NMR of Viet Nam ... 69
Table 5.1. Budget indicators by crop and technology ... 71
Table 5.2. Profitability indicators by crop and technology ... 75
Table 5.3. Investment costs in the initial phase of tea and coffee production ... 76
Table 5.4. Summary of profitability indicator by livestock ... 78
Table 5.5. Structuring Representative Farms ... 79
Table 5.6. Net income index, by RF and scenario ... 80
Table 5.7. List of EWEs and their importance rankings in tea communes ... 81
Table 5.8. Per capita net income, per ha total value of crop output, per capita food expenditure (000 VND) by rainfall variability and tea category household ... 85
Table 5.9. Per capita NI, per ha VCO, per capita Foodex (000 VND) ... 86
by variability of Tmax and tea category ... 86
Table 5.10. Per capita NI, per ha VCO, per capita Foodex (000 VND) by variability of Tav and tea category household ... 87
Table 5.11. Per capita NI, per ha VCO, per capita Foodex (000 VND) by variability of Tmin and tea category household ... 88
Table 5.12. Ranking livelihood’s importance to HH income ... 90
Table 5.13. Per capita income from agriculture (000 VND) ... 91
Table 5.14. Per household total value of crop output (000 VND)... 91
Table 5.15. Rating suitability of crops and trees to EWEs ... 92
Table 5.16. Average CO2-e emission by source and production stage ... 93
Table 5.17. Estimation of carbon sequestration in Shan tea stands ... 98
Table 5.18. Summary of SOC calculation in tea production system by age ... 99
Table 5.19. Assessment annual carbon balance at full development (tCO2-e/ha) ... 100
List of Figures
Figure 1.1. Household poverty rate, 1993-2014. ... 6
Figure 1.2. Real GDP per capita in Southeast Asian countries. ... 6
Figure 1.3. Growth in agricultural output in Viet Nam, 1990-2013 ... 7
Figure 1.4. The share of agriculture in GDP, employment, total exports and imports, 2000-2013 8 Figure 3.1. Overall Methodological Framework ... 31
Figure 3.2. System boundary of fresh tea CFP ... 50
Figure 4.1. Annual crop area (000 ha) ... 58
Figure 4.2.Annual crop production (000 ton) ... 58
Figure 4.3. Perennial crop area (000 ha) ... 59
Figure 4.4. Perennial crop production (000 ha) ... 59
Figure 4.5. Livestock production (000 head) from 2001 to 2015 ... 60
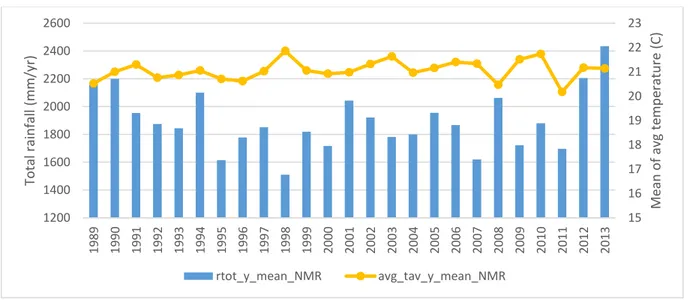
Figure 4.6. Trend of average total rainfall (left scale) and average temperature (right scale) in NMR ... 62
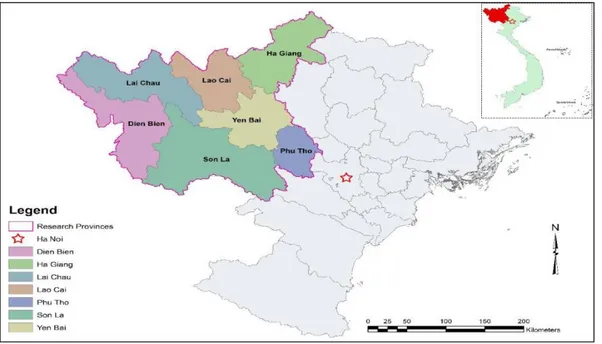
Figure 4.7. Research provinces in the NMR of Viet Nam ... 63
Figure 5.1. Gross margins over 30-year time horizon by crop and technology ... 73
Figure 5.2. Net margin over 30-year time horizon by crop and technology ... 74
Figure 5.3. Livestock gross margins over 30-year time horizon ... 77
Figure 5.4. Livestock net margins over 30-year time horizon ... 77
Figure 5.5. Net income by RF and scenario ... 79
Figure 5.6. Family labor required by RF and scenario ... 80
Figure 5.7. Farmer’s perception about EWEs occurring in the history in Bu Cao Village (Suoi Bu Commune, Van Chan, Yen Bai) ... 82
Figure 5.8. Farmer’s perception about EWEs occurring in the history in Nam Cuom Village (Nam Bung Commune, Van Chan, Yen Bai)... 83
Figure 5.10. Coefficients of variation of dekadal average temperature (1989-2013) ... 83
Figure 5.11. Year rainfall total in 1989-2013 ... 84
Figure 5.12. Yearly rainfall SIs 1989-2013 ... 84
Figure 5.13. GHG emissions by production technology pre-farm and on-farm... 94
Figure 5.14. Emission of GHG by source in pre-farm stage ... 95
Figure 5.15. Pre-farm GHG emissions ... 95
Figure 5.16. GHG emissions at farm stage ... 96
Figure 5.17. Emission of GHG by production stage in selected tea value chains ... 96
Figure 5.18. Estimation of carbon in biomass of conventional and mini-terracing practices ... 97
List of Acronyms
AGB Above Ground Biomass BGB Below Ground Biomass
CC Climate Change
CFP Carbon Footprint of Products CSA Climate-Smart Agriculture ERA ECMWF Reanalysis EWE Extreme Weather Event FGD Focus Group Discussion
FS Food Security
GDP Gross Domestic Product GHG Greenhouse Gas
GM Gross Margin
GSO General Statistics Office GWP Global Warming Potential
HH Household
IPCC Intergovernmental Panel on Climate Change
NM Net Margin
NMR Northern Mountainous Regions NPV Net present value
RF Representative Farm
SOC Soil organic carbon
TR Total Revenue
UNFCCC United Nations Intergovernmental Panel on Climate Change VARHS Viet Nam Access to Resources Household Survey
CHAPTER 1. INTRODUCTION
1.1. Context of the study
Viet Nam has achieved fast and stable economic growth in the last three decades. The country has made a successful transition from a poor to a dynamic middle-income economy. The poverty rate has dropped remarkably, from almost 60% to 13.5%, in the last two decades (World Bank and MPI, 2016). However, there are still more than 12 million people earning less than $2 per day (World Bank, 2013). Among the country’s seven ecological zones, the NMR is one of the poorest, where the poverty rate is about 10% higher the national average.
Agricultural production has achieved impressive progress since the 1990s, when the country was listed as a commodity exporter for the first time in the history. Today, Viet Nam has become one of the top five exporters of coffee, rice, cashew nuts, rubber, tea and cassava. Among these, rice, coffee, cashew nuts, and rubber have export turnovers of more than one billion $ per year, contributing substantially to national GDP. Despite strong competition from other sectors, agriculture continues to be a key contributor to current national GDP and a major source of income for 66.4% of the rural population. Nevertheless, since almost all accessible arable land has presently been converted to agricultural land, the scarcity in land resources could pose a major challenge in the future.
Climate change (CC) refers to a change in the state of the climate that can be identified (e.g. using statistical tests) by changes in the mean and/or the variability of its properties, and that persists for an extended period, typically decades or longer.2 Climate has already changed and is now a real threat to ecosystems on earth. Global mean temperature has increased over the last 100 years and is expected to continue rising. Extreme weather events are the most immediately accessible phenomena of CC that are discussed in the literature. Southeast Asia has already experienced CC in terms of temperature and sea level rises over the last 20 years. Viet Nam has been ranked among the five countries most vulnerable to CC, especially to sea level rise. As a result, Viet Nam’s agriculture could face more difficulties than other neighboring countries. Tea plays a significant role in developing countries in terms of poverty reduction and food security (FS), and is one of the most important cash crops globally (FAO, 2015). In Viet Nam, tea is also among the key income generators, especially in the NMR, where more than 70% of Vietnamese tea is grown. Globally, CC has had significant impact on tea growth and production,
since the plant is popularly grown in rain-fed, mono-cropping systems. However, the potential of CC mitigation in tea systems is not yet insightfully understood. Therefore, there is a need to better understand mitigation and adaptation measures in tea production systems, as well as the costs and benefits related to implementing such practices (FAO, 2015).
1.2. Problem statement
Agriculture is the major economic sector in many developing countries, including Viet Nam. As many as 75% of the poor in developing countries live on agriculture and farmers remain the largest group dependent on natural resources on earth (Branca et al., 2009). The central role of agriculture in FS is expected to become even more important and challenging, in the coming decades as the world population is set to increase by 1.5 billion by 2050. At the same time, agriculture is the major contributor to global GHG emissions. Two-thirds of these emissions are reportedly coming from developing nations. Technically, these countries have a high potential to contribute to GHG mitigation.
CC, which is essentially the result of a build-up of GHG emissions (including many anthropogenic sources) has already altered global, regional and national food production systems in various ways at multiple scales. The average global temperature and sea levels are expected to continue rising, threatening crop productivity even further, as well as endangering many low-lying, coastal ecosystems around the world. Among these, Southeast Asia and Viet Nam are the most vulnerable. CC-induced EWEs are expected to increase in terms of frequency and intensity. Agriculture and food systems are required to transform and re-orient in order to supply adequate food for the increasing world population and at the same time, to consider reducing GHG emissions in fighting planetary warming (Campbell et al., 2014; FAO, 2013; Lipper et al., 2014). CSA is an integrated approach to sustainably drive such system transitions at multiple scales. CSA addresses these challenges by sustainably increasing FS, building CC resilience and contributing to GHG emissions reduction and enhancing carbon sequestration, where possible. Recently, CSA has been increasingly incorporated and repeatedly discussed in many international fora on policies for FS, agriculture and CC. While many agricultural technologies and strategies are reportedly climate-smart, site-specific evidence is still needed to highlight their contributions to CSA objectives, as well as policy implications (Arslan et al., 2015; FAO, 2013).
This research provides evidence to assess such contributions of various tea production systems as a potential CSA practice in Viet Nam, providing an important contribution in filling the knowledge gap, especially in a developing country like Viet Nam.
1.3. Research aim, questions and scope
1.3.1. Aim
The aim of this research is to assess the contribution of various tea production systems to the three pillars of CSA, i.e. productivity, resilience and mitigation, in the Northern Mountainous Region of Viet Nam.
1.3.2. Research questions
Question 1. What are the profitability and economic competitiveness of tea production in the study area?
Question 2. What is the potential for tea production in building adaptive capacity to climate change related shocks?
Question 3. What are mitigation co-benefits in tea production and where is the best opportunity for reducing greenhouse gas emissions and enhancing carbon sequestration?
Question 4. What is the CSA potential of tea production in the study area? 1.3.3. Scope of the Study
This research deals mainly with tea practices and partly with other crops and livestock in the NMR of Viet Nam; our findings are highly context-specific and may not be generalized to the same crop in other settings.
Although fresh tea production is a primary part of the value chain, our research mainly looks at the farm level only. Tea, maize, upland rice and coffee are among targeted crops included in the research. In addition, as livestock is an important part in the mixed farming systems commonly practiced in the NMR, cattle, buffalo and pigs are also studied in terms of their contribution to FS.
1.4. Research design and data
This research comprises three components that address the three pillars of CSA, namely; FS, adaptation and mitigation. A farm model is developed using partial budgets to analyze the economic performance of farm practices as mentioned above. These will be used to evaluate the
economic contribution of tea practices in addressing the productivity or FS objective under local climate conditions.
In the second component, local and scientific knowledge are combined to assess the potential of tea production in enhancing adaptation capacity of local farming systems to CC related stressors. The adaptation potential is discussed in three layers: climate trends analysis, HH income and its correlations across HHs that have different production portfolios (tea vs. non-tea) under various climate related shocks to assess their capacity to cope with shocks.
The third component investigates mitigation co-benefits of tea production systems by estimating carbon emissions and sequestration within a defined system boundary. Life cycle assessment (LCA) framework is partially used in this carbon footprint study. In this component, natural organic tea stands are integrated into mitigation assessment in order to see if they have higher mitigation benefits than that of intensive production, particularly in terms of biogenic carbon sequestration.
In the first component, datasets collected by FAO in collaboration with NOMAFSI3 (FAO-NOMAFSI dataset) on costs and benefits of a large set of farm activities in the region and the 2011 Agricultural Census data are used for analysis. Viet Nam Access to Resources Household Survey (VARHS) datasets are combined with ERA-Interim climate datasets to provide a panel data for adaptation analysis. Results of these analyses are then cross-validated with farmers’ perceptions derived from focus group discussions. In mitigation assessment, the same FAO-NOMAFSI dataset is used to quantify different sources of GHG emissions. Data used for estimating carbon sequestration are taken from secondary sources.
1.5. Significance of the study
In Viet Nam, there have been many international and national efforts to deal with the impacts of CC, mainly concentrated in coastal regions, especially in the Mekong River Delta. A number of support projects and programs on rice, shrimp or fruit crops have been implemented in these areas. Although being highly vulnerable to CC, the NMR has not been the focus of these efforts, much less so for research activities on CC and FS. Therefore, this research could be considered as pioneer in the region, where natural systems and people are more disadvantaged.
Since CSA is multi-dimensional and contextual, this research has advanced the topic by successfully employing a multidisciplinary framework into a CSA analysis: farm model for FS
analysis, combination of local knowledge, socio-economic data and satellite based weather data for evaluating adaptation, and a biophysical process for GHG assessment.
This research has been conducted in Viet Nam, which is considered a hotspot of global CC vulnerability. It provides not only a novel multi-disciplinary evidence base to support CSA policies and programs, but also a background for other research and policy development for smallholder farmers.
1.6. Structure
The rest of this dissertation is structured as follows:
Chapter Two reviews key concepts related to CSA and its practices, as well as to its adaptation and mitigation potential. The chapter also discusses the current issues of CSA economics that conceptualize the research framework.
Chapter Three describes methodology and analytical steps. It first explains how farm model analysis is applied for the analysis of gross margins and profitability for crops and livestock. Methods and tools for capturing local knowledge and for describing statistics are also elaborated in the second section. Finally, the chapter presents a partial life cycle assessment approach used to study carbon footprint in tea production systems.
In Chapter Four, background information about the NMR and farming systems is presented and datasets used for analysis are detailed. Lastly, research provinces and boundaries are discussed to set the background of the study.
Chapter Five presents the results of data analysis in which economic parameters of tea production are compared with other crops to evaluate the opportunity cost and viability. Livestock is also considered in enterprise budgets and representative farms in order to capture its added value to farm incomes, as well as adaptation benefits. It also discusses the mitigation potential of tea production systems by evaluating carbon emissions and sequestration in the system boundaries. Lastly, the synergies between productivity, adaptation and mitigation are presented as an evidence base for tea production systems addressing CSA objectives in the NMR of Viet Nam. In Chapter Six, conclusions are presented in response to the research questions. The chapter also discusses policy implications and study limitations.
CHAPTER 2. BACKGROUND AND LITERATURE REVIEW
2.1. Introduction
This chapter presents the research background and a review of relevant literature. In the first part, background information related to agricultural development in Viet Nam and interactions between climate change and agriculture at all scales are provided. In the second part, the chapter reviews the CSA concept and key assessment tools in order to conceptualize the research framework. Farm activity gross margins, household income, food security issues, mitigation measurements, costs and benefits of different practices, adaptation options and measuring methods are also discussed.
2.2. Agriculture in Viet Nam
2.2.1. The country overview
Viet Nam has achieved fast, stable, and inclusive economic growth in the last three decades since
Đổi Mới or “Renovation” - the turning point
launched in 1986. The country has made a remarkable transition from being one of the poorest nations in the world to being a dynamic middle-income economy, achieving an average real per capita growth rate of 5.5% over the period of 1991-2014. Per capita GDP rocketed from around $100 in 1990 to about $2,200 in 2015 at current prices. (World Bank and MPI, 2016).
Figure 1.1. Household poverty rate, 1993-2014. Source: World Bank and MPI (2016)
Figure 1.2. Real GDP per capita in Southeast Asian countries.
Source: Tarp et al. (2015) based on World Bank World Development Indicators
Box 1.1. Viet Nam – a snapshot (Source: GSO, 2016).
Population, million (2015) 91 Territory, thousand km2 331 Life expectancy at birth,
total years (2015)
75
Minorities 54
The poverty rate has fallen rapidly based on various international and national poverty lines (Figure 1.1). Considering jointly the General Statistics Office (GSO) and World Bank reference line, the poverty rate in Viet Nam dropped from 58% in 1993 to 13.5% in 2014. In the Southeast Asian Region, Viet Nam, however, remains a relatively poor nation with a GDP per capita that is far below that of Malaysia, China, and Thailand, and similar to that of Philippines (Figure 1.2). 2.2.2. Agriculture
Three quarters of the country’s territory is made up of mountains and hilly regions. Each year, there is about one million people being born. Therefore, Viet Nam faces a scarcity of agricultural land. Per capita agricultural land is just 0.12 ha, equivalent to just one-sixth of the world average (OECD, 2015). Nonetheless, the 1986 “Renovation” and the 1988 “Farmland
De-collectivization” have triggered fast and impressive progress in agricultural production since the
1990s. In terms of volume, from 1990 to 2013, agricultural production has increased remarkably by 206%, with crop production going up by 189% and livestock production by 282% (Figure 1.3). The annual growth rate of the sector in this period was 4.9% on average, with an impressive rate of 5.5% in 1990-2000, which slightly slowed down to 4.4% in 2001-2010, and 4.2% in 2011-2013. Rice and pigs are among the most important commodities in agriculture, respectively accounting for 35% and 18% of the sector’s total production value in 2012 (OECD, 2015).
Figure 1.3. Growth in agricultural output in Viet Nam, 1990-2013
Source: Adapted from OECD (2015) based on FAOSTAT (2015),World Development Indicators.
Despite the high growth rate in the last two decades, the sector’s share in national GDP and in total employment has declined moderately from 1990 to 2013, because industry, construction and
0 1 2 3 4 5 6 7 8 9 0 50 100 150 200 250 300 350 400 450 1990 1995 2000 2005 2010 2013 1990=100
Total output growth rate (right scale) Total output Crops Livestock Annual growth rate, %
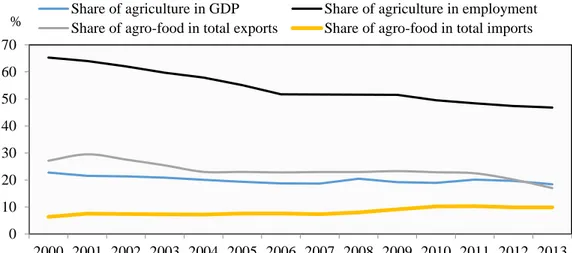
services all have been achieving faster and more substantial growth rates. However, agriculture (including fisheries and forestry) continues to be a key contributor to current GDP, at more than 18% (after falling from 39% in 1990 to 20% in 2004), as well as a major source of income for 66.4% of the rural population. Although agriculture’s share in employment fell from 65% in 2000 to 47% in 2013, it is still 2.5 times higher than its share in GDP (Figure 1.4). This implies that the sector has a low level of labor productivity and a high level of agriculture-dependent HHs. In that period, agriculture’s share in total exports dropped from 27% to 17%, while its share in total imports increased from 6% to 10%. However, its share of GDP has remained stable at around 20% in recent years.
Figure 1.4. The share of agriculture in GDP, employment, total exports and imports, 2000-2013
Source: OECD, 2015 based on World Development Indicators; UN (2015), UN Comtrade Database; GSO (2014), Statistical Yearbook of Vietnam 2013.
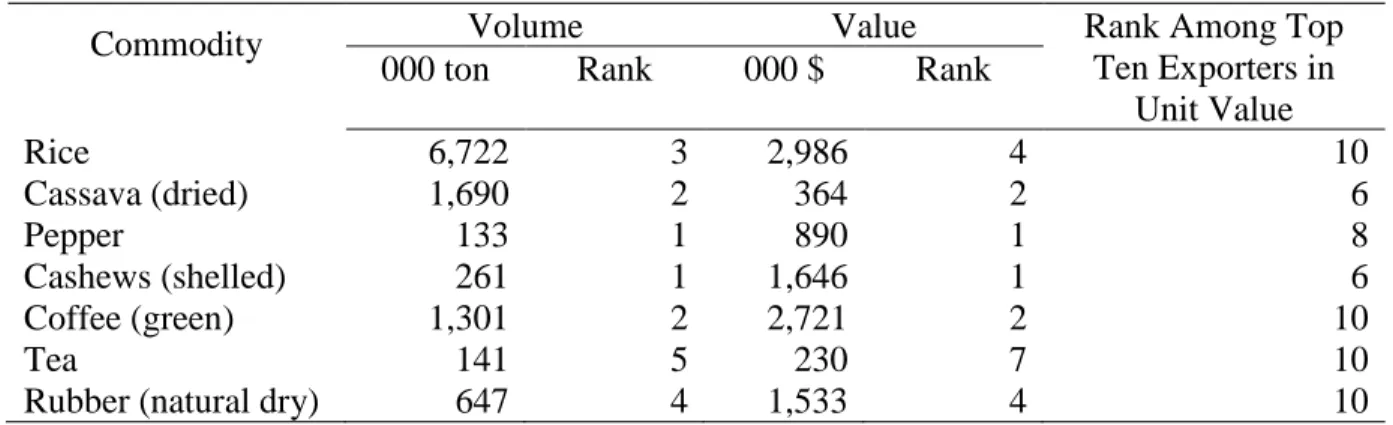
In terms of export volume and value, Viet Nam is among the top five leading exporters for commodities listed in Table 1.1. Among these, rice, coffee, cashew, and rubber have turnovers of more than one billion USD. The value of agriculture, forestry, and fishery exports increased rapidly from about $0.5 billion in 1986 to $30.9 billion in 2014, achieving a growth rate of 17 percent per year. Yet, most exports are sold at lower prices compared to other leaders. Some Vietnamese commodities such as rice and Robusta coffee, in spite of having competitive advantages, are exported at a lower unit value than that of peers. For example, the average value of Viet Nam’s tea is $1,524 ton-1 in 2013, 40% lower than that of India’s ($2,688) and Kenya’s ($2,799) tea. All of these indicate that the Vietnamese agricultural sector has a lot of potential for improving value addition in global value chains.
0 10 20 30 40 50 60 70 2000 2001 2002 2003 2004 2005 2006 2007 2008 2009 2010 2011 2012 2013 % Share of agriculture in GDPShare of agro-food in total exports Share of agriculture in employmentShare of agro-food in total imports
Table 1.1. Ranking of key export commodities (2013)
Commodity Volume Value Rank Among Top
Ten Exporters in Unit Value
000 ton Rank 000 $ Rank
Rice 6,722 3 2,986 4 10 Cassava (dried) 1,690 2 364 2 6 Pepper 133 1 890 1 8 Cashews (shelled) 261 1 1,646 1 6 Coffee (green) 1,301 2 2,721 2 10 Tea 141 5 230 7 10
Rubber (natural dry) 647 4 1,533 4 10
Source: GSO (2016 ) and adapted from World Bank (2016).
In spite of the significant growth in the past decades, Vietnamese agriculture may face several challenges in the future. One of these is the scarcity in land resources since almost all accessible arable land has presently been converted to agricultural land. Further production growth needed by both the increasing domestic population and export markets requires not only land resources but also higher yields and inputs which are already high compared to Asian countries (OECD, 2015).
2.2.3. Tea industry
Today, tea plants are cultivated in 52 countries in all continents with Asia being the largest producer and consumer. In 2012, the total land area under tea cultivation was 3.36 million hectares and production was 4.78 million tons (FAO, 2015). Tea, coffee and cocoa are the three most popular non-alcoholic beverages worldwide. Tea is commonly processed and consumed in one of three typical types, namely green tea (non-fermented); white, yellow or Oolong tea (semi-fermented); or black tea (full-fermented). Black tea is popularly consumed in Asian and some Western countries, accounting for 78% of the global production. Markets for green and Oolong tea are mainly in Asia (Chen et al., 2013).
Tea has been grown in Viet Nam for commercial harvest since the last century and is currently widespread in 30 provinces. The NMR, though being one of the poorest areas with high concentration of ethnic minorities, is the largest tea planting region in the country, accounting for more than 70% of tea production area and output in the country (GSO, 2016a). Nationally, total dried production has increased significantly, from 32 thousand tons in 1990 to 238 thousand tons in 2015, representing an average growth rate of 9% annually. Similarly, harvested area has also grown steadily from 60 thousand ha in 1990 to 116 thousand ha in 2015, at an annual growth rate
of 4.5% (GSO, 2000 and 2016 ). Total production output has achieved a stable annual growth rate of 4.4%, benefiting greatly from varietal, technical and marketing improvements.
Green tea is a traditional and popular beverage in Viet Nam, however, only about 25% of processed tea, mostly green type, is consumed domestically. The majority is for exporting, predominantly in bulk, semi-finished, black tea. Middle East is the most popular market for Vietnamese OTD4 black tea while Europe and America are common markets for CTC5 black tea. The green tea, accounting for only 20% of export volume, is mainly exported to Pakistan, Taiwan and China. Viet Nam is the fifth biggest tea exporter in the world, with an export volume of 131 thousand tons in 2016, valued at 217 thousand USD (GSO, 2016b). The current value is about 10 times the value in 1990 (25 million USD), thanks to the real increase of 8% per year the industry has recorded between 1990 and 2011.
2.3. Climate change and agriculture - global, regional and national contexts
2.3.1. Climate change and weather extremes
According to the Intergovernmental Panel on Climate Change (IPCC, 2007a), weather includes daily changes in temperature, precipitation, barometric pressure and wind in response to a series of natural causes. Climate is defined as the average of weather over a period of time. CC refers to uncommon climatic changes and more exactly, the average change of weather conditions observed and recorded over decades or longer. CC is strongly associated with anthropogenic GHG emissions which alter the composition and ratio of carbon dioxide (CO2) and nitrous oxide (N2O) in the global atmosphere and thus, cause global warming. Climate has already changed and is now a real challenge to the planetary ecosystem. Global mean temperature has increased by 0.74°C over the last 100 years, and it is expected to rise between 1.1 to 6.4°C by the end of the 21st century, depending on projected scenarios (IPCC, 2007a).
CC differs from climate variability, because CC is characterized by longer term variations of weather conditions and influenced by human activities, whereas climate variability implies variations of natural and shorter-term weather conditions (IPCC, 2007a, 2014). Climate extremes or extreme weather events (EWEs) are the most immediate phenomenon of CC discussed in the literature. EWE is defined as weather conditions that are at the extremes of the range of weather conditions experienced in the past. The definition depends on the area and is based on what
4 OTD - Orthodox
deviates from ‘normal’ in a particular area for a particular period at a particular time (IMHEN and UNDP, 2015)6. EWEs, though being very contextual, have been observed and projected to increase both in terms of frequency and intensity in many parts of the world (Francisco, 2008; Hoang et al., 2014; Kibue et al., 2016; Vermeulen et al., 2012).
Southeast Asia has already experienced CC in terms of temperature and sea level rises over the last 20 years. Between 1981 and 2005, the average land and sea temperatures have increased by 0.34 and 0.38°C compared to the 1961-1980 period, respectively. It is projected that the sea temperature in the region will continue to increase at a higher rate than global sea temperatures. The region’s land temperature rise is projected to reach 1.59°C in 2050, 1.96°C in 2080 and 2.46°C in 2100 (IPCC, 2014). In terms of sea levels, it is predicted that coastal systems in Southeast Asia will experience a greater impact, being among the most vulnerable coastal regions globally (Lassa et al., 2015).
Viet Nam has been ranked among the five countries likely to be the most vulnerable to CC and especially sea level rise, because a high proportion of its population and economic assets are in coastal lowlands and deltas (Cruz et al., 2007; Dasgupta et al., 2007; World Bank, 2013, 2016). Between 1958 and 2014, annual average temperature in Viet Nam has increased about 0.62°C (0.10°C per decade, lower than global value of 0.12°C). Sea levels have risen at a rate of 3.34 mm per year in the 1993-2014 period (MONRE, 2016). The comprehensive report prepared by the Ministry of Environment and Natural resources (MONRE) entitled "Current Climate Change, Sea Level Rise Scenarios for Viet Nam” shows that annual average temperature will increase by 1.3–2.3°C and the sea level rise will be between 14–36 cm by 2050 (MONRE, 2016). Seasonal variability in precipitation is also projected to increase, causing the wet season to get wetter and the dry season to become drier in some places. Extreme rainfall events and floods are also expected to be more likely, particularly in the northern region where landslides have become more frequent in the face of deforestation (IMHEN and UNDP, 2015).
2.3.2. The threats to agriculture from climate change
At the global scale, recent CC has had widespread and profound impacts on various aspects of natural systems and human livelihood activities (Smith et al., 2014). CC has been altering global food systems, especially agriculture and fisheries, through increasing the frequency and intensity of climate shocks and EWEs. In agriculture, CC impacts are commonly linked with scientific
6 IMHEN: Institute of Meteorology, Hydrology and Climate Change
knowledge on crop, livestock, fishery production and agricultural systems. Globally, six major food crops are estimated to have a climate-related reduction of 40 Mt7 per year from 1981 to 2002 (Lobell and Field, 2007). Similarly, maize and wheat have been estimated to have suffered a global net loss of 3.8% and 5.5%, respectively, due to the negative impacts of climate trends on major producers in 1980-2008 (Lobell et al., 2011).
In the future, rice yields will decrease by 10%, when the temperature increases by 1oC and thus, it follows that by 2050 rice yields will be reduced by at least 10% because the global average temperature is estimated to increase by 1oC. Likely, maize yields will be at 3-6% less (IPCC, 2007b). Looking further ahead, Battisti and Naylor (2009) indicate that the persistent rise in mean temperatures could exceed current extremes in tropical and subtropical regions by 2100. Once that happens, the temperature is more likely to cause further impacts on crop production worldwide, as crop yield will drop dramatically when temperatures exceed critical physiological thresholds. Likewise, small changes in temperature at critical stages of plant growth could damage most crops (FAO, 2013).
In Southeast Asia, sea level rise poses a major concern for rice production since it could submerge the low-lying delta and coastal areas that contain most rice paddies (Lassa et al., 2015). Increases in water levels in rice fields and soil salinity could prevent normal crop growth and grain formation. Greater variability in precipitation and frequency of heavy rainfall events as indicated by IPCC (2014) may increase the risk in rice and other crop production. Apart from floods, droughts, pests and diseases have also caused serious damage to many other cash crops in the region, such as maize, cassava, and soybean.
Being highly vulnerable to CC, agriculture in Viet Nam has been facing more difficulties than in other ASEAN nations. In the period of 1961-2010, various EWEs have been observed to have spatial and temporal impacts across the country’s ecological regions and agricultural production (IMHEN and UNDP, 2015), including longer dry seasons and water shortages in the North and Central Regions; longer periods of the West dry winds, and more frequent and intense hot spells in the Central Region (Hoang, 2011). Cold spells, droughts, pests and diseases are likely to be more unpredictable and could become major stressors for food crops (IMHEN and UNDP, 2015). Without adaptation, by 2050 Viet Nam could lose total agricultural value added by 5.8–13.9 % compared with the value in 2010 (World Bank, 2010).
2.3.3. Impacts of agriculture and food systems on climate change
Agriculture and food systems are major contributors to the human-induced GHG emissions that drive CC. Therefore, understanding the environmental impacts of agri-food systems is crucial to mitigating CC in a holistic way. If both pre- and post-farm activities are included, agro-food systems globally released 9,800-16,900 megatons of carbon dioxide equivalent (MtCO2e) in 2008, making up 19%-29% of total anthropogenic GHG emissions (Bellarby et al., 2008; Steinfeld et al., 2006; Smith et al., 2007; Blaser et al., 2007; and Chen et al., 2010 cited in Vermeulen et al. (2012)). Today, modern agriculture is largely dependent on inputs such as fertilizers and livestock feeds. Fertilizer production is one of the key sources of GHG emissions in agriculture, reportedly ranging from 284-575 Mt of CO2e, which result mainly from energy consumption and partly from manufacture of nitrate fertilizers. Postproduction, including processing, storage and retailing activities, is also considered a major contributor to GHG emissions in global food systems (Vermeulen et al., 2012).
Within agri-food chains, agricultural production, through agricultural practices (direct emissions) and land use change (indirect emissions), becomes the largest GHG contributor. Of global anthropogenic emissions, on-farm production totally emits 80%-86%, direct emissions account for approximately 60% of N2O emissions (through fertilizer application) and about 50% of CH4 emissions (from livestock and rice production) in 2005 (Smith et al., 2007). In 2010, annual total non-CO2 GHG emissions from agriculture were estimated at 5.2–5.8 Gigatons (Gt) of CO2e per year, making up about 10-12% of global anthropogenic emissions (Smith et al., 2014). These figures are similar to estimations made by Smith et al. (2007).
In Viet Nam, according to the Second National Communication to UNFCCC8 (MONRE, 2010), annual emissions from agriculture have increased significantly from 1994 to 2005. The sector’s emissions are projected to rise more in the coming decades since the economy is still relying on agriculture to meet the national food and feed demand, as well as for the international market (Lam, 2016). This trend is aligned with FAO’s projection (2013) that as agricultural production continues to increase in the developing world, so are agricultural emissions. Incidentally, per capita GHG emissions in Viet Nam have increased six fold (from 0.3 tons in 1990 to 1.71 tons in 2010), which underlines the need for studies on the mitigation potential of Vietnamese agriculture.
Table 1.2: GHG inventories in Vietnam Sector 1994a 2000a 2005b million tons of CO2-e % million tons of CO2-e % million tons of CO2-e % Energy 25.6 24.7 52.8 35.0 101.9 56.0 Industries 3.8 3.7 10.0 6.6 14.6 8.0 LULUCF 19.4 18.7 15.1 10.0 -27.0 -14.8 Agriculture 52.5 50.5 62.5 43.1 83.8 46.1 Waste 2.6 2.4 7.9 5.3 8.6 4.7 Total 103.9 100.0 150.9 100.0 181.9 100.0
Source: a Second Communication Report, MONRE (2010).
b Interim Report, JICA Inventory Capacity Building Project (2014).
2.4. Climate-smart agriculture
2.4.1. Rationale and concept
The Food and Agriculture Organization of the United Nations (FAO, 2013) forecasts that the world’s population will increase by one-third by 2050, or 2.4 billion people, mostly living in developing countries. Meanwhile, agriculture, together with fishery and forestry, is, in the face of increasing demand, driven by socioeconomic trends and of sustaining supply stressed by environmental challenges. CC caused by global warming is one of those environmental stressors. Inversely, agriculture is the main contributor to global warming. It is projected that agricultural production has to increase by 60% by 2050 in order to meet the demands for food and feed. Therefore, CC and its associated impacts will obviously make this task even more challenging (Godfray et al., 2010). Agriculture must become more climate-smart so as to achieve food security while remaining functional and efficient under such multiple stressors (FAO, 2013). CSA was firstly presented by FAO at the Hague Conference on Agriculture, Food Security and Climate Change in 2010. The CSA concept initially focused on FS only, but later included CC adaptation and mitigation in addressing the interlinked challenges of FS faced by CC (FAO, 2010 and 2013). Since its conception, although it is not clearly defined in the academic literature (Engel and Muller, 2016), CSA has been rapidly incorporated into different international agendas as well as repeatedly highlighted at UNFCCC Conference of the Parties. Today, it has a wide ownership among governments, regional and international agencies, civil society and private sector (FAO and CCAFS, 2014)9 and is still evolving.
CSA integrates several dimensions of sustainable development through addressing FS and climate challenges at the same time. CSA is defined and presented by three objectives or pillars: (i) sustainably increasing agricultural productivity to enhance incomes, FS and development; (ii) adapting and building resilience to CC; and (iii) decreasing GHG emissions from agriculture in relation to past trends and increasing carbon sequestration (FAO, 2010, 2013; FAO and CCAFS, 2014). CSA simultaneously considers these dimensions in the assessment of site-specific contexts to maximize the synergies and minimize trade-offs between FS, and CC adaptation and mitigation (FAO, 2013). While CSA is increasingly recommended as a sound strategy in addressing FS as well as in prioritizing short- and long-term agricultural policies in a less predictable climate, site specific and empirical studies are still needed to determine promising CSA technologies and strategic options under such contextual conditions (Arslan et al., 2017; 2015; Rosenstock et al., 2016).
CSA adopts an integrative approach to identify and operationalize sustainable agricultural development and to mainstream technical, policy and investment arrangements in achieving national and global FS. This approach also aims at strengthening livelihoods and FS, particularly smallholders in developing countries, by improving the management and use of natural resources and adopting appropriate technologies and practices in the food systems (Neufeldt et al., 2013). Nevertheless, the CSA evidence base has been found to have more a farm level than value chain focus. Main bodies of CSA works in the literature are agronomy, agroforestry, livestock, post-harvest management, and energy systems (Rosenstock et al., 2016).
2.4.2. The three pillars of CSA
2.4.2.1.Food security in the CSA context
FS is broadly defined by the World Food Summit (1996) as “existing when all people, at all
times, have physical and economic access to sufficient, safe and nutritious food that meets their dietary needs and food preferences for an active and healthy life”. FS is built on four pillars: (i)
physical availability of food, which addresses the “supply side” of FS and is determined by the level of food production, stock levels and net trade; (ii) economic and physical access to food, including incomes and access to markets; (iii) food utilization, i.e. the way the body makes the most of various nutrients in the food, which is influenced by people’s health status; and (iv) stability of FS “at all times”, which emphasizes the importance of having to reduce the risk of adverse effects on the other three dimensions.
In CSA terms, the FS objective refers to option and technology that sustainably increase productivity or HH income and at the same time, capture mitigation co-benefits by optimizing crop production per unit area while accounting for social and environmental impacts (Bennett et al., 2014; FAO, 2013; Lipper et al., 2014). Increasing FS could result from changes in availability of food (e.g. increased yield), accessibility of food (e.g. increased income, access to market), utilization of food (e.g. increased food safety, diet diversity), or stability of access to food. In this sense, stability of access also targets the resilience of the system because stability depends on resilience (Rosenstock et al., 2016).
As crop and livestock productivity varies significantly across geographic regions, Godfray et al. (2010) strongly suggests closing the yield gap in order to considerably increase the food supply required by continuing global population and consumption growth. However, the future food production has to minimize the negative “externalities” that include the release of GHG emissions as compared to current trends. Campbell et al. (2014) also highly support integrating sustainable intensification into CSA strategies, because the approach promotes food production from existing farmland while considering lower environmental consequences. Sustainable intensification also addresses both adaptation and mitigation.
2.4.2.2.Adaptation and resilience
According to IPCC (2001), adaptation means “adjustments in ecological, social or economic
systems in response to actual or expected climatic stimuli and their effects and impacts, to moderate potential damages or take advantage of opportunities associated with climate change”.
Adaptation to CC needs to be integrated properly into national development plans. Building resilience through adaptation measures is essential to ensure that development achievements are not compromised or negated by CC. In agriculture, FAO (2013) defines adaptation as “capacity
of agricultural systems, communities, households or individuals to prevent or cope with risk or uncertainty and recover from shocks”. Interchangeably, resilience is defined as the capacity to
adapt to changes and disturbances and, at the same time, maintain core functions. Additionally, adaptive capacity refers to human and ecosystem ability to adjust to CC and carry out adaptation measures to avert negative impacts (Bogdanski, 2012; Francisco, 2008; Hoang et al., 2014). At the HH level, vulnerability means the degree to which HHs are adversely affected by CC-induced climate extremes. On the other hand, resilience measures how much these impacted HHs could rebound after climate shocks. Such resilient variables are difficult to quantify. Therefore,
adaptation metrics in relation to CSA practices should be placed on any biophysical, social or economic resilience which help the practitioner or the system to buffer against shocks and stressors (Descheemaeker et al., 2016). An effective adaptation strategy enables them to systematically implement a set of proactive and reactive actions to cope with current and future changes, such as increased frequency and intensity of EWEs.
FAO (2008) classified three types of adaptations: Anticipatory or proactive adaptation –those undertaken before impacts are observed; Autonomous or spontaneous adaptation; and Planned adaptation. The strategies to build resilience against the potential effects of EWEs and climate variability aim at reducing vulnerability and increasing adaptive capacity at all levels (Taimeh, 2013). For developing countries, UNFCCC (2011) proposes strategies that address a combination of environmental stresses, enhance FS and HH income, improve water availability, and promote sustainable land management (SLM), as the most effective.
2.4.2.3.Mitigation
IPCC (2001) defines mitigation is “an anthropogenic intervention to reduce the sources or
enhance the sinks of greenhouse gases”. CC mitigation associates with strategies and actions to
decrease GHG levels through potential practices that mitigate or remove carbon from the atmosphere and store them in different pools, thereby minimizing the negative impacts to global warming and CC. Measurement and quantification of emission reduction or carbon sequestration are supported by available biophysical models that will be presented in later sections.
GHG emissions can be decreased by: (i) supply-side strategies such as reduction of GHG emissions per unit of product; or (ii) demand-side options, e.g. changing demand for food and fiber products or reducing food waste (Smith et al., 2014). Agriculture has an important role in providing supply-side mitigating options through: (i) improvement biological carbon capture and storage in biomass and soil e.g. increased carbon sequestration per unit area– acting as “carbon
sinks”, especially in carbon-rich ecosystems and conservation of existing carbon stocks; (ii)
reducing direct GHG emissions (CO2, N2O, CH4) by applying good agricultural/CSA practices (e.g. sustainable technologies, improved feeding and livestock husbandry); (iii) improving efficiency of input application (e.g. reducing emissions from fossil energy or fertilizer use); and (iv) reducing carbon losses through switching to better land use models (Engel and Muller, 2016; FAO, 2013; Smith et al., 2014).
On the demand side, GHG emissions could be reduced through changes in food demand, including: (i) reductions of losses and waste in the food supply chain (e.g. enhance post-harvest technology and instruments or increase energy use efficiency in the food chain, in which ~30-40% of all food is lost (Godfray et al., 2010)); (ii) changes in eating habits towards less GHG-intensive food (e.g. increase replacing livestock-based products by plant-based product foods where possible (Godfray et al., 2010; Smith et al., 2014)).
2.4.3. Definition of CSA practices
It is worth noting that CSA is not a new set of practices that could be applied universally, but rather an integrated approach to the implementation of agricultural development policies and programs that promote productivity enhancement and adaptive capacity under the realities of CC, while capturing mitigation co-benefits at the same time (FAO, 2013; Lipper et al., 2014). CSA involves different elements and local contexts. CSA key elements are: (i) farm management for sustainable use of natural resources, to produce more with less input and emissions; (ii) landscape solutions to enhance and conserve ecosystem services; and (iii) services for farmers to enable changes (FAO, 2013; FAO and CCAFS, 2014).
A CSA practice or technology is site-specific and context-based solution that addresses climate or weather related risks while improving FS in the form of yield, farm income, and return on investment. Although CSA practices aim at achieving synergies among the three CSA pillars, it does not mean that every CSA technology implemented in any location has to generate “triple
wins” (Lipper et al., 2014). Alternatively, a CSA practice could achieve the minimum of two
benefits among productivity, resilience and mitigation, in which productivity is the priority in developing countries because of their dependence on agriculture (Lipper et al., 2014; Rosenstock et al., 2016). CSA practices aim to maximize synergies and minimize trade-offs between FS, CC mitigation and adaptation, however, trade-offs should be taken into account, as they very much depend on local priorities. For example, in developing nations, FS is still prioritized for national agricultural growth, and the poor are the most affected by, but not the main contributor to, CC (Lipper et al., 2014).
2.5. Economics of CSA
2.5.1. Availability of CSA options and strategies
There is an increasing growth in the literature promoting agricultural mitigation options for developing countries. Most refer to sustainable agriculture and SLM practices that capture the
synergies between FS and CC mitigation and in some cases, adaptation (Branca et al., 2013; 2009; 2011; FAO, 2013; IPCC, 2007b; Lal, 2004; Lipper et al., 2011). Such land-based strategies can be categorized as follows: improved cropland management; improved grassland management; restoration of organic soils; restoration of degraded lands and reducing agricultural expansion. Of which, improved cropland management is the most related option to this research, since it potentially builds resilience in crop production systems with improved agronomic practice, integrated nutrient management, water management, tillage management and agroforestry systems (IPCC, 2007b; Zougmoré et al., 2016). In addition, these practices are strongly recommended in South East Asia, one of the most vulnerable regions to CC, because they have particularly high impacts on FS while providing adaptation co-benefits (Lipper et al., 2011).
2.5.2. Productivity and profitability of CSA options and practices
The review of CSA literature shows that productivity is the foremost driver for the maintenance of on-going practices or adoption of a new technology at the farm level. Assessment of CSA practices in terms of financial viability falls into a broad literature of farm management (Malcolm, 1990). This principle has been applied in studying productivity and/or profitability of various CSA technologies in many regions in the developing world, including organic and conventional coffee farms in Costa Rica (Lyngbæk et al., 2001); conventional and agroforestry in Zambia (Ajayi et al., 2009); direct seeding mulch-based cropping systems in Viet Nam (Affholder et al., 2010); extensive shaded cocoa production systems in Ghana (Gockowski et al., 2013) and maize profitability in conservation agriculture (CA) systems in Zimbabwe (Mafongoya et al., 2016), and also CA in India (Pradhan et al., 2017).
Furthermore, some authors have advanced the enterprise10 budgeting technique in constructing whole-farm models and evaluating the net economic effects of switching from conventional practices to prospective CA options under: (i) farm-level resource constraints e.g. labor, capital or integration livestock in farm portfolio (Affholder et al., 2010; Mafongoya et al., 2016); and (ii) risk, time-related conditions and farming system complexities (Pannell et al., 2014). In addition, some economists have considered those economic elements in long-term, holistic comparisons by extending their economic analysis (incremental farm profits, enterprise benefits and costs) into different time horizons and scenario-based simulations.
10 For the purpose of this study, a farm or a household having one or more activities or enterprises. Enterprises are
Net present value (NPV), one of the most important decision rules in project economic analysis (Nas, 1996), is commonly used as a profitability and viability indicator in the above investigations (Bryan et al., 2013; Flugge and Abadi, 2006; Gockowski et al., 2013). Representative farm or farm modeling techniques have been used in conjunction with farm budget in economic analysis of CA in Australia (Pannell et al., 2014) and in Viet Nam (Affholder et al., 2010). Mathematical programming is another technique being deployed moderately in studying costs and benefits of CSA practices, such as agroforestry in Western Australia (Flugge and Abadi, 2006).
This study will advance these management techniques and methods to formulate a farm model analysis in which selected crops and livestock are evaluated for their economic viability, profitability and income contributions at HH level. Costs and benefits of these conventional and CSA practices are estimated to analyze CSA viability in relation to cropland.
2.5.3. Economics of the mitigation component of CSA
Several mitigation options exist in the agriculture sector: reducing emissions (efficient management of carbon and nitrogen flows significant to decrease CO2, N2O and CH4 released by farm practices); enhancing removals (reserving carbon in ecosystems, particularly soil carbon sequestration and vegetative carbon storage) and avoiding or displacing emissions (converting crops and residues into biofuel) (IPCC, 2007b). Carbon removal and sinks have become the central focus of discussion in the literature on agricultural mitigation, because these practices and technologies potentially provide FS co-benefits.
Soil carbon sequestration transfers atmospheric CO2, into long-lived pools and prevents its immediate re-emission (Lal, 2004). At the global scale, about 1,500 Gt of carbon is sequestered in the soil pool, 2 times higher than that of the atmospheric pool and 3 times higher than that of the biotic pool. Carbon is sequestered in planetary soil at an estimated rate, though large variations from 0.4 to 1.2 Gt C yr-1 and SOC potentially enhance FS globally. For example, an increase of 1 ton of soil carbon pool of degraded farmland soil could increase crop yield by 20 to 40 kg ha-1 for wheat, 10 to 20 kg ha-1 for maize, and 0.5 to 1.0 kg ha-1 for cowpea (Lal, 2004). Besides SOC, vegetation or plant biomass is considered a significant pool for carbon storage (IPCC, 2007b). Long rotation agricultural systems such as agroforestry, home-gardens and perennial plantations can sequester substantial amounts of carbon in plant biomass and in long-lasting wood products. Such areas on earth could store 1.1 to 1.2 billion tons of carbon for a