Contents lists available atScienceDirect
Clinica Chimica Acta
journal homepage:www.elsevier.com/locate/cca
Comparative evaluation of two immunoassays for cerebrospinal
fluid
β-Amyloid
1–42
measurement
Chiara Zecca
a,b,⁎, Vincenzo Brescia
b, Marco Piccininni
a,c, Rosa Capozzo
a, Roberta Barone
a,
Maria Rosaria Barulli
a, Giancarlo Logroscino
a,c,⁎aCenter for Neurodegenerative Diseases and the Aging Brain, Department of Clinical Research in Neurology, University of Bari Aldo Moro, Pia Fondazione Cardinale G
Panico, Tricase, Lecce, Italy
bUnit of Laboratory Medicine, Pia Fondazione Cardinale G Panico, Tricase, Lecce, Italy
cDepartment of Basic Medical Sciences, Neuroscience and Sense Organs, University of Bari“Aldo Moro”, Bari, Italy
A R T I C L E I N F O Keywords: Beta-Amyloid1–42 Alzheimer's disease Cerebrospinalfluid Method comparison Immunoassay Correlation A B S T R A C T
Aim of the study: Beta-Amyloid 1–42 peptide (βA42) is a cerebro-spinal fluid (CSF) biomarker, key element of the NIA Alzheimer's disease diagnostic criteria. The enzyme-linked immunosorbent assay (ELISA) has been the mainstay method forβA42 measurement on cerebrospinal fluid (CSF). Recently, a new βA42 measurement method in chemiluminescence enzyme immunoassay (CLEIA) is available on Lumipulse G 600 II automatic platform. The aim of the work was to evaluate the concordance of the ELISA and the new method (CLEIA) in the CSFβA42 levels measurement.
Materials and methods: CSFβA42 levels were assayed in 49 samples using the ELISA method (Innotest β- amyloid 1–42, Fujirebio Europe N.V., Gent, Belgium) and CLEIA method on Lumipulse G600II fully automatic platform (Lumipulse Gβ- amyloid 1–42, Fujirebio Europe N.V., Gent, Belgium). We compared values of the two methods using acceptability interval based on Inherent Combined Imprecision (ICI), the Passing-Bablok regression ana-lysis, the Pearson correlation coefficient (r) and the Bland-Altman plot.
Results: The analysis of the ICI showed that the two methods differ substantially. The regression equation (y =−103.04 + 1.52×) highlighted the presence of proportional systematic difference, without significant deviation from linearity (p = .42). The Pearson correlation coefficient was 0.826. The Bland-Altman plot ana-lysis showed a significant systematic difference in the two methods: ELISA measurements were in average –27.06% (95% CI –31.89 to −22.23%) lower compared to CLEIA ones.
Conclusions: Our study highlighted a difference between the two methods. Therefore, the cut-off for the normal levels ofβA42 should be reviewed in the laboratory report.
1. Introduction
The identification and validation of biomarkers for diagnosing, monitoring progression and predicting onset of Alzheimer's disease (AD) has been a main focus of AD research. Cerebrospinalfluid (CSF) biomarkers (Beta-Amyloid 1–42, Tau, phospho-Tau) are now proposed to be part of the diagnostic procedure [1]. However, AD biomarkers measurement is subject to variability due to the presence of various assay methods and the absence of a gold standard for CSF biomarker measurements. With variability in assay composition, analytical
sensitivity, capture-detection antibodies and calibrator preparations, the results reported by clinical laboratories are variable causing dis-cordance in biomarkers concentration measurements. To overcome these problems, several standardization initiatives have been under-taken with the aim of minimizing this type of variability [2].
Beta-Amyloid 1–42 (βA42) is a marker of amyloid pathology in the brain. Patients with AD showed a significantly decreased level of βA42 [3,4]. This protein represents, with Tau and phospho-Tau, the core of CSF test for AD diagnosis and recently it was also explored as potential blood-based biomarker for this disease [5,6].
https://doi.org/10.1016/j.cca.2019.02.033
Received 15 November 2018; Received in revised form 3 February 2019; Accepted 28 February 2019
Abbreviations: AD, Alzheimer’s Disease; CSF, Cerebrospinal fluid; βA42, Beta-Amyloid 1-42; ELISA, Enzyme-Linked Immunosorbent Assay; CLEIA, Chemiluminescence Enzyme Immunoassay; LoD, Limit of Detection; LoQ, Limit of Quantification; CI, Confidence Interval; SD, Standard Deviation; CV, Coefficient of Variation; ICI, Inherent Combined Imprecision
⁎Corresponding authors at: Center for Neurodegenerative Diseases and the Aging Brain, Department of Clinical Research in Neurology, University of Bari Aldo
Moro, Pia Fondazione Cardinale G Panico, Tricase, Lecce, Italy.
E-mail addresses:[email protected](C. Zecca),[email protected](G. Logroscino).
Available online 04 March 2019
0009-8981/ © 2019 Elsevier B.V. All rights reserved.
The enzyme-linked immunosorbent assay (ELISA) has been the mainstay method forβA42 measurement on CSF. Recently, a new βA42 measurement method in chemiluminescence enzyme immunoassay (CLEIA) is now available on Lumipulse G 600 II (Fujrebio Europe N.V., Gent, Belgium) automatic platform. The new method has several po-tential advantages: cost reduction, improvement in efficiency, easier procedures and maintenance. It is important to investigate the differ-ences between the CLEIA and ELISA methods to determine the com-parability of the results obtained by the two assays.
Therefore, we evaluated the concordance of the currently used method (ELISA) and the new method (CLEIA) in CSF βA42 measure-ment. Our study integrates other studies [7,8] on repeatability and intermediate precision of different CSF βA42 measurements assays.
2. Materials and methods 2.1. Samples
Forty-nine CSF samples were selected from patients attending at the Center for Neurodegenerative diseases and the Aging Brain of University of Bari at Pia Fondazione“Card. G. Panico” (Tricase, Lecce, Italy) for βA1–42 assay. Samples were chosen in order to cover the entire measuring range and to have enough measurements close to the decisional threshold.
At the time of lumbar puncture, the CSF samples were collected in a polypropylene tube and they were centrifuged at 2000 rpm for 10 min. The supernatant was pipetted off, gently mixed to avoid potential gradient effects, and it was aliquoted in 0.5 mL portions in poly-propylene tubes that were stored at−80 °C pending biochemical ana-lyses, without being thawed and re-frozen.
The CSFβA42 levels were measured by two methods: the currently used method, a sandwich ELISA (Innotest β- amyloid1–42, Fujirebio Europe N.V., Gent, Belgium), and the new method, a chemiluminescent immunoassay CLEIA (Lumipulse G ß- amyloid 1–42, Fujirebio Europe N.V., Gent, Belgium) on fully automatic platform (Lumipulse G600II, Fujirebio Europe N.V., Gent, Belgium). The study was approved by the ASL Lecce Ethics Committee and all participants signed a written in-formed consent.
2.2. Analytical methodology
Innotest β-Amyloid 1–42 Fujirebio test is a solid-phase enzyme immunoassay, in which afirst monoclonal antibody and a second bio-tinylated detector antibody are used. The detection system of the βA-antibody complex provides the addition of a peroxidase-labelled streptavidin. Analyte concentration is proportional to optical density at 450 nm. The test includes six calibration points with a range between 62.5 and 4000 pg/mL and two Run Validation Controls (high and low concentration levels) for assay run validation. The Limit of Detection (LoD) is 65 pg/mL, the lowest and upper limit of quantification (LoQ) are 225 and 1452 pg/mL respectively. Samples, calibrators and controls were measured in duplicate for each test run.
The Lumipulse G β- amyloid 1–42 Fujirebio test uses a CLEIA method, conducted on LUMIPULSE G 600 analyzer. All necessary components are enclosed in a single, ready-to-use, cartridges. For the calibration, a three-point master curve is used with a range between 0 and 3409 pg/mL. Three different internal controls (high, medium and low concentration levels) are processed for testing the correct analyzer functionality. The LoD is 7.17 pg/mL, the LoQ is 14.02 pg/mL and linearity is between 131 and 2069 pg/mL.
The two methods use the same capture antibody, 21F12 (IgG2a), and the same detection antibody, 3D6 (IgG2b). The assays were per-formed according to manufacturer's protocols.
2.3. Statistical analyses
βA42 levels were expressed as mean (95% confidence interval, 95% CI), standard deviation (SD), median (95% CI), lowest and higher va-lues. D'Agostino Pearson test was used to assess normality.
For the imprecision study, we assessed if the two assays were identical within the inherent imprecision. We defined acceptance limits based on Inherent Combined Imprecision (ICI) [9], that combines the coefficient of variation (CV) of the two methods. We used CVs com-puted based on mean values near the decisional threshold (562 pg/mL for ELISA and 683 pg/mL for CLEIA). Lumipulse G600II provides au-tomatically the CV for the CLEIA method, while ELISA's total impreci-sion was computed using a control sample assayed in duplicate for 5 runs over different days [10].
The two methods are expected to measure identically if 95% of the differences between the βA42 levels obtained by the two methods fall within the interval: [0 ± 1.96 × (ICI) × mean] [9].
For the methods comparison study, Passing-Bablok regression and Bland-Altman analysis were carried out. Passing Bablok regression was used to calculate a regression equation (y = a + bx) and 95% CI of the coefficient estimates, in order to assess the absence of constant (a = 0) and proportional systematic difference (b = 1). Cumsum test was used to assess linearity assumption. The magnitude of linear association between two variables was assessed using the Pearson's Correlation Coefficient (r). Residual Plot was performed to evaluate the goodness of fit. Bland-Altman plot was used to plot the differences in βA42 levels measured by the two methods against the average of the two mea-surements. A Mountain Plot was computed to provide information about the cumulative distribution of the differences. A p-value lower than 0.05 was considered as statistically significant. Analyses were performed using MedCalc Statistical Software version 14.8.1. 3. Results
CSF samples of forty-nine patients were selected [mean age: 65.26 years; range age: 35–80 years; female %: 51.02; mean education: 9.37 years; diagnosis n (%): Alzheimer's Dementia 16 (32.7), Mild Cognitive Impairment 12 (24.5), Frontotemporal Dementia 7 (14.3), Subjective Memory Complaints 5 (10.2), Parkinson's Disease 4 (8.2), Amyotrophic Lateral Sclerosis 3 (6.1), Lewy Body Dementia 1 (2.0), Chronic inflammatory demyelinating polyneuropathy 1 (2.0)].
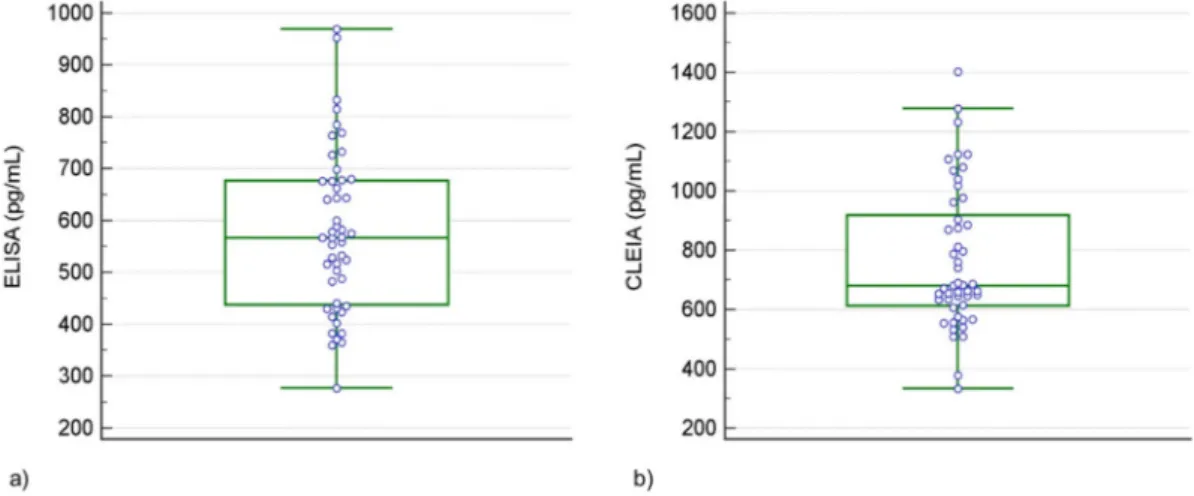
The average levels ( ± SD) of the protein were 577 ± 155 pg/mL (95% CI 533 to 622 pg/mL) as measured by ELISA and 767 ± 238 pg/ mL (95% CI 699 to 836 pg/mL) as measured by CLEIA. The medians were 567 pg/mL (95% CI 518 to 633 pg/mL) and 681 pg/mL (95% CI 651 to 795 pg/mL) for ELISA and CLEIA respectively. The range of values were 277–969 pg/mL for ELISA and 332–1403 pg/mL for CLEIA (Table 1). The distribution ofβA42 levels obtained by the two methods is shown inFig. 1a and b.
The CVs of ELISA and CLEIA assays were 6.2% and 3.0% respec-tively. Therefore, the ICI was 6.9% and the acceptance limits resulted to be ± 13.5%. Only 16.32% of differences in βA42 levels measured by the two methods fell within the acceptance interval.
The regression equation estimated using the Passing-Bablok model was y =−103.04 + 1.52×, where y and x were CLEIA and ELISA measurements respectively. The estimated intercept was −103.04 (95% CI–286.50 to 40.01) and the estimated slope was 1.52 (95% CI 1.24 to 1.87). In the observed range of ELISA concentrations (277–969 pg/mL), CLEIA values were in average higher compared to the current method ones (Fig. 2). No significant deviation from linearity was found (p = .42).
The Correlation Coefficient was r = 0.826 (P < .0001). The hor-izontal-band pattern obtained in the Residual Plot suggested that the variance of the residuals was constant and that the regression model used was appropriate (Fig. 3).
be considered normal (p = .281). The Bland-Altman analysis, con-sidering ELISA vs CLEIA differences (expressed as percentages), showed: Systematic difference – 27.06% (95% CI –31.89 to −22.23); SD 16.82%; lower limit−60.03 pg/mL (95% CI –68.34 to −51.71 pg/ mL); upper limit−5.91 pg/mL (95% CI –2.40 to 14.22 pg/mL). The 95% CI of the mean of the differences did not include the line of equality (zero) (Fig. 4). In the Mountain Plot, the mountain is not centered over zero, therefore the presence of a systematic difference was confirmed (Fig. 5).
4. Discussion
βA42 peptide is a well-recognized biomarker supporting Alzheimer's disease diagnosis. Its predictive accuracy increases when used in combination with total-Tau and phosphorylated-Tau (pTau181) [1,11]. However, the lack of standardized laboratory technique and the variability in the assay kit performance may be responsible for a var-iation of the absolute values of these analytes in the CSF and contribute to analytical comparability issues. Therefore, the comparison between analytical methods is an integral and essential part of the medical la-boratory procedures for proper data interpretation [12–15].
In our study, only 16% of differences between CLEIA and ELISA measurements fell within the acceptance interval based on Inherent Combined Imprecision, therefore the two methods could not be con-sidered identical.
The Bland-Altman plot confirmed the presence of a significant sys-tematic difference between the two methods of 27% in average. The CLEIA measurements were systematically higher compared to ELISA ones in this observed range of concentrations.
A model-based approach was then used to further investigate the characteristics of the systematic difference. The estimated regression equation highlighted the presence of a proportional systematic differ-ence. Specifically, within the investigated concentration range, the difference between the two methods increases when the ELISA con-centration increases. The interpretation regarding interchangeability of assays on basis of significant Pearson's coefficient (r = 0.826) would have been misleading.
The evidence of these differences cannot be explained by a differ-ence in antibody specificity because the same antibodies, made by the same manufacturer, have been used in the two methods. A different analytical standardization of measurements, different analytical and functional sensitivity (LoD and LoQ) and different type of calibrators, must therefore be considered as possible explanations. Calibrators are traceable to in-house reference and they are without CSF-like matrix in both methods, but different analytical ranges are provided.
Moreover, it should be noticed that the samples selection followed appropriate procedures according to the guidelines of the Clinical and Laboratory Standards Institute (CLSI) [15]. The distribution of con-centrations estimated from samples selected by this procedure does not necessarily match the representative distribution obtained from the target population in epidemiological and clinical studies.
Based on the statistically significant differences found between the assays, the cut-off should be reviewed. It is important that the clinician is aware of the difference when evaluating comparisons of the CSF re-sults obtained by different methods.
Funding sources
The research projects of the Center of Neurodegenerative Diseases and the Aging Brain are supported by special grants of Regione Puglia, Italy (DGR n.867 of 29 Apr 2015; DGR n.1159 of 28 Jun 2018). Declarations of interest None. Table 1 Descriptive statistics of CSF β -amyloid (β A42) concentrations obtained by ELISA and CLEIA methods. Sample size (n) Lowest value (pg/mL) Highest value (pg/mL) Mean (pg/mL) 95% CI for the mean (pg/mL) Median (pg/mL) 95% CI for the median (pg/mL) Standar d Deviation (pg/mL) D'Agostino-Pearson test ELISA 49 277 969 577 533 to 622 567 518 to 633 155 Accept Normality (P = .361) CLEIA 49 332 1403 767 699 to 836 681 651 to 795 238 Accept Normality (P = .097)
Fig. 1. Boxplots of distributions of CSFβA42 concentrations obtained by ELISA method (a) and CLEIA method (b).
Fig. 2. The scatter plot of measurements obtained by CLEIA and ELISA methods along with Passing-Bablok regression equation are shown. Each point is defined as CLEIA and ELISA measurements on the same biological sample. This graph shows the estimated regression equation (thick solid line), the 95% confidence interval upper and lower limits (dashed lines) and the identity line (x = y, dotted line). Correlation coefficient (r) was also reported.
Fig. 3. The residual plot. The plot highlights no problem in the regression model (horizontal-band pattern) and the absence of possible outliers.
Fig. 4. The Bland-Altman plot. The graph displays a scatter plot of the differ-ences in protein concentration obtained by ELISA and CLEIA methods (as percentages) plotted against the averages of the two measurements. The solid line shows the mean difference, while the dotted lines show the mean differ-ence ± 1.96 standard deviation (SD). The vertical bars indicate the confidence intervals for the upper and lower limits and for the mean. The dotted line (at zero level) represents the line of equality. While the diagonal dotted line, re-ported with 95% confidence interval limits, shows the linear relationship be-tween the differences and the means of concentrations.
Fig. 5. The Mountain plot. The graph shows the cumulative distribution of the differences in terms of concentration (pg/mL) between the ELISA and the CLEIA methods.
Acknowledgements No Acknowledgements. References
[1] C.R. Jack Jr., D.A. Bennett, K. Blennow, M.C. Carrillo, B. Dunn, S.B. Haeberlein, et al., NIA-AA research framework: toward a biological definition of Alzheimer's disease, Alzheimers Dement. 14 (4) (2018) 535–562.
[2] M.C. Carrillo, K. Blennow, H. Soares, P. Lewczuk, N. Mattsson, P. Oberoi, et al., Global standardization measurement of cerebral spinalfluid for Alzheimer's disease: an update from the Alzheimer's Association global biomarkers consortium, Alzheimer's Demen. 9 (2013) 137–140.
[3] C.R. Jack Jr., D.S. Knopman, W.J. Jagust, L.M. Shaw, P.S. Aisen, M.W. Weiner, et al., Hypothetical model of dynamic biomarkers of the Alzheimer's pathological cascade, Lancet Neurol. 9 (2010) 119–128.
[4] S. Palmqvist, H. Zetterberg, K. Blennow, S. Vestberg, U. Andreasson, D.J. Brooks, et al., Accuracy of brain amyloid detection in clinical practice using cerebrospinal fluid β-amyloid 42: a cross validation study against amyloid positron emission to-mography, JAMA Neurol. 10 (2014) 1282–1289.
[5] H. Zetterberg, K. Blennow, From cerebrospinalfluid to blood: the third wave of fluid biomarkers for Alzheimer's disease, J. Alzheimers Dis. 64 (s1) (2018) S271–S279.
[6] C. Zecca, R. Tortelli, F. Panza, S. Arcuti, M. Piccininni, R. Capozzo, et al., Plasma
β-amyloid1-42 reference values in cognitively normal subjects, J. Neurol. Sci 391 (2018) 120–126 15.
[7] M. Faull, S.Y.L. Ching, A.I. Jarmolowicz, J. Beilby, P.K. Panegyres, Comparison of two methods for the analysis of CSF Aβ and tau in the diagnosis of Alzheimer's disease, Am. J. Neurodegener. Dis 3 (3) (2014) 143–151.
[8] A.L. Kollhoff, J.C. Howell, W.T. Hu, Automation vs. experience: measuring Alzheimer's Beta-amyloid 1–42 peptide in the CSF, Front. Aging Neurosci. 10 (2018) 253.
[9] A.L. Jensen, M. Kjelgaard-Hansen, Method comparison in the clinical laboratory, Vet. Clin. Pathol. 35 (2006) 276–286.
[10] D. Chesher, Evaluating assay precision, Clin. Biochem. Rev. 29 (Suppl. 1) (2008) 523–526.
[11] J.H. Kang, H. Vanderstichele, J.Q. Trojanowski, L.M. Shaw, Simultaneous analysis of cerebrospinalfluid biomarkers using microsphere-based xMAP multiplex tech-nology for early detection of Alzheimer's disease, Methods 56 (2012) 484–493. [12] D.G. Altman, J.M. Bland, Measurement in medicine: the analysis of method
com-parison studies, Statistician 32 (1983) 307–317.
[13] S. Mantha, M.F. Roizen, L.A. Fleisher, Comparing methods of clinical measurement: reporting standards for Bland and Altman analysis, Anesth. Analg. 90 (2000) 593–602.
[14] J.O. Westgard, M.R. Hunt, Use and interpretation of common statistical tests in method comparison studies, Clin. Chem. 19 (1973) 49–57.
[15] Measurement procedure comparison and bias estimation using patient samples; Approved guideline, 3, in: CLSI (Ed.), CLSI Document EP09-A3, Clinical and Laboratory Standards Insitute, Wayne, PA, 2013.