SHORT
COMMUNICATION
Inelastic displacement ratio of near-source pulse-like ground motions
Iunio Iervolino,* Eugenio Chioccarelli, and Georgios Baltzopoulos.Dipartimento di Ingegneria Strutturale, Università degli Studi di Napoli Federico II, Naples, Italy. SUMMARY
Near-Source pulse-like records resulting from rupture’s directivity have been found to depart from so-called ordinary ground motions in terms of both elastic and inelastic structural seismic demands. In fact, response spectra may be strong if compared to what expected from common ground motion prediction equations. Moreover, because not all spectral ordinates are affected uniformly, a peculiar spectral shape, with an especially amplified region depending on the pulse period, may follow. Consequently, inelastic seismic demand may show trends different to records not identified as pulse-like (i.e., ordinary). This latter aspect is addressed in the study reported in the short communication, where a relatively large dataset of identified impulsive near-source records is used to derive an analytical-form relationship for the inelastic displacement ratio. It is found that, similar to what proposed in literature for soft soil sites, a double-opposite-bumps form is required to match the empirical data as function of the structural period over the pulse period ratio. The relationship builds consistent on previous studies on the topic, yet displays different shape with respect to the most common equations for static structural assessment procedures.
KEY WORDS: Forward directivity, near-fault, coefficient method.
1. INTRODUCTION
In near-source (NS) conditions, ground motions may show special characteristics, which systematically affect seismic structural demand. This is believed to be due to rupture’s forward directivity, which may show up at sites in particular geometrical configurations with respect to the rupture, and results in velocity fault-normal signals characterized by a large full-cycle pulse at the beginning of the record and containing most of its energy [1]. Previous studies (e.g., [2]), found effects on both elastic and inelastic seismic demand characterizing pulse-like records, if compared to those non pulse-like (hereafter ordinary).
The features of NS pulse-like records which may be of structural interest are: (1) ground motion is characterized by fault normal (FN) rotated record of generally larger amplitude than the fault parallel (FP), while non-pulse-like ground motions have equivalent FN and FP components; (2) FN pulse-like signals are characterized by a non-standard pseudo-acceleration spectral shape with an increment of spectral ordinates in a range around the pulse period (Tp), that is, a bump shape; (3) inelastic to elastic seismic spectral displacement ratio for FN pulse-like records may virtually depart from the equal displacement rule, and can be higher than that of ordinary motions. Increments are displayed in a range of period between about 30% and 50% of pulse period.
Issues (1) and (2) refer to elastic seismic demand, and call for investigations about the need and feasibility to account for them in probabilistic seismic hazard analysis. Such studies are currently in progress; e.g., [3,4,5]. Issue (3) refers to inelastic demand, and is the subject of this communication, in which the inelastic to elastic displacement ratio, or CR, is studied by means of semi-empirical relationships (e.g., [6]). In Equation (1), Sd,e(T) is the elastic spectral displacement at period T and Sd,i(T) is its inelastic counterpart for a given strength reduction factor (usually indicated as R or Rs).
( )
( )
, , R d i d e C =S T S T (1)* Corresponding author: Iunio Iervolino, Dipartimento di Ingegneria Strutturale, Università degli Studi di Napoli Federico II, via
Current static structural assessment procedures (e.g., [7]) rely on prediction equations for this kind of parameters to estimate inelastic seismic demand given the (elastic) seismic hazard. Because such relationships have to be estimated semi-empirically, in those cases where peculiar features in ground motions are expected, it is necessary to investigate whether they may show special trends (e.g., [8]). In fact, inelastic displacement for near-source conditions was studied already by a number of researchers (e.g., [9,10]). The most up to date study with respect to this issue and dealing with pulse-like records is that in [11], which also motivates this study pointing out the need for further investigation on the CR functional form. This is the scope of the study herein presented, where a series of bilinear (with 3% post-elastic stiffness) single-degree-of-freedom (SDoF) systems were analyzed when subjected to: (i) sets of FN impulsive records; (ii) the corresponding FP components; and (iii) a set of ordinary ground motions. The SDoF systems where designed to cover different nonlinearity levels, measured by means of R. The latter is given in Equation (2), where: Sa,e(T) is the elastic spectral acceleration, m is the mass of the SDoF system, and Fy is the yielding strength in the case of bilinear hysteresis’ backbone (yielding strength was changed record by record to have uniform strength reduction factor, that is, a constant R approach). Results were employed to fit the observed trends, which were found to be different if compared to those of ordinary and FP records (at least in terms of amplitude in this latter case), as a function of the T over Tp ratio.
( )
, 2, 3,...,8
a e y
R=S T m F R= (2)
In the following, dataset and empirical trends are briefly described first, then the discussion of chosen functional form is given, along with a description of the regression strategy. Finally, results are presented and discussed with respect to background research.
2. DATASET AND EMPIRICAL EVIDENCES
Pulse-like records considered are a set, from [2], identified with the algorithm in [12], which is extremely useful as it allows to remove most of the subjectivity in the analysis of directivity in ground motion (which comes in the usual approach of visual inspection of waveforms) and to search large datasets, enabling comparisons with the ordinary case.
The procedure of [12] is based on wavelets to extract the pulse at the beginning of a record and to determine its Tp. It also provides a score, a real number between 0 and 1, which is function of the energy and amplitude of the pulse with respect to the recorded ground motion. In fact, the dataset considered herein is comprised of impulsive FN components from the NGA database (http://peer.berkeley.edu/nga/) within 30 km from the source and with pulse score equal or larger than 0.85. This is the dataset also employed in [13], to which L’Aquila records analyzed in [2] plus the recording of the same event by AQU station of the Mediterranean Network (MedNet,
http://mednet.rm.ingv.it/) not yet available at the time of [2], were added.
For comparison, also records identified as non-pulse-like (i.e., ordinary) according to the discussed procedure, yet within 30 km from the source, were considered. In Table 1 datasets, in terms of number of earthquake events and records, are summarized. Table 2 reports about distribution of pulse-like records in Tp bins. Moment magnitude ranges from 5.2 to 7.9 and the vast majority of records was from C and D NEHRP site classification.
Table 1. Pulse-like and ordinary datasets.
Mechanism Earthquakes Records Earthquakes with Pulse-Like Records Pulse-Like Records
Strike-Slip 22 133 12 34
Non-Strike-Slip 23 242 12 47
Table 2. Distribution of pulse-like records in Tp bins.
Tp [0s, 1s[ [1s, 2s[ [2s, 3s[ [3s, 4s[ [4s, 5s[ [5s, 6s[ [6s,12s[
Number of records 22 20 8 11 10 5 5
The number of records from strike-slip events is 133, the records identified as pulses in the given dataset are 34. Records from other faulting mechanisms are in a unique category due to their relative paucity summing up to 375, 81 of which are identified as containing pulses. Note that in the following no distinction of ground motion with different source parameters is considered, as results in [2] do not support it. This is also because, consistent with existing literature on the topic (e.g., [11]), the period1 (i.e., Tp) is expected to be the most important characteristic of this kind of ground motions.
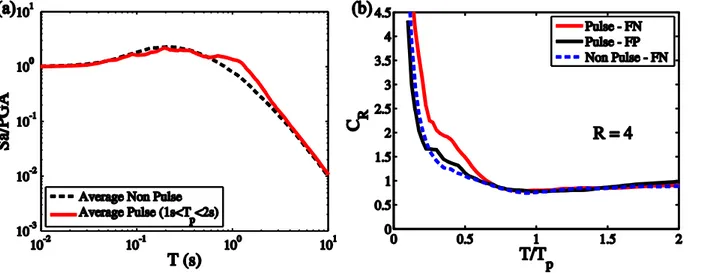
In Figure 1a FN elastic spectra, normalized to peak ground acceleration (PGA), are given for pulse-like records considered herein with TP between 1s and 2s (Average Pulse) and for ordinary ground motions (Average Non Pulse). In Figure 1b, CR for R equal to 4 is also given for pulse-like and non-pulse-like records (Pulse - FN and Non Pulse – FN, respectively). For comparison, also CR for the FP components of the pulse-like FN records (which not necessarily are pulse-like, even if indicated as Pulse - FP), are shown. The figures allow to appreciate systematic differences summarized in the introductory section, especially points (2) and (3), among the considered classes2. Moreover it appears that FP records have a shape similar to FN in the low T/Tp range, yet with lower amplitudes. Same results hold for other R-values not shown.
Figure 1. (a) Elastic 5% damped spectra for FN pulse-like with 1s<TP<2s and ordinary records; (b) empirical CR for FN pulse-like records, for their FP components, and for ordinary records, at R = 4.
3. FUNCTIONAL FORM AND REGRESSION STRATEGY
In FEMA 440 [14], the inelastic to elastic spectral response displacement coefficient, C1 (referred to therein as the maximum displacement ratio), is given by the relationship in Equation (3), where α accounts for site subsoil conditions.
(
)
(
2)
1 1 1
C = + R− T
(3) As mentioned, among other researches who have looked to near-source spectral amplification, the attention is focused herein on the work of Ruiz-Garcia [11], who, based on empirical evidence,
1 In [11] this is concluded based on the predominant period of ground motion; it holds valid for T
p (to follow). 2 The algorithm in [12] assigns a T
proposed a functional form of CR of the type in Equation (4) to account for a dominant frequency in ground motion.
(
)
2(
)
(
)
(
)
2
1 2 3 1 1 exp ln 0.08 R g g g C = + T T R− + T T T T − (4) In this equation the first two terms are (intentionally) similar to Equation (3) and the third term is a function akin to a upside-down asymmetric bell (similar to a lognormal probability density function) centered at T/Tg ≈ 1.0, where Tg is the predominant period of ground motion, that is, the one corresponding to the peak of the 5% damped velocity spectrum. Although coefficient θ1 appears in the same position as the α of Equation (3), it is not calibrated for local soil conditions. Because of the strong correlation exists between the two period measures, Tp and Tg (e.g., [11]), in the following T/Tp will be used in place of T/Tg.It was noted in [11], and confirmed in the following, that Equation (4) is able to capture the shape of inelastic to elastic displacement ratio at T/Tp ≈ 1, while it is not able to capture the bump in the low T/Tp range. This calls for a modification of the prediction equation for CR, which is investigated herein. Equation (5) consists of adding another term, like the last one in Equation (4), to reflect the CR trend in the low T/Tp range (R dependency in the argument of last term is explained in the following section). The resulting relationship has another bump (shifted and representing a peak rather than a valley). This equation has the same analytical form of that proposed by [8] for CR in the case of soft soil sites. In fact, in that case, the SDoF response also is dominated by specific frequencies of ground motion, yet of different nature.
(
)
(
)
(
)
(
)
(
)
(
)
2 2 1 2 3 2 4 5 1 1 exp ln 0.08 exp ln 0.5 0.02 R p p p p p C T T R T T T T T T T T R = + − + − + + + + (5)To determine the coefficients of Equation (5) for each of the R-values considered, nonlinear-segmented regressions were applied for 0.1T Tp2. The Levenberg–Marquardt algorithm [15], as implemented in MATLAB® software, was employed. Moreover, the fitting was performed in two steps, such that the first three terms of Equation (5) were determined in the initial phase, then the residuals were computed and fitted via the fourth term; this was also to compare with Equation (4), and to determine efficiency of the considered functional form.
4. RESULTS AND DISCUSSION
This initial phase of the two-step procedure was to get coefficients for Equation (4), that is, first three terms of Equation (5), Table 3, for the bilinear SDoF systems herein investigated. This was carried out not considering data within the ]0.35,0.775[ T/Tp range. In fact, it fitted those segments of the forward-directivity data that seem to be captured by a relationship of the type in Equation (4); Figure 2a.
Table 3. Coefficient estimates for Equation (4).
R = 2 R = 3 R = 4 R = 5 R = 6 R = 7 R = 8
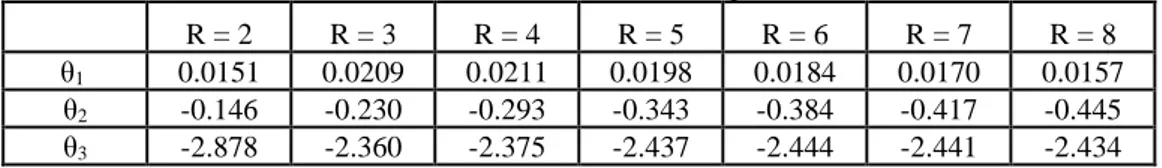
θ1 0.0151 0.0209 0.0211 0.0198 0.0184 0.0170 0.0157 θ2 -0.146 -0.230 -0.293 -0.343 -0.384 -0.417 -0.445 θ3 -2.878 -2.360 -2.375 -2.437 -2.444 -2.441 -2.434
The second step was to derive the residuals
( )
R
C
of actual data with respect to Equation (4) and to fit them by the term in Equation (6), in which CR is the data average, and ˆC is the estimate from R the model. This is similar to what done in [16] to fit pulse-like ground motion elastic residuals to modify ordinary ground motion prediction equations. Table 4 reports resulting coefficients.
(
)
(
)
2
4 5 ˆ exp ln +0.50+0.02 R R C CR CR T Tp T Tp = − (6)Table 4. Coefficient estimates for Equation (6).
R = 2 R = 3 R = 4 R = 5 R = 6 R = 7 R = 8
θ4 0.066 0.146 0.193 0.217 0.224 0.232 0.242
θ5 -47.931 -40.966 -32.697 -27.173 -20.973 -17.211 -15.177
Based on Figure 2b, it should be noted that the amplification observed in pulse-like records when compared to ordinary ground motions, is around a T/Tp value whose location3 is a function of R. To capture this effect the linear term
(
0.50+0.02 R)
appears in Equation (5) and Equation (6).Figure 2. (a) Fitting of Equation (4) for pulse-like FN data (R = 4) outside the ]0.35,0.775[ T/Tp range, and (b) fitting of Equation (6) for selected R-values.
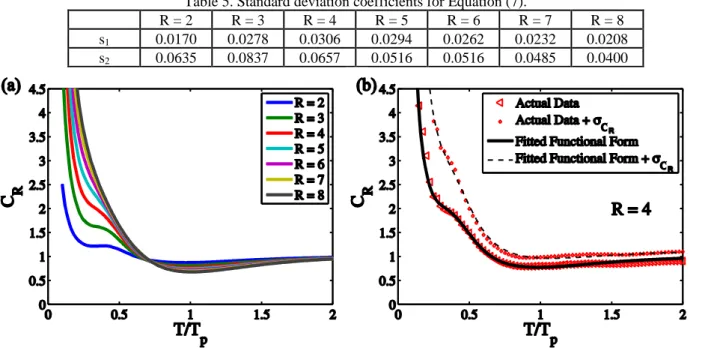
Standard deviation sC
R
( )
was also fitted as a function of T/Tp and R. In fact, functional form of the same type of Equation (5) was fitted on CR plus one standard deviation data. Then, the relationship forR
C
the standard deviation was derived, Equation (7), whose coefficients are given in Table 5. This may be considered the statistic of a lognormal random variable as it was found a more appropriate probability density function, rather than Gaussian, for the observed data [17].
(
)
2(
)
(
)
(
)
2
1 2 5 0.1 1 exp ln 0.50 0.02 R C s T Tp R s T Tp T Tp R = + − + + + (7)In Figure 3a the composition of fitted coefficients of Table 3 and Table 4 to obtain the prediction relationship of the type in Equation (5), is given for all R-values investigated. As an example, actual data and fitted model are compared for R equal to 4 in Figure 3b, in terms of average CR and CR plus one standard deviation. Goodness of fit holds for other R-values not shown.
3 For the sake of completeness it is to report that data, in the T/Tp range below 0.2, show another source of residual, for which
Equation (5) does not attempt to account (in fact, it is not shown in Figure 2b which is plotted for larger T/TP values). This
Table 5. Standard deviation coefficients for Equation (7).
R = 2 R = 3 R = 4 R = 5 R = 6 R = 7 R = 8
s1 0.0170 0.0278 0.0306 0.0294 0.0262 0.0232 0.0208 s2 0.0635 0.0837 0.0657 0.0516 0.0516 0.0485 0.0400
Figure 3. (a) Double-bump fitted CR trends; (b) comparison with empirical data for R = 4.
5. CONCLUSIONS
In the presented study the functional form for prediction of near-source pulse-like inelastic displacement ratio, was investigated. This is required for structural assessment procedures in near-source conditions, and complements current efforts to model effects of forward directivity on elastic seismic structural demand, that is, seismic hazard.
It was found that an additional term is necessary with respect to those used to fit trends from ordinary ground motion as a function of T/Tp. An asymmetric-bell term, centered at different points depending on R, was suitable to fit CR in the low T/Tp range. This resulted in two opposite bumps in two different spectral regions, and builds up consistent with recent literature on the same topic and on what observed for soft soil site records, which are also characterized by a predominant period.
Coefficients for this relationship were determined in a two-step nonlinear regression, for a range of strength reduction factors, of a relatively large set of fault normal pulse-like records. Finally, standard deviation of residual data was also fitted by an analytical equation as a function of the T/Tp ratio. These results may be of some help in investigations concerning design procedures specific for near-source conditions, given that the pulse period is available from design scenarios based on near-source probabilistic seismic hazard analysis.
ACKNOWLEDGEMENTS
The study presented in this paper was developed within the activities of Rete dei Laboratori Universitari di Ingegneria Sismica (ReLUIS) for the research program funded by the Dipartimento della Protezione Civile (2010–2013).
REFERENCES
1. Somerville PG, Smith NF, Graves RW, Abrahamson NA. Modification of empirical strong motion attenuation relations to include the amplitude and duration effect of rupture directivity. Seism. Res. Lett. 1997; 68(1):199–222. 2. Chioccarelli E, Iervolino I. Near-source seismic demand and pulse-like records: a discussion for L'Aquila
earthquake. Earthq. Engn. Struct. Dyn. 2010; 39(9):1039–1062.
3. Tothong P, Cornell CA, Baker JW. Explicit directivity-pulse inclusion in probabilistic seismic hazard analysis.
Earthquake Spectra 2007; 23(4):867–891.
4. Shahi S., Baker JW. An empirically calibrated framework for including the effects of near-fault directivity in probabilistic seismic hazard analysis. Bull. Seism. Soc. Am. 2011; 101(2):742-755.
6. Ruiz-Garcìa J, Miranda E. Inelastic displacement ratios for evaluation of existing structures. Earthq. Engn. Struct.
Dyn. 2003; 32(8):1237-125.
7. Fajfar P. Capacity spectrum method based on inelastic demand spectra. Earthq. Engn. Struct. Dyn.1999; 28(9):979-993.
8. Ruiz-Garcìa J, Miranda E. Inelastic displacement ratios for evaluation of structures built on soft soil sites. Earthq.
Engn. Struct. Dyn. 2006; 35(6):679-694.
9. Baez JI, Miranda E. Amplification factors to estimate inelastic displacement demands for the design of structures in the near field. Proc. of the Twelfth World Conference on Earthquake Engineering, Auckland, NZ, 2000; paper no. 1561.
10. Akkar SD, Yazgan U, Gulkan P. Deformation limits for simple non-degrading systems subjected to near-fault ground motions. Proc. of the Thirteen World Conference on Earthquake Engineering, Vancouver, CAN, 2004; paper no. 2276.
11. Ruiz-Garcìa J. Inelastic displacement ratios for seismic assessment of structures subjected to forward-directivity near-fault ground motions. Journal of Earthquake Engineering 2011; 15(3):449–468.
12. Baker JW. Quantitative classification of near-fault ground motions using wavelet analysis. Bull. Seism. Soc. Am. 2007; 97(5):1486-1501.
13. Iervolino I, Cornell CA. Probability of occurrence of velocity pulses in near-source ground motions. Bull. Seism.
Soc. Am. 2008; 98(5):2262–2277.
14. Federal Emergency Management Agency. Improvement of nonlinear static seismic analysis procedures. Report FEMA 440. Washington DC, US, 2005.
15. Bates DM, Watts DG. Nonlinear regression analysis and its applications. Wiley: New York, 1988.
16. Baker, JW. Identification of near-fault velocity and prediction of resulting response spectra. Proceeding of
Geotechnical Earthquake Engn. Struct. Dyn. IV 2008; Sacramento, CA.
17. Baltzopoulos G. Effect of near-source directivity on inelastic spectral amplification, Earthquake Resistant Structural Design M.Sc. Thesis, Aristotle University of Thessaloniki, Greece, 2011. Advisor: I. Iervolino.