Analysis
of
magnetic
anisotropy
and
the
role
of
intermolecular interactions in switching SMM behaviour in a
family of Co(II)-Y(III) dinuclear complexes with easy-plane
anisotropy: A magneto-structural and theoretical study
María A. Palacios,⊥ Joscha Nehrkorn,†,§ Elizaveta A. Suturina‡, Eliseo Ruiz#,*, Silvia Gómez-Coca,# Karsten Holldack,§ Alexander Schnegg§, J. Krzystek,¶ José. M. Moreno,⊥ Enrique Colacio⊥,*
⊥Departamento de Quımica Inorganica, Facultad de Ciencias, Universidad de Granada, 18071 Granada, Spain
†Department of Chemistry, Box 351700, University of Washington, Seattle, Washington 98195, USA
§ Berlin Joint EPR Lab, Institute forNanospectroscopy, Helmholtz-Zentrum Berlin für Materialien und Energie, Kekuléstraße 5,12489 Berlin, Germany
‡ Novosibirsk State University, Pirogova str.2, 630090, Novosibirsk, Russia
#Departament de Química Inorgànica and Institut de Recerca de Química Teòrica i Computacional, Universitat de Barcelona, Diagonal 645, Barcelona E-08028, Spain
¶ National High Magnetic Field Laboratory, Florida State University, Tallahassee, Florida 32310, USA
Abstract
Three new closely related CoIIYIII complexes of general formula [Co(-L)(-X)Y(NO3)2] (X- = NO3- 1, benzoate, 2 and 9-anthracenecarboxylato, 3) have been prepared with the compartmental ligand N,N’,N”-trimethyl-N,N”-bis(2-hydroxy-3-methoxy-5-methylbenzyl)diethylenetriamine (H2L). In these complexes CoII and YIII are triply bridged by two phenoxide groups pertaining to the dideprotonated ligand (L2-) and one ancillary anion X-. The change of the ancillary bridging group connecting CoII and YIII ions induces small differences in the trigonally distorted CoN3O3 coordination sphere with a concomitant tuning of the magnetic anisotropy and intermolecular interactions. Dc-magnetic, HFEPR and FD-FT THz-EPR measurements and ab initio theoretical calculations demonstrate that CoII ions in compounds 1-3 have large and positive D values (50 cm-1). Moreover, it has been established that the D values decrease with increasing the distortion of the CoII coordination sphere. Dynamic ac magnetic susceptibility measurements indicate that compound 1 exhibits field SMMs behaviour, whereas compound 2 and 3 only display this behaviour when are magnetically diluted with diamagnetic ZnII (Zn/Co = 1/10). The dynamic properties of this family of complexes has been explained on the basis of the existence/absence of large intermolecular interactions, which seems to switch off/on the field induced SIM behaviour. Field and temperature dependence of the relaxation times indicate the prevalence of the Raman process in all these complexes above approximately 3 K.
Introduction
Nowadays, the field of Molecular Magnetism based on coordination compounds focuses its research attention on systems exhibiting sophisticated magnetic properties such as Single-Molecule Magnets (SMMs).1 These nanomagnets can function as single-domain
magnetic nanoparticles but show some advantages over classical magnetic nanoparticles, including reproducibility, monodispersity, magnetic properties that can be modulated by typical chemistry methods, solubility that allows the deposition and grafting on surfaces, among others.1aSMMs straddle the quantum/classical boundary as they display magnetic hysteresis below the so-called blocking temperature (TB), a classical property, as well as quantum properties such as quantum tunneling of the magnetization (QTM) and quantum phase interference.1These unique properties make them good candidates for potential future applications, among other areas, in ultra-high density magnetic information storage,2 magneto-optics3, molecular spintronics,1c, 4and as qubits for quantum computing at molecular level.1c,5 The ultimate aim of the vast research activity in SMMs is the integration of these systems in nanosize-devices. The SMM behavior is tied to the existence of an energy barrier (U) that allows blocking the molecular magnetization either parallel or antiparallel to the magnetic field when the polarizing field is removed below (TB), so that slow relaxation of the magnetization is observed. In principle, the larger the U value, the higher the temperature at which the SMM behavioris observed, which results in a parallel increase of the relaxation time. For transition metal clusters, the height of the energy barrier can be computed using the expressions U = │D│(ST2-1/4) and │D│ST2for half-integer and integer spin values, respectively, which are connected with the ground state zero-field splitting.1a Taking into account this, a strategy to enhance U would be that of increasing the spin multiplicity of the ground state (ST) and/or the easy-axis (or Ising-type) magnetic anisotropy of the whole molecule (D < 0). However, experimental results have shown that both parameters are correlated, so that when ST is very large (often observed for high nuclearity clusters), D tends to be low,6 so that the increase of U by increasing simultaneously ST and D is a very difficult task. Moreover, theoretical calculations7 have
shown that U is almost independent of S. As a consequence of the above considerations, the research in this field has targeted mononuclear metal complexes with large anisotropy, containing either transition metal ions with significant first order orbital angular momentum, such as CoII, FeIIand FeI or very anisotropic lanthanide ions, particularly the DyIII ion. This together with the fact that mononuclear species can exhibit larger anisotropies than their polynuclear counterparts (as indicated above, the anisotropy of the entire molecule is very hard to control in polynuclear complexes and generally low D values are observed), has fuelled the search on mononuclear SMMs, also called single-ion magnets (SIMs).1c,8 Among them, mononuclear complexes containing CoII (S = 3/2) are attracting great interest as SIMs because for Kramers ions, in absence of magnetic field, neither direct phonon-induced nor QTM transitions between the states of the ground doublet can be induced by the modulation of the crystal field.9 The absence of fast QTM favorsthe observation of thermally activated relaxation and Raman processes. Nevertheless, the splitting of the doublet states arising from first order Zeeman interactions induced by a transversal magnetic field can activate direct and QTM processes. The transversal magnetic field can arise from both internal hyperfine interactions (electronuclear spin entanglement) and intermolecular dipolar interactions.1In order to eliminate the latter interactions, magnetically diluted complexes prepared by cocrystalization with an isostructural diamagnetic compound can be employed.9,10 In the case of the CoII-SIMs, ZnII is generally used for such a magnetic dilution process.9,10 It is worth noting that SIM behaviour has been observed for CoII complexes with both D > 0 and D < 0, the former ones being much more numerous than the latter ones (including CoIIYIII and mixed valence CoII-CoIII complexes).8b,c,dAmidCoII based SIMs, six-coordinated complexes occupy a notable place.11-12It should be noted that SIM with D < 0 are limited to a few examples,11
whichcan exhibit SIM behavior under zero applied dc field above 2 K, whereas no SIM behaviour has been observed at zero field for six-coordinated CoII complexes with D > 0 (easy-plane anisotropy).12 This fact has been justified recently by the acquirement of non-zero magnetic moment by the electronuclear spin states due to the Zeeman interaction.9
In this paper, we present three new examples of CoIIYIII complexes, which can be considered as SIMs as the YIII ion is diamagnetic. These complexes are structurally similar to the dinuclear complex previously reported by us [Co(-L)(-OAc)(NO3)2],10 whereas the ancillary acetate bridging group connecting the CoII and YIII ions has been replaced by nitrate, benzoate or 9-anthracene carboxylato bridging groups. In all these complexes the CoII ion is hexacoordinated and D is expected to be positive. The change of the ancillary bridging group connecting CoII and YIII ions should induce small differences in the CoII coordination sphere with a concomitant tuning of the magnetic anisotropy and intermolecular interactions. The main aim of this work is to disclose how these two factors affect the dynamic of the magnetic relaxation. Interestingly, we will show how magnetic dilution in two of these complexes triggers field-induced SIM behaviour (“SIM hidden behaviour").
Experimental
Synthetic procedures
General Procedures: Unless stated otherwise, all reactions were conducted in
oven-dried glassware in aerobic conditions, with the reagents purchased commercially and used without further purification.The H2L ligand was prepared as previously reported.13
Synthesis of [Co(-L)(-NO3)Y(NO3)2](1): To a solution of H2L (56 mg, 0.125 mmol)
in 5 mL MeOH were subsequently added with continuous stirring 36.4 mg (0.125 mmol) of Co(NO3)2·6H2O and 47.9 mg (0.125 mmol) of Y(NO3)3·6H2O. The resulting
reddish solution was filtered and allowed to stand at room temperature. After 24-48hours, well-formed prismatic pink crystals of compound 1 were obtained. Anal. Found: C, 38.75; H, 4.89; N, 10.73. Anal. Calc. for C25H37N6O13CoY: C, 38.62; H, 4.80; N, 10.81 9.70 %.
Synthesis of [Co(-L)(-Bz)Y(NO3)2](2): As for complex 1 but also adding 15.3 mg
(0.125 mmol) of benzoic acid and 18 L (0.125 mmol) of Et3N. The resulting reddish solution was filtered and allowed to stand at room temperature. After 24-48 hours, well-formed prismatic pink crystals of compound 3 were obtained. Anal. Found: C, 45.86; H, 5.00; N, 8.49. Anal. Calc. for C32H42N5O12CoY: C, 45.94; H, 5.06; N, 8.37 %.
Synthesis of [Co(-L)(-9-AC)Y(NO3)2]·2CH3OH·2H2O (3): As for complex 1 but
also adding 27.3 mg (0.125 mmol) of benzoic acid and 18 L (0.125 mmol) of Et3N. The resulting reddish solution was filtered and allowed to stand at room temperature. After 24-48 hours, well-formed prismatic pink crystals of compound 2 were obtained. Anal. Found: C, 49.39; H, 5.74; N, 7.34. Calc. for C42H54N5O15CoY: C, 49.61; H, 5.35; N, 6.89 %.
General syntheses of diluted samples 1’-3’. Analogous to the synthetic method of 1-3
but using a 1:10 Co/Zn ratio, that is 3.63 mg (0.0125 mmol) of Co(NO3)2·6H2O and 37.19 mg (0.125 mmol) of Zn(NO3)2·6H2O. The same method was employed to prepare the diluted complex 3" with a 5:100 Co/Zn ratio but using 1.81 mg (0.0062 mmol) and 37.19 mg (0.125 mmol) of Zn(NO3)2·6H2O.
Physical measurements
Elemental analyses were carried out at the “Centro de InstrumentacionCientifica” (University of Granada) on a Fisons-Carlo Erba analyser model EA 1108. IR spectra on powdered samples were recorded with a Thermo Nicolet IR200FTIR using KBr pellets.
Variable-temperature (2−300 K) magnetic susceptibility measurements on polycrystalline samples of 1-3 and 1′-3' under an applied field of 1000 Oe were carried out with a Quantum Design SQUID MPMS XL-5 device. Alternating-current (ac) susceptibility measurements under different applied static fields were performed using an oscillating ac field of 3.5 Oe and ac frequencies ranging from 1 to 1500 Hz. The experimental susceptibilities were corrected for the sample holder and diamagnetism of the constituent atoms using Pascal’s tables. A pellet of the sample cut into very small pieces was placed in the sample holder to prevent any torquing of the microcrystals.
HFEPR measurements were performed at the NHMFL at several subterahertz frequencies between 50 and 650 GHz and low temperatures on loose powders and pellets, using an instrument described previously in detail14 with the exception of a Virginia Diodes subterahertz wave source, consisting of a 13 ± 1 GHz frequency generator and a cascade of amplifiers and frequency multipliers. X-Band EPR was performed using a Bruker Elexis 580 X/Q-band EPR spectrometer equipped with a dielectric EN 4118X-MD4 resonator and a cryogen-free ER 4118HV-CF58 FlexLine cooling system. The MW power was 2 mW at the frequency of 9.69 GHz. Modulation amplitude was 0.4 mT at 100 kHz frequency.
Frequency domain Fourier transform THz electron paramagnetic resonance (FD-FT THz-EPR) spectra were measured at the FD-FT THz-EPR experiment at BESSY II, which is described in detail elsewhere.15,16 An Hg-arc lamp was used as source of broadband unpolarized radiation. Samples were prepared as pressed pellets containing a mixture of the compound under study and PE powder and mounted in the superconducting magnet. For detection purposes a liquid Helium cooled Si bolometer was used. Experimental resolution was 0.5 cm-1. Due to the fact that magnetic features are often extremely weak in comparison to nonmagnetic absorption in far-IR range,
traditional FT-IR reference methods cannot be used. Absorbance spectra were obtained by using a spectrum measured at a temperature of 30 K as reference spectrum for a spectrum measured at 5 K. Then the absorbance spectrum is obtained as 𝐴 = 𝑙𝑜𝑔10(𝐼𝑟𝑒𝑓
𝐼𝑙𝑜𝑤𝑇), with 𝐼𝑟𝑒𝑓 the reference spectrum and 𝐼𝑙𝑜𝑤𝑇 the spectrum measured at a
temperature of 5 K. In the energy region investigated in this work several strong non-magnetic absorptions were observed. Therefore it is useful to vary the non-magnetic field instead of the temperature. For recording Magnetic Field Division Spectra (MDS) the temperature was kept constant at 5 K. The MDS at the magnetic field 𝐵0 is obtained by dividing the spectrum measured at the external magnetic field 𝐵0 by a spectrum measured at the magnetic field 𝐵0 + 2 T. The magnetic field induced shift of an absorptive feature can be observed in the MDS, where a minimum corresponds to stronger absorption at the magnetic field 𝐵0 and a maximum to stronger absorption at the increased magnetic field 𝐵0 +2 T. Therefore in MDS one can identify magnetic transitions originating from the ground state, due to the low temperature. The field step of 2 T was chosen in accordance with the experimentally observed linewidth of the features. We found that the spectral range is limited at low energies by the characteristic of the used source, which reveal too low radiation intensity below 20 cm-1. Using instead the very powerful coherent synchrotron radiation of BESSY II running in the low-α mode17 the spectral range could be increased down to 4 cm-1. The high-energy limit is due to the z-cut quartz windows of the superconducting magnet.
All simulations and fitting attempts were done using EasySpin.18 Magnetic susceptibility was simulated taking explicitly the applied magnetic field into account. For FD-FT THz-EPR simulations, the recently introduced frequency-domain simulation extension of EasySpin including the ability to take into account the fact that the MW radiation can be unpolarized as it was in the experiments presented herein.19
Single-Crystal Structure Determinations.
Suitable crystals of 1-3 and 2' were mounted on a glass fibre and used for data collection. X-ray diffraction data of 1 and 2 were collected at 110 K using a Bruker AXS SMART APEX CCD diffractometer (Mo Kα radiation, λ= 0.71073 Å) outfitted with a CCD area-detector and equipped with an Oxford Cryosystems 700 series Cryostream device. Unit-cell parameters were determined and refined on all observed reflections using APEX2 software.20 Correction for Lorentz polarization and absorption were applied by SAINT and SADABS programs, respectively.21,22
Intensity data for compound 3 and 2'were collected at 100 K on a Agilent Technologies SuperNova diffractometer (mirror-monochromatedMoK radiation, = 0.71076 Å) equipped with Eos CCD detector. Data collections, unit cell determinations, intensity data integrations, routine corrections for Lorentz and polarization effects and analytical absorption corrections with face indexing were performed using the CrysAlis Pro software package.23
The structures were solved by direct methods and refined by the full-matrix least-squares method onF2 using the SHELX software suite and SHELXL-2014 program.24 All non-hydrogen atoms were refined anisotropically. Hydrogen atom positions were calculated and isotropically refined as riding models to their parent atoms. A summary of selected data collection and refinement parameters can be found from the Supporting Information (Table S1).
Computational methodology
The calculation of zero-field splitting parameters (D and E) were carried out with two different software packages: MOLCAS25 and ORCA.26We have used MOLCAS (along with the SINGLE_ANISO 27 code) to carry out CASSCF calculations of the energy states of the CoIIYIIIcomplexes. Then, spin-orbit coupling has been
considred, as implemented in the SO-RASSI (Restricted Active Space State Interaction) approach, to mix up these energies and obtaining the final energy states. In these calculations we have employed an all electron ANO-RCC basis set:28 Co atoms (6s5p4d2f), N (4s3p2d1f), C (3s2p) and H (2s). Similar CASSCF calculations wereperformed with ORCA. In this case, spin–orbit effects were included using the quasi-degenerate perturbation theory (QDPT)29 and N-electron valence perturbation theory to second order (NEVPT2)30. Scalar relativistic effects were taken into account by second-order Douglas-Kroll-Hess (DKH) procedure.31In these calculations, all the atoms are described by the def2-TZVPP basis set,32 including the corresponding auxiliary basis sets for correlation and Coulomb fitting. In both sets of calculations, the active space includes seven electrons in five 3d-orbitals of Co(II) CAS (7,5). We have included all 10 states for the 2S+1 = 4 (quartet) states arising from the 4F and 4P terms of Co(II), and all the 40 states for the respective 2S+1 = 2 (duplet) states arising from the 2P, 2D (twice), 2F, 2G and 2H terms of Co(II) ion.
Splitting of the d-orbital was obtained with a new ab initio ligand field theory that was recently developed. Eigenvalues and eigenfunctions from CASSCF/NEVPT2 calculations were used to reconstruct the matrix of the ligand field Hamiltonian, which was parameterized in terms of the 5x5 one-electron ligand field matrix elements accounting for the splitting of the nominal 3d-orbitals due to interaction with the ligand donor atoms, as well as the Racah parameters B and C to take inter-electronic repulsion into account. Since all matrix element of the ligand field Hamiltonian matrix are linearly depended on these parameters, the latter can be determined via a least squares fitting method to the corresponding ab initio values of the same matrix elements.33The results of these calculations are given in Table 2 and Table S2.
Results and Discussion
We have recently shown that the heptadentate compartmental ligand H2L = N,N’,N”-trimethyl-N,N”-bis(2-hydroxy-3-methoxy-5-methylbenzyl)diethylenetriamine (see Figure 1),which has an inner N3O2pocket and an outer O2O2coordination site that have preference for transition metal and lanthanide ions,respectively, is able to form a stable CoIIYIIIcomplex [Co(-L)(-OAc)Y(NO3)2],10 in which the metal ions are triply bridged by two phenoxide groups and one acetate anion. This latter ligand is required in order to saturate the octahedral coordination sphere of the CoII ion. Now, using the same ligand, we have prepared three new dinuclear CoIIYIII complexes, in which the ancillary bridging ligands between CoII and YIII ions are can be nitrate, benzoate and 9-antrecene carboxylate (9-AC).
The reaction of H2L with Co(NO3)2·6H2O and subsequently with Y(NO3)3·6H2O in methanol in 1:1:1 molar ratio afforded the dinuclear complex [Co(-L)(-NO3)Y(NO3)2] 1. When benzoic acid and triethylamineare added to the resulting solution for the preparation of 1 in 1:1:1:1:1 molar ratio, the compound [Co(-L)(-Bz)Y(NO3)2] 2 was obtained. The same reaction but using 9-anthracene carboxylic acid instead of benzoic acid afforded the complex [Co(-L)(-9-AC)Y(NO3)2]·2CH3OH·2H2O 3 (Figure 1).
X-Ray Structures
Selected bond lengths and angles for compounds 1-3 are given in Table 1, whereas their molecular structures are given in Figures 1. Compound 1 is isostructural to a Ni-Tb previously reported by us34 and its structure consists of isolated dinuclear molecules in which the CoII and YIII are triply bridged by two phenoxide groups pertaining to the dideprotonated ligand (L2-) and one nitrate anion (Figure 1).
Figure 1. Synthesis and perspective view of the structures of compounds 1-3.
Colour code: N = blue, O = red, Co = pink, Y = light blue, C = grey. Hydrogen atoms are omitted for the sake of clarity.
As expected, the CoII ion is located in the inner site of the ligand and shows a trigonally distorted coordination polyhedron, where the three amine nitrogen atoms and, therefore, the three oxygen atoms belonging to the phenoxide and nitrate bridging groups assume a fac configuration. The structures of 2and 3 are very similar to that of 1 but replacing the nitrato bridging ligand by benzoate or 9-anthracene carboxylatoligands, respectively, adopting a syn-syn bridging coordination mode (Figure 1).
In all these complexes the YIII atom exhibits a YO9 coordination sphere, which is always made of two bridging phenoxide and two methoxy oxygen atoms belonging
to the L2- ligand, whereas the remaining five oxygen atoms pertainto two bidentate nitrato ancillary ligands and to the nitrato, benzoatoand 9-AC bridging ligands.
The bridging coordination ofnitrato, benzoato and 9-AC ligands provokes the folding of the Co(-diphenoxido)Y bridging fragment with average O-Co-O-Y hinge angles of 15.16 °, 19.20 ° and 18.74 ° for 1-3, respectively (the hinge angle is thedihedral angle between the O-Ni-O and O-Y-O planes in the bridging fragment), whereas the Co-Y distances are found to be 3.445 Å, 3.432 Å and 3.418 Å for 1-3, respectively. In view of this, it is clear that the change of the ancillary bridging ligand between CoII and YIII (nitrato, benzoato and 9-AC) induces small but significant variations in the structural parameters of the [Co(-diphenoxido)Y] bridging region, which slightly modifythe CoIIcoordination sphere (see Table 1). Thus, the distortion of the CoN3O3 coordination polyhedron with regard to ideal six-vertex polyhedra, which was calculated by using continuous shape measure theory and SHAPE software (Table S3),35indicated that the CoII coordination polyhedron for these compounds is found in the OC6↔TPR6 deformation pathway but much closer to the OC-6 geometry. The shape measure values for the OC-6 polyhedron are 2.057, 1.610 and 1.680 for complexes 1, 2 and 3, respectively, indicating the distortion follow the order 1>2 ≈3. The smaller the hinge angle, the larger is the distortion of the CoII coordination sphere from the OC-6 geometry.
Magnetic Properties
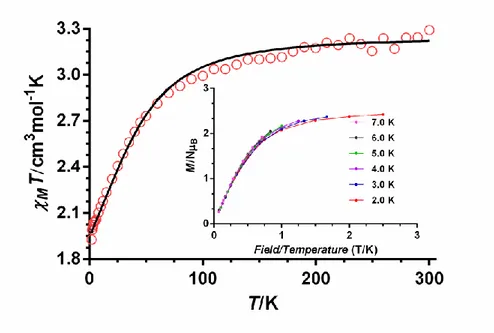
The temperature dependence of the molar magnetic susceptibility (M) per CoII ion of complexes 1-3 in the 2-300 K temperature range under an applied magnetic field of 1000 Oe are given in Figure 2 (the plot for complex 3 is given as an example) and Figures S1 and S2 in the form χMT versus T. The χMT values at room temperature for complexes 1-3 of 2.70, 2.06 and 3.29 cm3mol-1K, respectively, are greater than the
expected for a orbitally non-degenerate ground state S = 3 /2 spin of 1.875 cm3mol-1K , which is indicative of unquenched orbital contribution of the Co(II) ion in distorted octahedral geometry. When the temperature is lowered, the MT product decreases first
slightly from room temperature to 70 K and then in a sharper manner to reach values of 1.65,1.86 and 1.92 cm3mol-1K at 2 K, for 1-3, respectively. This decrease is mainly due to spin-orbit coupling (SOC) effects.
Figure 2.- Temperature dependence of χMT for compound 3. The solid line represents the best fit curve (see text). M vs H/T plot for compound 3 (inset).
If for the sake of ease, we consider a C3v local symmetry for the distorted octahedral CoN3O3 coordination polyhedron of 1– 3,the triplet 4T1g ground state for the ideal Oh symmetry splits into an orbital singlet 4A2 and an orbital doublet 4E, with a energy gap between them described by the axial splitting parameter, . The 4A2 and 4E levels are additionally split by second order spin-orbit coupling leading to two and four Kramers doublets, respectively. When is large enough and positive only the two lowest Kramers doublets coming from the 4A2 ground term, 6 and 7, are thermally populated and the energy gap between these two Kramers doublets can be considered as an
zero-field splitting (ZFS) within the quartet state. If so, the magnetic properties can be interpreted by using the following Hamiltonian:
𝑯 = 𝐷[𝑺𝑧2− 𝑆(𝑆 + 1) 3⁄ ] + 𝐸(𝑺𝑥2− 𝑺 𝑦
2) + 𝑔𝜇 𝐵𝐻𝑺,
whereS is the spin ground state, D and E are the axial and transverse magnetic anisotropies, respectively, B is the Bohr magneton and H the applied magnetic field. If
E = 0, then 2D symbolize the energy gap between ±1/2 and ±3/2 Kramers doublets
(KD) arising from second order SOC of the quartet ground state. If D> 0 the Ms = ±1/2 doublet lies below the Ms = ±3/2 doublet on the energy scale and if D < 0, vice versa. The temperature dependence of the magnetic susceptibility data for 1-3 was fitted with the above Hamiltonian using the PHI program36 (Figure 2 and Figures S1 and S2). The best fits of the data were obtained by fixing E = 0 and using isotropic g tensors. The following magnetic parameters were extracted from the fits: D = +42.0 cm-1, g = 2.41 for 1, D = +53.0 cm-1, g = 2.57 for 2 and D = +51.80 cm-1, g = 2.63 for 3. Nevertheless, it should be noted that reasonably good fits can also be obtained when: (i) E are fixed to zero and axial tensors 𝑔⊥ and 𝑔||are used; (ii) D and E is allowed to freely vary using an isotropic g tensor; (iii) negative D values are employed. In these cases, │D│ values are found in the ranges 40.0-42.1cm-1, 50.0-54.1cm-1and 49.1-54.1 cm-1 for 1-3, respectively. In view of these results, we can conclude that these compounds exhibit large │D│ values, which are found in the 40-55 cm-1 range. These values are close to that previously reported for the analogous complex [Co(-L)(-OAc)(NO3)2].10 In view of the above results, the magnitude of the ZFS (the energy separation, , between the ms =±1/2 and ms =±3/2 Kramers doublets), which is given by = 2(D2+3E2)1/2, should be for 1-3 in the range 80-120 cm-1. When the ZFS is very large, as in the case of
complexes 1-3, the M vs H/T isotherms depend only slightly on temperature (see Figure 2 for compound 3 and Figures S1 and S2 for compound 1 and 2) so that the ZFS parameters cannot be accurately obtained from the fitting of the temperature dependence of the magnetization at different magnetic fields to the above Hamiltonian.
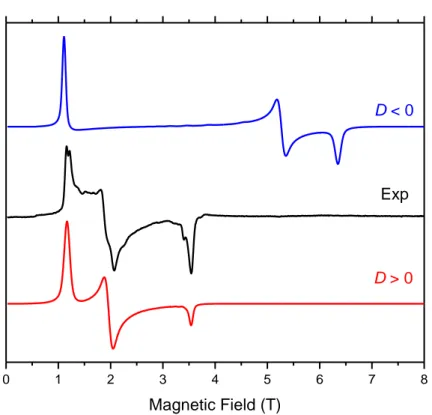
In order to unambiguously know the sign of D, we have performed low-temperature (down to 5 K) high-frequency and -field EPR (HFEPR) measurements in the 50–650 GHz, and 0–14.5 Tesla range, respectively, on powder samples of 1-3 (Figure 3 and Figures S3 and S4). All the HFEPR spectra are characteristic for high-spin (S = 3/2) CoII with large positive axial ZFS parameter D. No transitions between the ms = ± 1/2 and ± 3/2 KDs were observed because the energy gap between these doublets is significantly larger than the highest available energy of the sub-THz wave quantum (23 cm–1). However, the observed resonances could be unequivocally attributed to a transition within the ms = ± 1/2 manifold (this transition is allowed because ms = ± 1), thus confirming that the ms = ± 1/2 KD lies lower on the energy scale than the ms = ± 3/2 KD and therefore D is positive (Figure 3). Although the magnitude of the ZFS cannot be extracted from the transition within the ms = ± 1/2 manifold, however, it allows to evaluate the E/D rhombicity factor. This factor is found to be between the limits 0.059 <E/D< 0.225 for complexes 1-3, probably close to the upper limit (see Table S4). In the case of D < 0, the lower-lying KD is ms = ± 3/2; the transition within this manifold is nominally forbidden (ms = ± 3) and the EPR spectrum is usually absent if E/D ~ 0.
Figure 3. A 101.6 GHz spectrum of 3 at 10 K (black trace) accompanied by two
simulations using the following parameters: |E/D| = 0.174, g⊥ = 2.53, g|| = 2.24. Red trace: D > 0; blue trace: D < 0. In each case |D| was fixed at 56.4 cm–1 (the value obtained by NEVPT2 calculations) and the rhombicity of the zfs tensor was calculated under assumption of an axial g-tensor (i.e. ignoring the rhombicity of g-tensor).
0 1 2 3 4 5 6 7 8
Exp
D > 0
D < 0
Figure 4.- X-band EPR spectrum of a diluted sample of 3” (Co/Zn= 1/20).
Experimental and simulated spectrum (with the effective spin S’=1/2 and 𝑔′𝑥 = 6.1(3), 𝑔′𝑦 = 3.9(1), 𝑔′𝑧 = 2.05(5), and 𝐴′𝑥 = 380(30) MHz) are shown in black and red colours, respectively.
X-Band EPR spectra of 3’’ (magnetically diluted version of 3 with a CoII/ZnII ratio = 1/20, see Figure 4) reveal three EPR lines at 115, 180, and 340 mT (the EPR spectrum of 3 was quite complex, probably due to intermolecular interactions). All three lines decrease in intensity with increasing temperature (see Figure S5). The low-field line was observed to be splitted in 8 partly overlapping lines, most probably due to hyperfine interaction with the 59Co nucleus with I =7/2. Simulations with an effective spin 𝑆’ = ½ (assuming that only transitions between the ground state KD are observed) were successful with: 𝑔′𝑥 = 6.1(3), 𝑔′𝑦 = 3.9(1), 𝑔′𝑧 = 2.05(5), and 𝐴′𝑥 = 380(30) MHz.
In order to accurately determine the magnitude of the ZFS we used FD-FT THz-EPR spectroscopy. This technique allows to directly extracting the value of the ZFS, i.e the energy separation . However, no information whatsoever on the signs of the ZFS parameters can be obtained. FD-FT THz-EPR records the transition between the two
50 100 150 200 250 300 350
B
0(mT)
data sim
KDs, regardless of which of the doublets is lower in energy. Because of the limited access to the FD-FT THz-EPR technique, we have only recorded the spectrum of 3 (Figure 5).
80
90
100
110
120
0
2
3
4
5
6
B
0
(T)
Energy (cm
-1
)
exp. data
sim no selection
sim selection
energies:
B
0⊥ z
B
0|| z
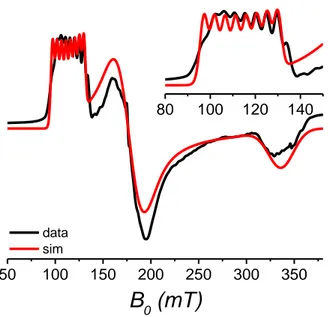
Figure 5: FD-FT THz-EPR MDS spectra of compounds 3.Experimental result are
shown as black solid lines. Spectra are offset according to the external magnetic field at which they were measured. Simulations with 𝐷 = 56.6(4) cm-1, E = 8.5(6) cm-1 (𝐸
𝐷 =
0.15(1)),𝑔⊥= 2.5(1), and 𝑔|| = 2.18(5) are included as dotted lines. In red a simulation considering all transitions is shown. A simulation, which excludes the transition from
the ground state to the highest excited state, is shown in green.The transition energy for transitions originating from the ground state are shown for external magnetic field applied along the three principal axes of the compounds as blue lines (dotted: B0 || x and solid: B0 || z, for).
A minimum could be observed in the MDS at B0 = 2 T, corresponding to absorption in the absence of a magnetic field at an energy of 109.5 cm-1.This feature split both to higher and lower energies with increasing magnetic field and, consequently, assigned to be of magnetic origin. On both the low- and high-energy sides of the minimum at 109.5 cm-1, maxima were observed, where the latter was observed much more pronounced. With increasing magnetic field the minimum shift slightly towards higher energies and was observed as significantly broader. The direct measure of ZFS is in general an outstanding result, but especially for energies as high as 109.5 cm-1 or 3.3 THz. The value of = 54.7(5) cm-1 (extracted from FD-FT THz-EPR) can be converted into D using the E/D ratio of 0.17 obtained from HFEPR, which thus yields |D| = 52.5 cm–1. The same value made it possible to reproduce not only the HFEPR spectra of the bulk sample of 3, but also the X-Band EPR spectrum of a 5/100 (Co/Zn) diluted complex 3’’ at 5 K (the X-band spectrum of a bulk sample of 3, which is shown in Figure 5, was quite complex. Probably this is due to inter-molecular exchange interactions, which are known to influence the spectrum of CoII complexes) with the following parameters, E/D
= 0.15(1)),𝑔⊥= 2.5(1), and 𝑔|| = 2.18(5). Effective 𝑔𝑖 ′for the doublet ground state (modelled by an effective spin S’ = 1/2) are obtained from Pilbrow’s equations as 𝑔′𝑥 = 3.88, 𝑔′𝑦 = 6.07, 𝑔′𝑧 = 2.04. They agree within uncertainty with those obtained above.
Simulations of M vs H curves at different temperatures with 𝐷 = 56.6(4) cm-1, E = 8.5(6) cm-1 (E/D = 0.15(1)), 𝑔⊥ = 2.65, and 𝑔⊥ = 2.2 allow excellent agreement with measured T and magnetization (see Figure S6). FD-FT THz-EPR spectra simulated with these parameters (Figure 5) were observed to reproduce the experimental results measured in the absence of a magnetic field. However, with increasing magnetic field the simulated feature (best observable for the maximum) shift faster to higher energy values than observed in the experimental spectrum. However, neglecting the transition from the ground state to the highest excited state the experimental results can be well reproduced (see Figure 5).
Compound 3 differs only by the ancillary bridging ligand from the analogous compound [Co(-L)(-OAc)Y(NO3)2](9-AC instead of acetato).10 FD-FT THz-EPR measurements on this compound reveal that this subtle tuning on the CoII coordination sphere allows to increase the ZFS by roughly 10 %. 37
In order to support the sign and magnitude of for complexes 1-3, we have performed electronic structure CASSCF calculations of the ZFS parameters D and E on the X-ray structures using either MOLCAS25 or ORCA26 and software packages. Likewise, NEVPT2 calculations were carried out with ORCA. The SO-RASSI approach included in MOLCAS and quasi-degenerate perturbation theory (QDPT) implemented in ORCA produce very similar results, which indicate that the computed D values (Table 2) for the three complexes are overestimated with regard to those obtained experimentally from magnetic data and FD-FT THz-EPR spectra. However, the computed D values with NEVPT2 RASSI calculations are smaller and closer to the experimental values. Interestingly, the value for 3 of 120.2 cm-1 agrees rather well with that extracted from FD-FT THz-EPR spectroscopy of 109.5 cm-1. The difference between experimental and calculated D values are most likely due, among other
reasons, to limitations inherent to the theoretical methods, certain inaccuracy of the magnetic data, and the possible slight changes of the CoII coordination sphere at low temperature with regard to the crystal structures employed in the theoretical calculations.
Calculations support D > 0 values for the three complexes and confirm that D values follow the same order as in the experimental results: D1 < D2 D3. Finally, it should be pointed out that the computed │E/D│ values agree rather well with those extracted from HFEPR spectra (see Table S4).
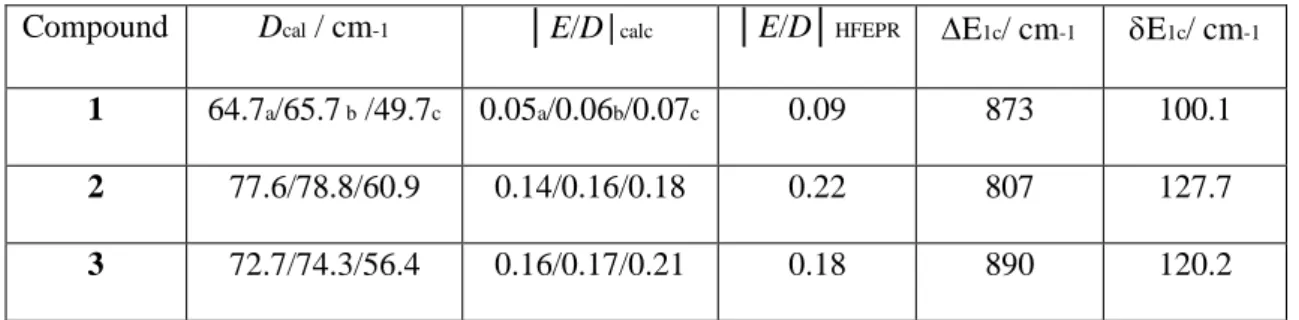
Table 2.- CASSCF + RASSI and NEVPT2 + RASSI values of D and |E| and first
excitation energies calculated at the spin-free CASSCF and NEVPT2 levels (E1), respectively, and after the inclusion of spin–orbit effects (E1)
a and b CASSCF+RASSI with MOLCAS and ORCA, respectively. cNEVPT2 + RASSI with ORCA
It has been recently shown form theoretical calculations11a that positive values for D are expected for CoII octahedral complexes, whereas D < 0 values are predicted for trigonal prismatic CoII complexes. This prediction is based on the evaluation of Dii components (i = x,y,z), which determine the sign and magnitude of D. These components depend inversely on the energy of the d-orbitals, specifically on the excitation energies, as well as of the ml values of the orbitals involved in the lowest energy transitions. Therefore, there exists a correlation between the computed D values and the energy of the quartets states before applying spin-orbit coupling. The distortion
Compound Dcal / cm-1 │E/D│calc │E/D│HFEPR E1c/ cm-1 E1c/ cm-1
1 64.7a/65.7 b /49.7c 0.05a/0.06b/0.07c 0.09 873 100.1
2 77.6/78.8/60.9 0.14/0.16/0.18 0.22 807 127.7
of the octahedral geometry in these compounds gives rise to a distribution of d-orbitals in which the t2g orbitals in Oh are not degenerate and very close in energy (see figure S7). The same can be ascribed for the d orbital arising from the eg Oh orbitals after distortion. In this situation, the first two excited quartet states (which arise for the interchange of one electron between the double-occupied d orbitals and the semi-occupied orbital coming from t2g orbitals in Oh) and the ground quarted state (GQS) are close in energy (see Table S2). For example, in the case of 3, these two quartets state are located 890 cm-1 and 1479 cm-1 above GQS.Therefore, a strong contribution from these two first excited states to D is expected, being the contribution of the first excited state larger than that of the second excited state. The other excited quartet states are much higher energies above the GQS and consequently their contribution to D is expected to be very weak. If dxz and dyz orbitals are double-occupied and the dxy orbital is semi-occupied, the orbitals involved in the first excitations are related by changes of ±1 in ml and therefore D should be positive, which is in good agreement with the above indicated HFEPR results and theoretical calculations for complexes 1-3. This prediction fully agrees with the results from CASSCF + RASSI and NEVPT2 + RASSI calculations with ORCA given on Table 3 and Table S2.
Table 3.-Contributions to D-tensor from NEVPT2 + RASSI calculations
Compound 1 2 3 D E D E D E 4Φ1 27.486 0.371 35.698 34.336 34.601 33.883 4Φ2 24.279 1.619 23.644 -21.829 22.217 -21.343 4Φ3 0.690 1.316 -0.296 -1.003 -0.885 0.026 4Φ4 0.947 0.614 -2.153 -0.466 -1.358 -0.045 4Φ5 -9.622 -0.271 -5.104 0.921 -7.349 0.321
It is worth noting that there is a non-linear correlation between the calculated D values for 1-3 and the analogous [Co(-L)(-OAc)(NO3)2],10and the distortion from the octahedral geometry quantified by the shape measures parameter (S): the larger the distortion (larger S) the smaller is the D value (see Figure S8).The results for this family of complexes,that only differ in the ancillary bridging ligand, clearly show how this slight modification of the CoII coordination sphere significantly affect the magnitude of ZFS. This exemplifies that the ZFS is an extremely sensitive probe for the electronic structure. Hence, the whole molecular structure has to be considered in targeted synthesis with the aim to reach high ZFS.
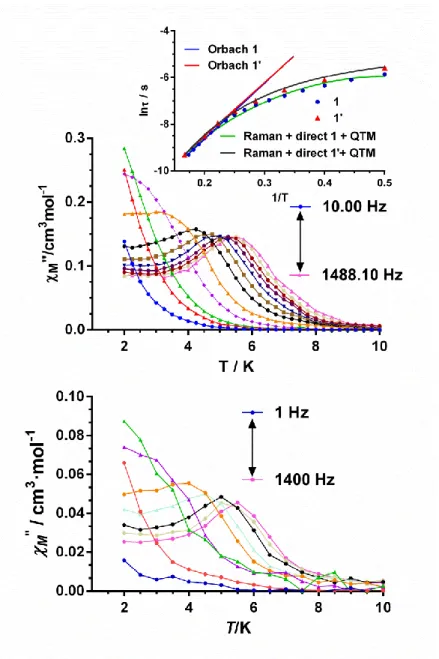
Dynamic alternating current (ac) magnetic susceptibility measurements were carried out for complexes 1-3 at a 3.5 Oe ac field. None of these complexes showed out-of-phase signals (M) under a zero dc applied field, thus pointing out that either these complexes do not exhibit SIM behavior below 2 K or the magnetization relaxation takes place through a ground state fast quantum tunneling process (QTM), which can be induced by intermolecular and/or strong hyperfine interactions with the I = 7/2 nuclear spin of the cobalt (II) ion. For Kramers ions, like CoII, the direct and QTM relation processes in a given doublet state are forbidden in strictly zero field.9 However, nuclear-spin interactions, as well as a transversal magnetic field created by intermolecular interactions (which is proportional to the matrix element of the transversal magnetic moments between the two doublet states) split the doublet states providing relaxation channels for direct and QTM processes. After applying a 1000 Oe dc field to partly or fully eliminate the QTM fast relaxation, only complex 1 showed a clear frequency dependency of the in-phase (´M) and out-of-phase signals (M) with maxima in the 3K (200 Hz) - 5.5 K (1488 Hz), as it can be observed in Figure 6 and Figures S9-S10.
Application of a magnetic field of 1000 Oe was also shown to be required to observe slow relaxation of magnetization in the analogous complex [Co(-L)(-OAc)(NO3)2].10 The presence of field is necessary because, as it has been recently shown for Kramers ions (particularly for those with D > 0), at zero dc field the electronuclear spin states arising from the hyperfine interactions have, if any, negligible magnetic moments and so slow relaxation cannot be observed.9 However, when a dc magnetic field is applied, the electronuclear spin states attain a non-zero magnetic moment and slow relaxation is observed. It is worth mentioning that the magnetic diluted compounds 2’ and 3’ (see below), where intermolecular interactions are suppressed, present, in contrast to the undiluted complexes 2 and 3, field induced SIMs behaviour. Therefore, the absence of slow relaxation of 2 and 3 under a dc applied field of 1000 Oe could be due to the existence of larger intermolecular interactions than in complexes 1 and [Co(-L)(-OAc)(NO3)2]. In order to support this assumption, we have analyzed the intermolecular interactions in compounds 1-3. These interactions can arise from spin-spin dipolar interactions, which vary approximately with the (/r3) ratio, where is the magnetic moment of the magnetic dipole and r is the nearest neighbour distance between magnetic dipoles. In this regard, the shortest Co···Co intermolecular distance for 2 of 8.423 is larger than that observed for 1 but, at variance with this compound, 2 exhibits weak - stacking interactions involving phenyl rings of the compartmental ligand with a distance between the ring centroids of 3.60 Å (Figure S11). In complex 3, the shortest Co···Co intermolecular distance of 7.469 Å is shorter than those found for 1 and [Co(-L)(-OAc)(NO3)2]10 and there exist - stacking interactions between the anthracene rings with distances between the aromatic carbon atoms of parallel anthracene rings shorter than 3.3 Å (Figure S12). Therefore, in 3 the intermolecular interactions are clearly stronger than in 1 and [Co(-L)(-OAc)(NO3)2]10, whereas in 2 the situation is
less clear. However, if we consider the atoms in the virtual line connecting nearest neighbours Co2+ ions (with the shortest Co···Co distance), which can protect Co2+ ions from the dipolar influence of nearest neighbouring Co2+ metal ions, the existence of strong intermolecular interactions in 2 and 3 is clearly supported (Figure S13). In the case of 1 and [Co(-L)(-OAc)(NO3)2]10, the carbon atoms of the triamine chelate rings of the L2- ligand shield the Co2+ from the direct influence of the nearest neighbouring Co2+ atoms, thus precluding strong dipolar interactions. In 2 and 3, however, the Co2+ are not directly shielded and dipolar interactions are larger than in 1 and [Co(-L)(-OAc)(NO3)2]10. In view of the above considerations it is reasonable to assume that the existence/absence of large intermolecular interactions seems to switch off/on the field induced SIM behaviour in this family of complexes. Nevertheless, this suggestion should be taken with caution as other factors such as the molecular arrangement in the crystal lattice, the crystal density, the speed of the sound in the solid and the strength of the spin-phonon interactions can influence QTM and spin-lattice direct and Raman relaxation process.
The relaxation times (τ) for 1 were determined from the fit of the frequency dependence of M at each temperature to the generalized Debye model (Figures S10). The high temperature linear portion of the data were fitted to the Arrhenius expression ( 𝜏−1= 𝜏
0−1e−𝑈𝑒𝑓𝑓/𝑘𝐵T) for a thermally activated process (Orbach process) leading to an effective energy barrier for the magnetization reversal (Ueff) of 23.9(8) K and a τ0 value of 1.5·10-6 s. The Arrhenius plot built from the temperatures and frequencies of the maxima observed for the M afforded similar Ueff and τ0 values, as expected. It should be noted that the value of the effective energy barrier (Ueff) is much lower than , the energy gap between the ground and first excited doublet states, determined from temperature susceptibility data and from ab initio calculations (84 and 99.4 cm-1,
respectively). Bearing in mind that the Orbach process takes place between real magnetic energy levels and complex 1 does not have energy levels below 84 cm-1, the relaxation cannot proceed via an Orbach process with an Ueff = 23.9(8) K. The field dependence of -1 is given in Figure S and shows that -1 decreases as the field increases, which indicates the progressive quenching of QTM. The -1 vs H data were fitted to the following equation: 𝜏−1 = 𝐴𝐻4𝑇 + 𝐵1
1+𝐵2𝐻2+ 𝐶 (equation 1), where the first two terms
correspond to the direct and QTM relaxation processes, respectively, whereas the constant term C accounts for field independent relaxation processes (Figure S14). Then, the temperature dependence of -1 for 1 was fitted to the equation 𝜏−1= 𝐴𝐻4𝑇 +
𝐵1
1+𝐵2𝐻2+ 𝐵𝑇
𝑛, (equation 2), which takes into account the concomitant presence of direct, QTM and Raman relaxation processes (Figure S15). In order to avoid overparametrization, the parameters corresponding to QTM (B1 and B2) were fixed to those previously extracted (see above) from the field dependence of -1. The fits show (Figure S15) the dominance the Raman process above approximately 3 K, whereas below this temperature the direct is the main relaxation process. Although n = 9 for Kramers ions,38 however, depending on the structure of the levels and if optical phonons are considered, n values between 1 and 6 can be considered as acceptable.39 The best fit of the experimental data (Figure 6 and Figure S15) afford the parameters indicated on Table 4. It should be noted that similar n values were obtained for compound [Co(-L)(-OAc)(NO3)2].10,11d
Figure 6. Temperature dependence of the out-of-phase components of the ac
susceptibility at different frequencies for complexes 1(middle) and 1’ (Co/Y 1:10) measured under 1000 Oe applied dc field. Solid lines are only guides for the eyes. Arrhenius plots (top inset). The blue and red lines correspond to 1 and 1’, respectively. The green line represents the best fit to direct plus Raman relaxation processes.
The Cole-Cole plots for 1 show, in the temperature range 3.0-5.5 K, semicircular shapes that can be fitted by using the generalized Debye model (Figure S16). This fit afford a value for the parameter α, which is related to the width of the distribution of
relaxation times, that is, α = 1 corresponds to an infinitely wide distribution of relaxation times, whereas α = 0 describes a single relaxation process. The extracted α parameters are found in the 0.14 (3 K) - 0.05 (5.5 K) range, which would be compatible with the existence of more than one relaxation process in this temperature region. However, between 4 K and 5.5 K the values are found in the range 0.065-0.050, respectively, pointing out the existence of only one relaxation process. Thus, below approximately 4 K, Raman and direct processes are predominant and coexist, whereas above this temperature mainly takes place the Raman process.
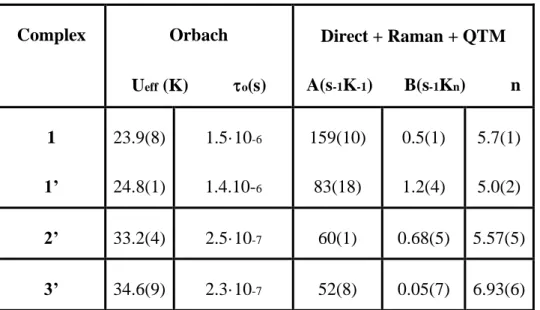
Table 4.- Fitting Parameters for Orbach and Raman plus direct processes for
compounds 1, 1’, 2’ and 3’. Complex Orbach Ueff (K) o(s) Direct + Raman + QTM A(s-1K-1) B(s-1Kn) n 1 1’ 23.9(8) 24.8(1) 1.5·10-6 1.4.10-6 159(10) 83(18) 0.5(1) 1.2(4) 5.7(1) 5.0(2) 2’ 33.2(4) 2.5·10-7 60(1) 0.68(5) 5.57(5) 3’ 34.6(9) 2.3·10-7 52(8) 0.05(7) 6.93(6)
Although suitable crystals for X-ray crystallography could not be obtained for complexes 1’, however its X-ray powder diffractograms (Figure S17) clearly evidence that it has the same structure as the undiluted counterpart 1.The diluted complex 1’ does not show significant changes in the positions of the maxima in the Mvs. T plot with
regard to the undiluted complex 1 (Figure 6 and Figures S18-S20). This fact is not unexpected in view of the almost negligible intermolecular interactions present in 1. As in 1, some QTM seems to remains in 1’, which is evidenced by the fact that M does not goes to zero after the maxima (Figure 6). This behavior could be due to hyperfine interactions, which matches well with the fact that slow relaxation is only observed in the presence of applied magnetic field. As expected, the Ueff and o values for 1’ (see Table 4) are almost identical to those observed for 1. As expected, compound 1’ presents similar field and temperature dependences of -1 to those of observed 1 (Figure S14 right).The same treatment as for 1 of the -1 vs H and -1 vs T data led to the parameters indicated on Table 4. As in the case of 1, the Raman process is dominant above approximately 3 K (Figure S15 right).
If the absence of maxima above 2 K in the M vs. T plots of 2 and 3 were due,
as indicated above, to fast QTM promoted by intermolecular interactions, the magnetic diluted counterparts of 2 and 3 could suppress these interactions and consequently to active SIM behavior. Taking this into consideration, we have prepared the diluted versions of complexes 2 and 3. The structure of 2’ could be solved by X-ray single-crystal single-crystallography and the results indicate that this compound possesses the same structure as 2 with a Zn/Co = 1/11 molar ratio (XRPD of the bulk samples also supports the same structure for 2 and 2’; Figure S21). Although suitable crystals for X-ray crystallography could not be obtained for complex 3’, however its X-ray powder diffractogram clearly supports that this compound has the same structure as for the undiluted counterpart 3 (Figure S22).
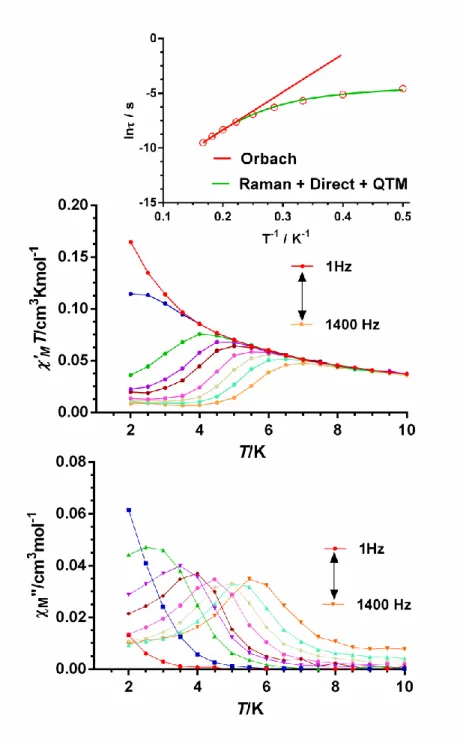
In contrast to complexes 2 and 3, their diluted counterparts 2’ and 3’ present slow relaxation of the magnetization under an applied field of 1000 Oe, with maxima in the M vs T plot in the ranges 3.4 K (200 Hz)-7.4 K (10000 Hz) and 2.5 K (50 Hz)-5.5
K (1400 Hz), respectively (Figures 7 and Figure 8 and Figures S23-S26).Therefore, it is reasonable to conclude that the suppression of the intermolecular interactions by magnetic dilution actives the SIM behavior in these complexes. It is worth noting that several recent experimental studies have highlighted the important role played by intermolecular interactions in the magnetization relaxation process of transition metal based SIMs.40 Nevertheless, as far as we know, 2 and 3 represent the first examples of transition metal complexes that do not present slow relaxation of the magnetization in the presence of applied magnetic field and, however, exhibit field induced slow relaxation of the magnetization by a further magnetic dilution. It should be noted magnetic dilution alone without applying magnetic field does not trigger the slow relaxation process.
The fit of the ac susceptibility data for 2’ and 3’ to the Debye model allowed for the extraction of values at different temperatures (Figure S23 and S25, respectively), which were used to construct the Arrhenius plots (Figure7 and Figure8, inset). From the high temperature linear region of these plots, the following relaxation parameters were obtained Ueff =33.2(4) K and a τ0 value of 2.5·10-7 s for 2’ and Ueff =34.6(9) K and a τ0 value of 2.3·10-7 s. for 3’. As for 1, the extracted Ueff values for these compounds are also much lower than values calculated from ab initio methods and extracted from magnetic measurements. Therefore, the relaxation cannot take place via a thermally activated Orbach process but via direct and Raman processes. In view of this, the temperature dependence of -1 for 2’ and 3’ were fitted with equation 2 (inset figures 7 and 8, respectively) using the parameters extracted from the fit of the field dependence of -1 to equation 1 (See Figures S27 and S28, respectively), affording the parameters gathered on Table 4. As for 1, the fits show (Figure S29 and S30, respectively) the
dominance the Raman process above approximately 3 K, whereas below this temperature the QTM is the main relaxation process for 3’.
Figure7.Temperature dependence of the in-phase (middle) and out-of-phase components (bottom) of the ac susceptibility at different frequencies 2’ (Dy/Y 1:10) measured under a 1000 Oe applied dc field. Solid lines are only guides for the eyes. Arrhenius plot (top inset).The green line represents the best fit to a direct plus Raman relaxation process.
As indicated elsewhere, theoretical calculations have shown that six-coordinated CoII complexes with trigonal prismatic and octahedral geometries should exhibit D < 0 and D > 0 values, respectively.11a Experimental results confirm these calculations, as all the CoII based SIMs with distorted octahedral geometries reported so far exhibit invariably positive values of the magnetic anisotropy (Table S5). It should be noted that D and E values derived from magnetization and susceptibility data are usually not very accurate because either the Hamiltonian used to model the data is not appropriate (ZFS with effective S =3/2 model is often used for complexes with actual first order SOC) or D is too high as to use the temperature dependence of magnetization vs field plots to extract accurate magnetic anisotropy parameters. Moreover, in some cases negative and positive D values lead to similar quality fits of the magnetic data. Therefore, to know the magnitude and sign of D in six-coordinated Co(II) based SIMs it is mandatory to combine several techniques. Thus, besides dc magnetic measurements (easier to access), direct techniques to determine the magnitude of , such as inelastic neutron diffraction (INS) and FD-FT THz-EPR MDS spectroscopy, as well as HFEPR to find out the sign of D and the E/D ratio should be used. Theoretical calculations can be exploited to support experimental results. As can be observed in Table S5 this protocol, including direct techniques, has been only employed for complexes [Co(-L)(-OAc)(NO3)2] and 3. If direct techniques for extracting the magnitude of could not be used because of their limited access, then a combination of magnetic, HFEPR and theoretical calculations would be obligatory to achieve reliable values of D and E Finally, it would be advisable in all cases to use magnetic diluted complexes to eventually suppress intermolecular magnetic interactions, which could partly of fully quench slow relaxation of the magnetization and therefore to hide the SIM behaviour.
Figure 8. Temperature dependence of the in-phase (middle) and out-of-phase
components (bottom) of the ac susceptibility at different frequencies 3’ (Dy/Y 1:10) measured under a 1000 Oe applied dc field. Solid lines are only guides for the eyes. Arrhenius plot (top inset).The green line represents the best fit to a direct plus Raman relaxation process.
Financial support from Ministerio de Economía y Competitividad (MINECO) for Project CTQ2014-56312-P, the Junta de Andalucía (FQM-195 and the Project of excellence P11-FQM-7756), the University of Granada.M.A. P. thanks to MINECO for a Juan de la Cierva Incorporation contract (IJCI-2014-19485). J.N. acknowledge the Deutsche Forschungsgemeinschaftfor a Research Fellowship (grant no. NE 2064/1-1 FOR).
References
1.-(a) Molecular NanomagnetsGatteschi, D.;Sessoli, R.; Villain, J.; Oxford University
Press, Oxford, 2006. (b) Molecular Magnets: Physics and Applications, Ed.Bartolomé, J.; Luis, F.; Fernández, J. F.; Springer-Verlag, Berlin-Heidelberg, 2014.(c) Molecular
Nanomagnets and Related Phenomena, Ed. Gao, S;Structure and Bonding,
Springer-Verlag, Berlin-Heidelberg, vol. 164, 2015.
2.- (a) Bogani L.; Wernsdorfer, W.; Molecular spintronics using single-molecule magnets. Nat. Mat., 2008, 7, 179-186; (b) Vincent, R.;Klyatskaya, S.; Ruben, M; Wernsdorfer, W.;Balestro, F.; Electronic read-out of a single nuclear spin using a molecular spin transistor. Nature,2012, 488, 357-360; (c) Ganzhorn, M.;Klyatskaya, S.; Ruben, M.;Wernsdorfer, W.; Strong spin–phonon coupling between a single-molecule magnet and a carbon nanotube nanoelectromechanical system. Nature Nanotech., 2013, 8, 165-169; (d) Jenkins, M.;Hümmer, T.;Martínez-Pérez, M. J.;García-Ripoll, J.;Zueco D.; F. Luis, F; Coupling single-molecule magnets to quantum circuits. New. J. Physics, 2013, 15, 095007. (e) Dediu, V. A.;Hueso, L. E.;Bergenti I.;Taliani, C.;Spin routes in organic semiconductors. Nat. Mater., 2009, 8, 707–716. (f) Prezioso, M.;Riminucci, A.;Graziosi, P.;Bergenti, I.;Rakshit, R.;Cecchini, R.;Vianelli, A.; F. Borgatti, F.; Haag, N.; Willis, M.; Drew, A. J.;Gillin W. P.;Dediu, V. A.;A Single-Device Universal Logic Gate Based on a Magnetically Enhanced Memristor.Adv. Mater., 2013, 25, 534–538. (g) Mannini, M.;Pineider, F.;Danieli, C.;Totti, F.;Sorace, L.;Sainctavit, Ph.;.Arrio, M. A.; Otero, E.; Joly, L.; Cezar, J. C.;Cornia A.;Sessoli, R.;Quantum tunnelling of the magnetization in a monolayer of oriented single-molecule magnets.Nature, 2010, 468, 417–421.(h) Thiele, S.; Balestro, F.; Ballou, R.; Klyatskaya, S.; Ruben, M.; Wernsdorfer, W.; Electrically driven nuclear spin resonance in single-molecule magnets.Science 2014, 344, 1135−1138.
3.-(a) Rocha, A. R.; García-Suárez, V. M.; Bailey, S. W.; Lambert, C. J.; Ferrerand J.; Sanvito, S.; Towards molecular spintronics. Nat. Mater., 2005, 4, 335-339; (b) Affronte, M;Molecular Nanomagnets for information technologies. J. Mater. Chem., 2009, 19, 1731-1737.
4.-R. Sessoli, R. ;Boulon, M. E. ;Caneschi, A ;Mannini, M ; Poggini, L. ; Wilhelm, F ; Rogalev, A. ; Strong magneto-chiral dichroism in a paramagnetic molecular helix observed by hard X-rays. Nat. Phys., 2015,11, 69-74.
5.-(a) Leuenberger M. N.; Loss, D.; Quantum computing in molecular magnets.Nature, 2001, 410, 789-793; (b) Ardavan, A.; Rival, O.; Morton, J. J. L.; Blundell, S. J.;Tyryshkin, A. M.;Timco, G. A.;Winpenny, R. P. A.;Will Spin-Relaxation Times in Molecular Magnets Permit Quantum Information Processing?Phys. Rev. Lett., 2007, 98, 057201; (c) Stamp P. C. E.;Gaita-Ariño, A.;Spin-based quantum computers made by chemistry: hows and whys.J. Mater. Chem., 2009, 19, 1718-1730; (d) Martínez-Pérez, M. J.; Cardona-Serra, S.; Schlegel, C.; Moro, F.; Alonso, P.J.; Prima-García, H.; Clemente-Juan, J. M.;Evangelisti, M.;Gaita-Ariño, A.;Sesé, J.; Van Slageren, J.; Coronado E.; Luis, F.;Gd-Based Single-Ion Magnets with Tunable Magnetic Anisotropy: Molecular Design of Spin Qubits.Phys. Rev. Lett., 2012, 108, 247213.
6.-Ayuk, M. A.; Hewitt, I. J.;Mareacre, V.;Clérac, R.; Wernsdorfer, W.; Anson, C.; Powell, A. K.;A Ferromagnetically Coupled Mn19 Aggregate with a Record S=83/2 Ground Spin State. Angew. Chem. Int. Ed. 2006, 45, 4926 – 4929.
7.-a) Neese, F.;Pantazis, D. A.;What is not required to make a single molecule magnet.
Faraday Discuss., 2011, 148, 229-238; b)Waldmann, O.;A Criterion for the
Anisotropy Barrier in Single-Molecule Magnets.Inorg. Chem. 2007, 46, 10035-10037.
8.- a) Tang, J.; Zhang, P; Lanthanide Single Molecule Magnets, Springer-Verlag Berlin Heidelberg 2015.(b) Frost, J. M.; Harriman, K. L. M.; Murugesu, M. The rise of 3-d single-ion magnets in molecular magnetism: towards materials from molecules? Chem. Sci. 2016, 7, 2470−2491. (c) Bar, A. K.; Pichon, C.; Sutter, J.-P.; Magnetic anisotropy in two- to eight-coordinated transition−metal complexes: Recent developments in molecular magnetism. Coord. Chem. Rev. 2016, 308, 346−380. (d) Craig, G. A.; Murrie, M. 3d single-ion magnets. Chem. Soc. Rev. 2015, 44, 2135− 2147. (e)
Gómez-Coca, S.; Aravena, D.; Morales, R.; Ruiz, E.; Largemagnetic anisotropy in mononuclear metal complexes. Coord. Chem.Rev. 2015, 289-290, 379−392.
9.- Gómez-Coca, S.; Urtizberea, A.; Cremades, E.; Alonso, P. J.;Camón, A.; Ruiz, E.; Luis, F. Origin of slow magnetic relaxation in Kramers ions with non-uniaxial anisotropy. Nat. Commun. 2014, 5,4300
10.- Colacio, E.; Ruiz, J.; Ruiz, E.; Cremades, E.; Krzystek, J.; Carretta,S.; Cano, J.; Guidi, T.; Wernsdorfer, W.; Brechin, E. K. Slow magneticrelaxation in a Co(II)-Y(III) single-ion magnet with positive axial zerofieldsplitting. Angew. Chem., Int. Ed. 2013, 52, 9130−9134.
11.-(a) Gómez-Coca, S.; Cremades, E.; Aliaga-Alcalde, N.; Ruiz,E. Mononuclear single-molecule magnets: Tailoring the magneticanisotropy of first-row transition-metalcomplexes. J. Am. Chem. Soc.2013, 135, 7010−7018, (b) Zhang,Y.-Z., Gómez-Coca,S , Brown,A. J.. Saber, M. R., Zhang, X., Dunbar K.R. Trigonal antiprismatic Co(II) single molecule magnets with large uniaxial anisotropies: importance of Raman and tunneling mechanisms, Chem. Sci., 2016, 7, 6519-6527. (c) Pavlov, Alexander A.;Nelyubina, Yulia V.;Kats,Svitlana V.;Penkova,Larysa V.;Efimov, Nikolay N.; Dmitrienko,Artem O.;Vologzhanina, Anna V.;Belov, Alexander S.;Voloshin, Yan Z.; Novikov, Valentin V.;Polymorphism in a Cobalt-Based Single-Ion Magnet Tuning Its Barrier to Magnetization Relaxation, J. Phys. Chem. Lett. 2016, 7, 4111−4116, (d) Novikov, V. V.; Pavlov, A. A.; Nelyubina, Y. V.; Boulon, M.-E.; Varzatskii, O. A.; Voloshin, Y. Z.; Winpenny, R. E. P. A Trigonal Prismatic Mononuclear Cobalt(II) Complex Showing Single-Molecule Magnet Behavior. J. Am. Chem. Soc. 2015, 137, 9792−9795. (e) Zhu,Yaun-Yuan;Zhang, Yi-Quan; Yin, Ting-Ting;Gao, Chen;Wang, Bing-Wu;Gao, Song; A Family of CoIICoIII3 Single-Ion Magnets with Zero-Field
SlowMagnetic Relaxation: Fine Tuning of Energy Barrier by Remote Substituent and Counter Cation, Inorg. Chem. 2015, 54, 5475−5486.
12.- (a)Sheng Zhang, Xiangyu Liu, Bin Liu, Zhengqiang Xia, Weitao Wang, Qi Yang,HongshanKe, Qing Wei, Gang Xie, Sanping Chen, Shengli Gao,3D Co(II, III) mixed-valence metal-organic framework affordingfield-induced slow magnetic relaxation. Sci. China. Chem., 2015, 58, 1032–1038.(b) Świtlicka-Olszewska, A.; Palion-Gazda, J.; Klemens, T.; Machura,B.; Vallejo, J.; Cano, J.; Lloret, F.; Julve, M. Single-ion magnet behaviourin mononuclear and two-dimensional dicyanamide-containing cobalt-(II) complexes. Dalton Trans. 2016, 45, 10181−10193. (c) Vallejo, J.; Castro, I.; Ruiz-García, R.; Cano, J.; Julve, M.; Lloret, F.; De Munno, G.; Wernsdorfer, W.; Pardo, E. Field-induced slowmagnetic relaxation in a six-coordinate mononuclear cobalt(II) complexwith a positive anisotropy. J. Am. Chem. Soc. 2012, 134, 15704−15707. (d) Palion-Gazda, J.; Klemens, T.; Machura, B.; Vallejo, J.; Lloret, F.; Julve, M. Single ion magnet behaviour in a two-dimensional network of dicyanamide-bridged cobalt(II) ions. Dalton Trans. 2015, 44, 2989−2992. (e) Vallejo, Julia; Fortea-Pérez,Francisco R.; Pardo, Emilio;Benmansour,Samia; Castro, Isabel; Krzystek, J.;Armentano, Donatella; Cano, Joan; Guest-dependent single-ion magnet behaviour ina cobalt(II) metal–organic framework, Chem. Sci., 2016, 7, 2286–2293.(f) Zhu, Y. Y.; Zhu, M. S.; Yin, T. T.; Meng, Y. S.; Wu, Z. Q.; Zhang, Y.Q.; Gao, S. Cobalt(II) coordination polymer exhibiting single-ionmagnet-type field-induced slow relaxation behavior. Inorg. Chem. 2015,54, 3716−3718.(g) Nedelko, N.; Kornowicz, A.; Justyniak, I.; Aleshkevych, P.; Prochowicz, D.; Krupiński, P.; Dorosh, O.; Ślawska- Waniewska, A.; Lewiński, J. Supramolecular Control over MolecularMagnetic Materials: γ-Cyclodextrin-Templated Grid of Cobalt(II)Single-Ion Magnets. Inorg. Chem. 2014, 53, 12870−12876.(h) Ion, A. E.; Nica, S.; Madalan, A. M.; Shova, S.; Vallejo, J.; Julve, M.; Lloret, F.; Andruh, M. Two-DimensionalCoordination Polymers Constructed Using, Simultaneously, Linear and Angular Spacers and Cobalt(II) Nodes. New Examples of Networks of Single-Ion Magnets. Inorg. Chem. 2015, 54, 16−18.(i) Wang, Yu-Ling;Chen, Lin;Liu,Cai-Ming;Zhang, Yi-Quan;Yin, Shun-Gao; Liu, Qing-Yan;Field-Induced Slow Magnetic Relaxation and Gas Adsorption Properties of a Bifunctional Cobalt(II) Compound, Inorg. Chem. 2015, 54, 11362−11368. (j)Zhu, Y.-Y.; Yin, T.-T.; Liu, C.-W.; Gao, C.; Wu, Z.-Q.; Zhang, Y.-Q.; Wang, B.-W.; Gao, S. Field-induced