UNIVERSITÀ DI FOGGIA
Dipartimento di Scienze Agrarie, degli Alimenti e
dell'Ambiente
Doctoral Thesis in
Management of Innovation in the Agricultural and Food Systems of the Mediterranean
Region
– XXXI cycle –
Innovative and non-destructive technologies to evaluate
quality of rocket leaves for ready to eat salads
Candidate:
Muhammad Mudassir Arif Chaudhry
Tutor:
Dr. Maria Luisa Amodio
i
UNIVERSITÀ DI FOGGIA
Dipartimento di Scienze Agrarie, degli Alimenti e
dell'Ambiente
Doctoral Thesis in
Management of Innovation in the Agricultural and Food Systems of the Mediterranean
Region
– XXXI cycle –
Innovative and non-destructive technologies to evaluate
quality of rocket leaves for ready to eat salads
Candidate:
Muhammad Mudassir Arif Chaudhry
Tutor:
Dr. Maria Luisa Amodio
iii
UNIVERSITÀ DI FOGGIA
Dipartimento di Scienze Agrarie, degli Alimenti e
dell'Ambiente
Doctoral Program in Management of Innovation in the Agricultural and Food Systems
of the Mediterranean Region
– XXXI cycle –
Doctoral thesis on “Innovative and non-destructive technologies to evaluate quality
of rocket leaves for ready to eat salads” discussed at the Universita di Foggia, 25
June, 2019
Candidate:
Muhammad Mudassir Arif Chaudhry
Tutor:
Dr. Maria Luisa Amodio (Universita di Foggia, Italy)
Committee members:
Prof. Antonio Ippolito (Università degli Studi “Aldo Moro” di Bari)
Prof. Stella Novella (Università degli Studi della Basilicata)
v
ACKNOWLEDGEMENT
I pay my deepest gratitude to the God Almighty who is the entire source of all knowledge and wisdom bestowed to mankind and who granted me the strength and the composure to complete my research and thesis.
First and foremost, I feel utmost pleasure to express my heartiest gratitude at deep sense of obligation to my supervisor Dr. Maria Luisa Amodio, Department of the Science of Agriculture, Food and Environment (SAFE), Università degli studi di Foggia, Italy under whose dynamic supervision, vital instructions, skillful guidance, constructive criticism, affection and kind sympathetic attitude, I am able to complete this difficult task quite easily.
I offer my sincere appreciation and thanks on the contribution of Prof. Giancarlo Colelli, Department of the Science of Agriculture, Food and Environment (SAFE), Università degli studi di Foggia Italy, who can never be forgotten to create comfortable and friendly behavior and for his valuable suggestions and guidance for completion of my research work.
I cannot forget my sincere friends who helped me at the first day in my university as well as throughout my degree program, José Manuel Amigo Rubio, Associated Professor, Department of Food Science, University of Copenhagen. I am very thankful to my friends for their support, cooperation and guidance, prayers, encouragement and love during all my study period, whenever I need May Almighty Allah bless all above mentioned persons and reward them the best returns for their piousness (Ameen).
Finally, I must express my very deep gratefulness to my parents, Brothers, Sisters and to my teachers for providing me with trustworthy support and unceasing encouragement during my years of study and through my research work. This accomplishment would not have been possible without them.
Muhammad Mudassir Arif Chaudhry,
PhD Course in Managing the Changes in Agricultural and Food Systems in the Mediterranean Area Dipartimento di Scienze Agrarie, Degli Alimenti e Dell'Ambiente Universita di Foggia
vii
Contents
PART I: INTRODUCTION... 1
EXTENDED ABSTRACT ... 2
Chapter 1 ... 5
THE USE OF NON DESTRUCTIVE TECHNIQUES TO ASSESS NUTRITIONAL CONTENT OF FRUITS AND VEGETABLE ... 5
Reference: Amodio, Maria L., Muhammad MA Chaudhry, and Giancarlo Colelli. "The Use of Non‐destructive Techniques to Assess the Nutritional Content of Fruits and Vegetables." Fruit and Vegetable Phytochemicals: Chemistry and Human Health, 2nd Edition (2017): 763-780. 1. INTRODUCTION ... 5
2. NON-DESTRUCTIVE TECHNIQUES FOR QUALITY EVALUATION OF FRUITS AND VEGETABLES .... 6
2.1. VIS-NIR spectroscopy ... 6
2.2 Hyperspectral imaging ... 9
2.3 Chemiometric tools ... 12
3. PREDICTION OF NUTRITIONAL CONTENT OF FRUITS AND VEGETABLES ... 18
3.1 Prediction of Water content ... 19
3.2 Soluble solids, acidity and assessment of the maturity stage ... 20
3.3 Macro and micronutrients: vitamins, phenolic, antioxidant activity ... 26
4. CONCLUSIONS ... 30
Chapter 2 ... 40
IMAGE ANALYSIS ... 40
Submitted for publication in Advances in Non-invasive Food Analysis CRC Press | Taylor & Francis Group 1. NEED FOR IMAGE ANALYSIS ... 40
2. IMAGE ACQUISITION METHODS IN FOOD TECHNOLOGY ... 42
2.1 Relationship between images, spectroscopy and hyperspectral imaging ... 42
viii
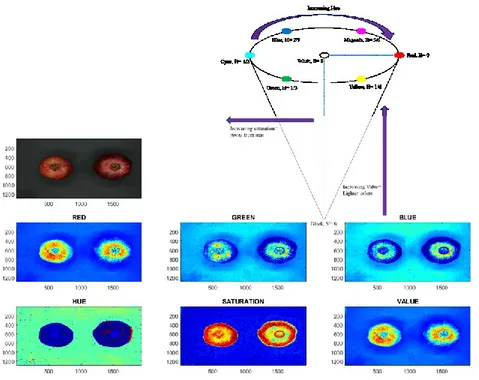
2.3 RGB Imaging ... 46
2.4 Hyperspectral Imaging, Hyperspectral Data and Multispectral Imaging... 51
2.5 Calibration of Raw Hyperspectral Images ... 57
2.6 Image Segmentation ... 58
2.7 Data Exploration and Preprocessing ... 61
2.8 Prediction and classification modelling approaches ... 64
3. APPLICATIONS ... 67
Chapter 3 ... 76
FRESH-CUT ROCKET QUALITY AND SHELF-LIFE: STATE OF THE ART ... 76
1. INTRODUCTION ... 76
2. NUTRITIONAL ATTRIBUTES OF ROCKET LEAVES ... 77
2.1. Carotenoids ... 77
2.2. Vitamin C ... 78
2.3 Phenolic Compounds ... 79
2.4 Glucosinolates ... 79
3. FRESH-CUT ROCKET LEAVES: QUALITY AND SHELF-LIFE ... 80
REFERENCES ... 85
PART II: EXPERIMENTAL ... 91
OBJECTIVES ... 92
Chapter 4 ... 93
HYPERSPECTRAL IMAGING AND MULTIVARIATE ACCELERATED SHELF LIFE TESTING (MASLT) APPROACH FOR DETERMINING SHELF LIFE OF ROCKET LEAVES ... 93
Reference: Chaudhry, Muahmmad MA, et al. "Hyperspectral imaging and multivariate accelerated shelf life testing (MASLT) approach for determining shelf life of rocket leaves." Journal of food engineering 238 (2018): 122-133. 1. INTRODUCTION ... 94
ix
2.1 Experimental design and spectral acquisition ... 96
2.2 Sensory analysis ... 98
2.3 Multivariate Accelerated Shelf Life Testing (MALST) Approach ... 98
2.4 Partial Least squares regression (PLSR) ... 100
3. RESULTS AND DISCUSSION ... 101
3.1 Principal Component Analysis and PC relationship with time ... 101
3.2 Multivariate modeling and shelf life estimation ... 106
3.3 PLSR for the estimation of days of storage and shelf life ... 111
4. CONCLUSIONS ... 116
Chapter 5 ... 125
SPECTRAL FINGERPRINTING AND HYPERSPECTRAL IMAGING FOR THE PREDICTIONAND MAPPING OF PHYTONUTRIENTS IN MINIMALLY PROCESSED ROCKET LEAVES (Diplotaxis tenuifolia) DURING STORAGE... 125
Submitted for publication in Food Chemistry 1. INTRODUCTION ... 126
2. MATERIALS AND METHODS ... 130
2.1. Experimental design and spectral acquisition ... 130
2.2 Chemical analysis ... 130
2.3. Partial Least Squares Regression (PLSR) ... 131
3. RESULTS AND DISCUSSION ... 132
4. CONCLUSIONS ... 141
Chapter 6 ... 162
POTENTIALITY OF NEAR INFRARED SPECTROSCOPY FOR ROCKET LEAVES (Diplitaxis tenufolia) CHARACTERIZATION: RAW MATERIAL DISCRIMINATION AND PHYTONUTRIENT MODELING ... 162
1. INTRODUCTION ... 163
x
2.1 Experimental design and spectral acquisition ... 165
2.2 Chemical Analysis ... 166
2.3 Multivariate analysis ... 167
3. RESULTS AND DISCUSSION ... 167
3.1 Raw material classification ... 167
3.2 Global Modelling of Phytonutrients ... 173
4. CONCLUSIONS ... 179
Chapter 7 ... 184
POTENTIALITY OF VIS-NIR SPECTROSCOPY FOR THE SHELF LIFE PREDICTION OF ROCKET LEAVES (Diplotaxis tenufolia) BASED ON RAW MATERIAL QUALITY ... 184
1. INTRODUCTION ... 185
2. MATERIALS AND METHODS ... 187
2.1 Experimental design and spectral acquisition ... 187
2.2 Sensorial and Physico-Chemical Analysis ... 188
2.3 Multivariate analysis ... 189
3. RESULTS AND DISCUSSION ... 190
3.1 Raw material characterization ... 190
3.2 Shelf-life prediction ... 194
4. CONCLUSIONS ... 197
REFERENCES ... 198
1
2
EXTENDED ABSTRACT
‘Rocket’ is a collective name to indicate many species of green leaves belonging to Brassicacea family and are significantly consumed in the Mediterranean countries either as stand-alone salads or mixed with other vegetables. They are well known for their pungent smell, bitter flavor and high nutritional value. Rocket leaves are commercially grown as perennial and annual species, the former known as perennial wall rocket also known as wild rocket (Diplotaxis tenufolia(L.) DC.) and the latter named annual garden rocket (Eruca satvia Mill.). The Diplotaxis tenufolia plant can achieve a height of 80 centimeters (cm) and is characterized by a tap root and lengthy leaves. A typical leaf of Diplotaxis tenufolia is fleshy, oblong and deeply lobed, possessing sharp apexes. On the other hand, Eruca satvia Mill. grows to achieve a height of 40 cm possessing lyrate-pinnatifid leaves, having an enlarged terminal lobe and smaller lateral lobes with a rosette shaped arrangement of the leaves. Eruca satvia Mill. species as compared to the
Diplotaxis tenufolia possesses a thin tap root and is characterized by a rigid unbranched stem. Both the
species manifest similar morphological and nutritive aspects possessing a characteristic bitter taste based on the account of glucosinolates present.
In the modern era, the consumer awareness regarding food safety, origins of the produce, nutritional value and demand for minimally processed fresh produce has led the food industry to explore rapid, reliable and cost effective methods for the evaluation of food products and their shelf-life since the conventional destructive analysis methods are time consuming, expensive, targeted and labor intensive. In this regard, non-destructive methods are gaining significant popularity which are assisting the food industry for the early fruits defect detection, fruits and vegetable classification on the basis of variety, maturity stage and origin and for the prediction of main internal constituents, mainly soluble solids and acids, and physical properties like firmness. On the industrial scale a significant weightage is given towards achieving fresh produce with superior quality in terms of vitamins, antioxidant activity, phenols and secondary metabolites.
Rising concerns regarding the nutritional composition led many research works to evaluate the feasibility of the spectral profiles in the visible near infrared range (Vis-NIR), near infrared range (NIR) and hyperspectral images (HSI) for prediction and mapping of desired compounds in fresh produce. It is important to mention that non-destructive techniques cannot completely replace the conventional
3
methods but can serve to assist these techniques saving time, expenses and labor. On the other hand, the non-destructive methods need no sample preparation once the model is developed making the prediction process quick. In this research work non-destructive techniques have been illuminated with respect to their potentiality in rocket leaves with special emphasis on hyperspectral imaging for the quality assessment of the fresh-cut rocket leaves accompanied by a basic introduction of the non-destructive image analysis techniques.
In the first research work the feasibility of using spectral profiles for the estimation of the shelf life of the rocket leaves was evaluated using a multivariate accelerated shelf life testing (MASLT) approach. Spectral changes over time were modeled by using principal component analysis (PCA) and as variation to the conventional method, partial least squares (PLS) method. Kinetic charts were built fitting the first principle component (PC1) and the first latent variable (LV1) scores versus time. In both cases, the kinetics were described by a first order reaction, and the model performance was evaluated by the R2 values which ranged between 0.73 to 0.95 for samples stored at three different temperatures, one of them being the market temperature while the rest were categorized as accelerated temperatures which are usually higher than the market temperature. The cut-off value was calculated by judging the unacceptable spectra of samples at the accelerated temperature, as a result of which the shelf life of rocket leaves was estimated using the MASLT approach. The shelf life estimation was done using PCA based MASLT conventionally used as well as using a newly introduced methodology i.e. PLS based MASLT yielding encouraging results in both cases particularly in case of the PLS based MASLT.
On the other hand, since the literature regarding quality evaluation of rocket leaves or any other leafy vegetables over time shows that the potential of hyperspectral imaging in the visible and near infrared regions has not been investigated pursing the aim of prediction and mapping of internal constituents. Hence hyperspectral imaging data was evaluated employing Partial Least Squares regression (PLSR) for the prediction of Vitamin C, ascorbic acid (AA), dehydroascorbic acid (DHAA), antioxidant activity and phenols in wild rocket (Diplotaxis tenuifolia) over a storage span of 12 days at 5oC. Hyperspectral images of the wild rocket leaves were acquired in the Vis-NIR (400-1000nm) and the NIR (900-1700nm) ranges using different data pretreatments and wavelength selection techniques. The model reliability was checked by the root mean square error (RMSE) and R2 values. Among the predicted parameters Vitamin
4
C, AA, antioxidant activity and phenols were predicted satisfactorily in the NIR range. The prediction maps for the parameters were calculated to follow the changes over the storage period yielding more reliable results in the NIR range. All the results indicated that hyperspectral imaging combined with multivariate data possess the capability to provide reliable information regarding the shelf life estimation of the rocket leaves as well as for the prediction and mapping of the internal constituents.
5
Chapter 1
THE USE OF NON DESTRUCTIVE TECHNIQUES TO ASSESS
NUTRITIONAL CONTENT OF FRUITS AND VEGETABLE
Maria L. Amodio, Muhammad M. A. Chaudhry, Giancarlo Colelli
Department of the Science of Agriculture, Food, and Environment, University of Foggia, Via Napoli 25, 71100 Foggia (Italy)
1. INTRODUCTION
The use of non-destructive methods is already widely developed for the early detection of fruit defects, for the classification of fruits and vegetable based on variety, maturity stage and origin and for the prediction of main internal constituents, mainly soluble solids and acids, and physical properties like firmness. In the last year, due to the increasing interest in nutritional compounds, different researches were conducted to study the feasibility of using non-destructive methods, mainly Middle, Near and Short Wavelength Infrared Spectroscopy for the prediction of nutritional compounds in fruits and vegetable. Among different classes of bioactive compounds, prediction models were developed for phenolics including anthocyanins, flavonoids and antioxidant activity in whole fruits and vegetables or in fruit extracts, and vitamin C or dietary fiber content in wheat. The advantage of using spectroscopic techniques even in the case in which better results are obtained preparing tissue extracts is still considerable, since the reference analytical methods normally require expensive equipment, people expertise and are time consuming. The latter may be the case of bigger fruits as summer squash or melons where the presence of a thick peel make difficult the internal prediction of nutritional constituents. On the other side, referring to compounds very sensitive to thermal or light degradation, when non-destructive techniques are applied on whole fruits and vegetables, the problem of the oxidation related to the process of extraction is over passed. Sample preparation time in this case greatly decreases and the requested time for the analysis is very short once a predictive model has been developed.
6
2. NON-DESTRUCTIVE TECHNIQUES FOR QUALITY EVALUATION OF FRUITS AND VEGETABLES
2.1. VIS-NIR spectroscopy
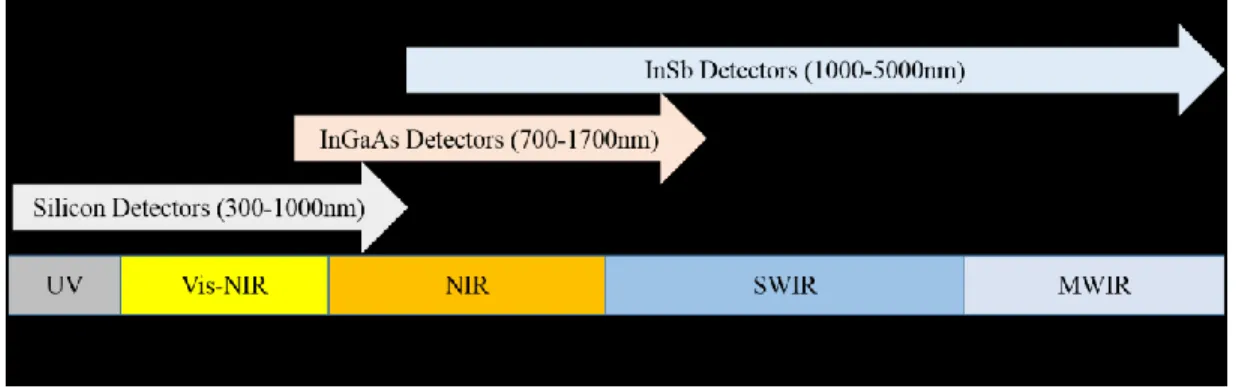
NIR spectroscopy is categorized among the simplest non-destructive techniques as it requires no sample preparation and permits several constituents to be measured simultaneously. NIR spectroscopy is based on the absorption of electromagnetic radiation in the wavelength range of 780–2500 nm (Huang et al., 2008). The sample is irradiated with a NIR source; as the irradiation passes through the sample, it gets absorbed and scattered causing a change in its spectral characteristics (McClure 2003; Cozzolino et al., 2006; Nicolai et al., 2007). This change is a function of the structure of the sample, the moisture content, the particle size, the temperature of the sample and, most importantly, of its chemical composition. The cell wall interfaces and suspended particles (mitochondria, chloroplasts and starch granules etc.) are one of the major causes of irradiation scattering in fruits and vegetables (McGlone et al., 1997; Lammertyn et al., 1998; Lammertyn et al., 2000; McGlone et al., 2002; Nicolai et al., 2007). Large sets of overtones and combination bands along with complex chemical composition result in highly convoluted NIR spectrum which, if properly elaborated, may allow to extract relevant information about the sample (Massart et al., 1988). The overtones can be considered as harmonics in which a series of absorptions are produced by every fundamental as a multiple of frequency. Factors such as tissue heterogeneity, instrumental noise, wavelength dependent scattering effects and ambient effects increase the complexity of the spectra.
To understand the concept of NIR one must be familiar with the phenomenon of energy absorption in the visible and mid-IR regions. The following Figure 1 shows the electromagnetic radiation spectrum of the visible, NIR and mid-IR region.
7
Frequency (Wave Numbers)
15000 12500 10000 7500 5000 4000 1000
Visible
Electronic Shift
Near Infrared
Overtone and combination bands
Mid Infrared
Fundamental Vibrational Bands
400 750 1000 1750 2000 2500 10000
Wavelength (nm)
Figure 1. Electromagnetic radiation spectrum of the visible, NIR and mid-IR region.
When the light energy and the material come into contact, energy is absorbed at resonant frequencies due to atomic and molecular interactions; the electrons absorb energy and jump from a lower to higher orbit, in the visible region; energy is absorbed in the mid-IR region at the resonant frequencies by the bounded molecules who vibrate in different directions due to different movements as stretching, bending and rotation. Chemical bonds such as C-C, C-H, C-N, C-O, N-H and O-H can be suitably characterized by using the mid-IR region, after the sample is prepared to get sufficient light through it. Absorbance in the NIR spectra mostly occur due to the O-H (water, alcohol), N-H (protein) and C-H (oils, fats, hydrocarbons) chemical bonds whereas also some other bonds exhibit overtones in the region. The part of radiation that is not absorbed by the sample is in part reflected or transmitted; thus, depending on the instrument design and on the sample structure different applications using reflectance, transflectance, transmittance, and interactance may be developed.
8
Figure 2). In case of the reflectance mode, the detector captures the light reflected from the surface of the material and this technique is mostly utilized to detect the external quality features of the sample such as shape, size, color, texture and defects. This mode is advantageous when less penetration is required, for example, if the chemical to be analyzed lies just beneath the peel as in case of anthocyanin in blueberries. Diffuse reflectance infrared Fourier transform spectroscopy is used for powder samples without preparation.
The transflectance mode is used for the measurement of spectra of very thin and clear samples whose characteristics are very different from that of fruits and vegetables. A demonstration of the transflectance phenomenon is given in the Figure 2.
In transmittance mode, the internal information of the sample is acquired; the detector is placed in the opposite direction with respect to the light source to capture the light transmitted through the sample, hence detecting the concentration of materials or internal defects in the sample (Schaare and Fraser 2000). The region of 800-1100nm in the spectrum is usually utilized for diffuse transmission measurement acquisition.
The light source and the detector are parallel to each other in interactance mode, enhancing its capability to detect deeper information of the sample with reduced surface effects. Interactance is preferred over transmittance due to the reason that it is less effected by thickness of the sample as compared to the latter for which a special set up is also required for preventing specular reflection to enter into the detector (Nicolai et al., 2007).
9
Figure 2: Examples of reflectance, transflectance, transmission and interactance configurations
2.2 Hyperspectral imaging
Hyperspectral imaging is a combination or integration of imaging and spectroscopic techniques for the quantitative prediction of physical and chemical characteristics of the food samples as well as their spatial distribution. Researchers working on the non-destructive analysis of food are interested in attaining spectral information, and spatial information, as to know a distribution of a quality attribute or of multi-constituents, or to detect small size objects not visible in the RGB. Out of these desired factors, spectroscopy if taken alone has the capacity to measure spectral and multi-constituent information only, whereas conventional imaging exclusively provides data regarding spatial information and detectability of objects with small size. Combined hyperspectral imaging serves to provide information of all the aforementioned factors simultaneously. The spectral measurement tells us ‘what’ is in the food sample, whereas, the image provides us the answer to the question ‘where’; the hyperspectral image provides us the entire picture, i.e. ‘what and where’ at the same time (Wu and Sun 2013).
Hyperspectral images consist of a stack of images of the same object at different spectral wavelength bands, known as multispectral imaging, hyperspectral imaging and ultra-spectral imaging, according to the considered number of wavelengths (spectral range and resolution) (Ariana and Lu 2008). A spectral cube is a three dimensional cube that contains spectral and spatial information simultaneously. The
10
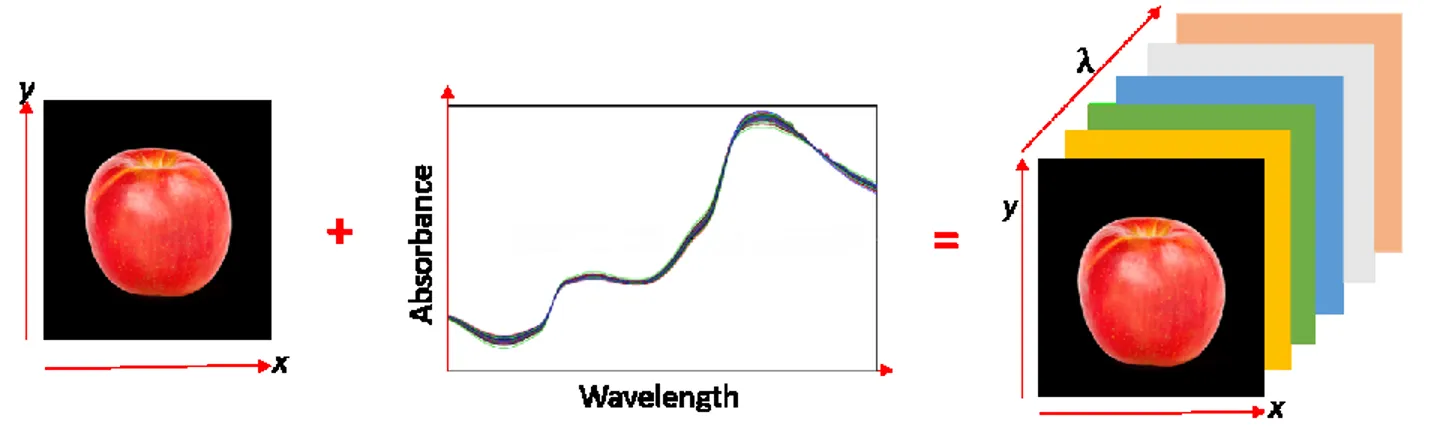
information of the wavelengths i.e. the spectral information, is contained in the form of voxels (vector pixels) and the spatial information exists in a two dimension-image of x rows and y columns Figure 3.
Figure 3. Example of hypercube showing the stack of λ images (dimension x x y).
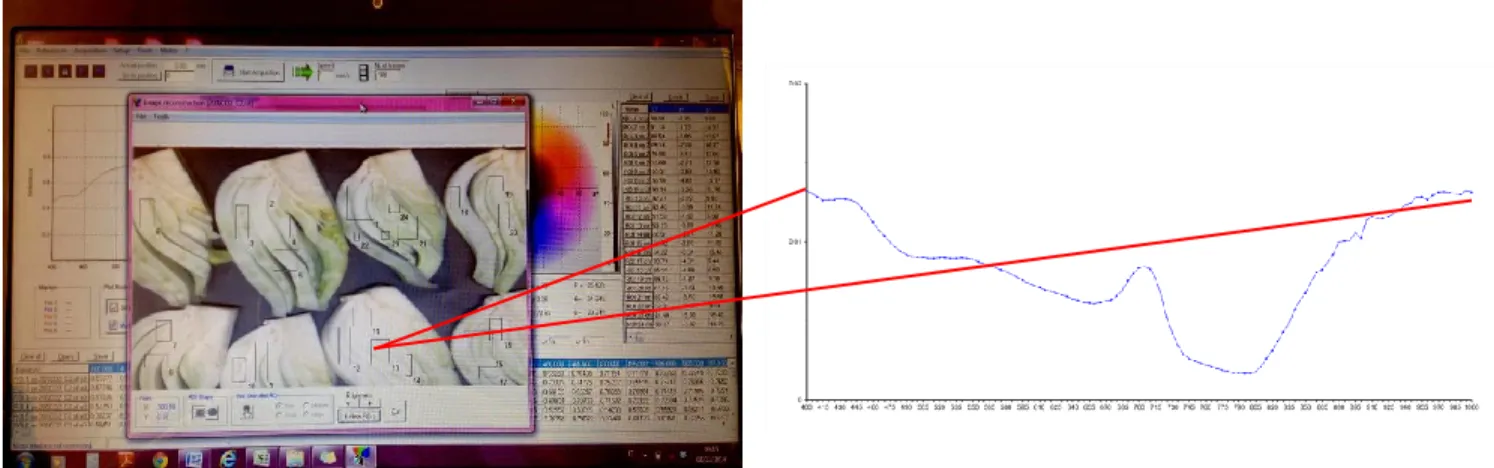
In this hypercube, each spectral pixel corresponds to a spectral signature (or spectrum) of the corresponding spatial region, recording the entire measured spectrum of the imaged spatial points (Figure 4). Therefore, the measured spectrum indicates the ability of the sample in absorbing or scattering the exciting light, representing the inherent chemical properties of a sample. As a result, the technology provides us with unprecedented detection capabilities, which otherwise cannot be achieved with either imaging or spectroscopy alone. Hyperspectral imaging techniques have received much attention for food quality and safety evaluation and inspection. Many approaches and applications have shown the usefulness of hyperspectral imaging in the food industry (Sun 2010).
11
Figure 4. Reconstructed hyperspectral image and representation of the spectra extracted by a region of interest (by Amodio et al., unpublished).
The imaging instruments used for the hyperspectral imaging consist of a light source, a wavelength dispersion device, area detector and then a storing device for further processing. The light sources are different depending upon the type of samples to be tested and can be recognized as halogen lamps, light emitting diodes (LEDs) and lasers. Halogen lamps are mostly used to illuminate the Vis-NIR and NIR spectral regions. The light emitting diodes are considered to be an excellent light source due to low cost, small size, low energy consumption, low heat generation, robustness and insensitivity to vibration. Lasers are also used as a light source due to the reason that they are directional monochromatic light sources which are mostly used for the purpose of excitation in the application of fluorescence and Raman spectroscopic measurements. The tunable light sources allow the direct area scanning to obtain both spectral and spatial information of sample by setting the wavelength dispersion device in the illumination light path instead of the imaging light path.
The wavelength dispersion devices contain filter wheels, imaging spectrographs, tunable filters, Fourier transform imaging spectrometers and single shot imagers. The wavelength dispersion devices disperse the broadband light into different wavelengths. The light is efficiently transmitted by the bandpass filters at a particular wavelength whereas the light at the other wavelengths is eliminated. An imaging spectrograph most commonly operates in the line scanning mode (Figure 5), instantaneously disperses the broadband light into different wavelengths using a diffraction grating and generates a
12
spectrum for each point on the scanned line. Point scanning and area scanning are other examples of scanning mode (Figure 5). Detectors include charge coupled devices (CCD) detectors and complementary metal oxide semiconductor (CMOS) detectors. They quantify the intensity of the received light by converting the incident photons into the electrons (Wu and Sun 2013).
Figure 5. Types of scanning modality
Hyperspectral imaging technique has been used to detect defect and physiological disorders as bitter pit, bruises, surface defects and contaminations in apple fruits (Mehl et al., 2004; Peri et al., 2005; Xing et al., 2005;), and in pickling cucumber (Ariana and Lu 2010), for the citrus fruit inspection (Moltó et al., 2010.), to predict the sugar content distribution in melons (Sugiyama and Tsuta 2010), for measuring ripening of tomatoes (Polder and van der Heijden 2010), for quality evaluation of mushroom (Gowen et al., 2010.), to monitor ripening on banana (Rajkumar et al, 2012), to identify hidden bruise on kiwifruits and for many other applications requiring spatial information.
2.3 Chemiometric tools
13
their quality parameters as measured using a reference method. After the development and proper validation, the model can be used for further prediction of quality attributes of other unknown samples. The extraction of relevant information from the acquired spectra, requires a preliminary process to separate the chemical information from physical variations, obtained by applying mathematical pre-treatments of spectral signals. The spectroscopic signals usually contain ‘noise’ (unwanted effects) which may be due to instrumentation used for spectral acquisition, changes in various environmental factors and signal variations due to sample nature. The most commonly used pretreatments to remove scattering, are multiplicative scatter correction (MSC), Standard Normal Variate (SNV), and Detrend (DT) (Shenk and Westerhaus 1995; Heise and Winzen 2002; Naes et al., 2002; Nicolai et al., 2007) and derivatives (Savitzky and Golay 1964).
The next step is the development of a calibration equation to relate spectral to chemical features for the prediction of quality parameters of unknown samples (Williams and Sobering 1996; Guthrie et al., 2005; Guthire et al., 2006). This process involves regression techniques in addition to spectral pre-processing methods (Baardseth et al., 1996; Naes et al., 2002; McClure 2003; Cozzolino et al., 2006; Nicolai et al., 2007; Cozzolino et al., 2009).
The techniques used for this purpose include, Principal Component Analysis (PCA), linear regression methods for calibration development (Martens and Naes 1989; Burns and Ciurczak 2007) such as Multiple Linear Regression (MLR), the Principal Component Regression (PCR) and the Partial Least Squares (PLS) (Perez-Marin et al., 2007).
The Principal Component Analysis (PCA) is used to reduce the large multivariate data into limited number of independent factors (Buning-Pfaue 2003) providing information about the spectra population in terms of variables, sample distribution and abnormal sample detection. This technique is aimed to describe the maximum variability of the samples by reducing the information contained in all the variables to a limited number of principal components (PCs) which can be also used to detect sample outliers (samples with different spectral behavior).
Researchers prefer to involve controllable and easy-to-measure factors to elaborate, regulate, or predict the behavior of responses. MLR is used to convert data into information when the factors (variables) are in a small number having no significant redundancy (collinearity) and also possessing
14
good relationship to responses. If in some cases where the number of factors are too large i.e. larger than the number of observations, the MLR can give a model that fits the sample data well but will fail to predict the new data, a phenomenon known as overfitting. Among these large number of factors, there are only a few underlying factors that contribute to the variation in the response to a large extent. The purpose of the PLS is to extract these underlying factors, so that from these extracted factors (X-scores), the Y-scores can be predicted. The regression model is then simplified as the relationship is concentrated on the smallest possible number of underlying variables. PLS is, in fact, used when the number of variables (factors) is large and possess high collinearity, and when there is a need to take into account the reference value of the parameter for each sample along with the spectral information (Westerhaus et al., 2004). Here the emphasis is on the prediction of responses rather than understanding the underlying relationship between them. PLS regression can be easily extended to simultaneously predict several quality attributes. In this case the algorithm is called PLS2 (Naes et al., 2002).
Normally an internal validation (cross validation) procedure is applied to test the predictive ability of the PLS (Shenk and Westerhaus 1995). The collective calibration sample is divided into several sub-groups (depending on the number of samples); once the equation is developed each validation group is predicted by using the model built on the remaining groups. This procedure also prevents model overfitting (Williams and Norris 1987; Shenk and Westerhaus 1995), which would give poor results with external calibration.
In Figure 6 are shown the required steps to build a calibration model.
Fig. 6 Steps towards building a calibration model
The performance of the calibration model is then evaluated by comparing the following statistics as the standard error of calibration (SEC), the coefficient of determination between predicted and measured parameters (R2), the standard error of cross validation (SECV) and coefficient of determination for cross validation (r2) (Williams and Norris 1987). When a model is used for validation on external sample (test
Sample Selection Spectra Pre-processing Algorithm Selection Callibration & Validation Interpretation of results obtained
15
set), errors refer to prediction performances, namely standard error of prediction (SEP).
Despite all this information, it must be taken into consideration that errors are always associated to the chemiometric method and can be only partially reduced. These errors may be due to sampling, sample preparation, and instrumental noise. Sampling errors are not a function of the underlying process but they are the real errors which are significant cause of deviation in the measurements. The sample preparation errors can occur during the various stages of the chemical process and errors in all these stages are often called ‘uncertainty’. Instrumental noise is another type of error that occurs due to the measurement process or instrument because of the various factors influencing instruments such as the effect of fluctuating voltages on filters and lamps.
For hyperspectral imaging the same kind of approach is used, normally a preprocessing of the hypercube is followed by the processing (Amigo et al., 2013), as the following example describes the data processing to predict phenol distribution in table grapes. In the first operation, image hypercube needs to be pre-processed in terms of spatial and spectral direction to eliminate undesirable noise to the signals (Brereton 2007) due to non-chemical biases and reduce data set dimensions; this is normally performed by applying compression techniques and mathematical pre-treatments to the spectra (a second derivative in the example of Figure 7).
16
Figure 7. Example of spectra preprocessing: (A) raw spectra and (B) spectra after 2nd derivative transformation (by Amodio et al., unpublished).
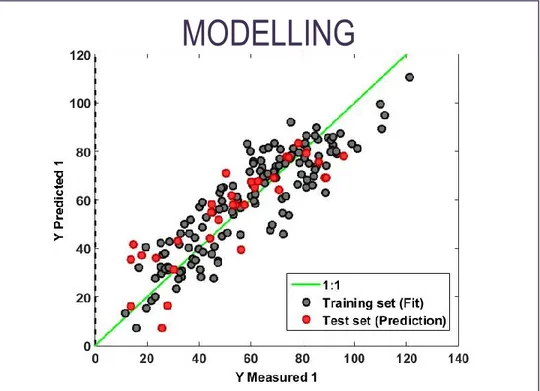
On transformed spectra a thresholding algorithm, normally based on a PCA, can be applied in order to extract the spectral information related to the pixels of the object (Figure 8). On these spectra after the preprocessing, multivariate methods can be applied depending on the scope of the study. In this example a quantitative model was applied, whereas qualitative models are alternatively used when a discrimination among samples is the objective of the image processing. A PLS model relating spectral information to reference values of phenols measured analytically was tested (Figure 9). These models can be applied to further samples, including also the image of the whole bunch, as shown in Figure 10 where the phenol content is represented in a color map from 100 (blue) to 200 mg of Gallic acid. Equivalent 100 g-1 (red).
PREPROCESSING
(A)
17
Figure 8. Example of image thresholding based on PCA (by Amodio et al., unpublished).
Figure 9. Example of output of a PLS model applied for prediction (by Amodio et al.,
THRESHOLDING
PC no. 2 20 40 60 80100120 20 40 60 80 100 120 140 PC no. 2 20 40 60 80100120 20 40 60 80 100 120 140 -3 -2 -1 0 1 2 3 4 5 6 7 0 100 200 300SELECT THE TRESHOLD -2 0 2 4 6 -2 0 2 4 6 original 20 40 60 80 100 120 20 40 60 80 100 120 140
False color with the selected area in green
20 40 60 80 100 120 20 40 60 80 100 120 140
MODELLING
18
unpublished).
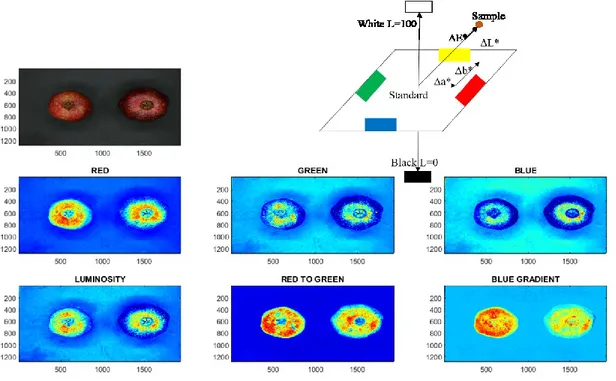
Figure 10. Distribution map of the phenol concentrations in the berries and in the stalk (by Amodio et al., unpublished).
3. PREDICTION OF NUTRITIONAL CONTENT OF FRUITS AND VEGETABLES
Near infrared (NIR) spectroscopy was used in the science of agriculture for the first time by Norris in 1964 for measurement of grain moisture content. Since then this technique has been successfully utilized for the measurement of moisture, protein and fat content of many food and agricultural products (Davies and Grant 1987; Irudayaraj et al., 2001). In the initial stage this technology was used mostly for the measurement of dry matter (DM) content of onions (Birth et al., 1985), soluble solids content (SSC) of
19
apples (Bellon-Maurel 1992) and water content of mushrooms (Roy et al., 1993), but at the moment current applications are quite different and include the estimation of nutritional compounds (Givens et al., 1997), the single organic acid (Ignat et al., 2012) and sugars detection (Rady et al., 2015) and have been also used to measure microstructure activities such as internal damage (Clark et al 2003), stiffness (Lammertyn et al., 1998) and sensory characteristics of fruits and vegetables (Mehinagic et al., 2004).
3.1 Prediction of Water content
IR is strongly absorbed by water and this absorption trend includes the NIR spectrum (730-2300nm). In high moisture foods with a water content ranging from 70-90% the absorption bands appear in close proximity to wavelengths of pure water (1400-1410nm being the strongest absorption band). For quantitative analysis of food water content the NIR bands in the ranges of 1400-1440nm and 1900-1950nm are mostly applied (Buning-Pfaue 2003). During water content analysis, beside free water molecules, there are one or two OH groups engaged in hydrogen bonds which influence the NIR absorption. Mixtures and continuum models are the two major classes of models to describe water structure (Wicke 1976).
Only a trace of absorption near 1430nm was observed for free water band in dry fruits such as soybean. In pear flesh a sharp absorption band was observed at 1406nm in a dehydrator which decreased in intensity as the dehydration process proceeded. The NIR spectrum of potato is in the range of 1100-2500nm (Buning-Pfaue 2003).
ElMasry et al., (2007) used hyperspectral imaging in visible and near infrared regions i.e. 400-1000nm for the determination of moisture content (MC), SSC and pH in strawberry using PLS and multivariate calibration for spectral data analysis. The research concluded that as the strawberries ripened the moisture content and relative reflectance in 400-1000nm domain increased. For MC the correlation coefficient (R) was 0.90, with a SEC 6.1 and a SEP of 3.9.
Rajkumar et al., (2012) investigated the relationship between banana maturity stage and MC using hyperspectral reflectance imaging (400-1000nm) at three different temperatures of 20, 25 and 30oC and developed a linear correlation between the two parameters. They also found out that moisture content increased with growing maturity. The coefficient of determination for MC was found to be 0.87.
Huang et al., (2014) developed regression models to simultaneously predict MC and color of soybeans during drying process using hyperspectral imaging technique in which mean reflectance and image
20
entropy parameters (related to the uniformity of pixel intensity in the image) were extracted. After establishing PLS models, it was found out that reflectance data provided more reliable results than the entropy data. The correlation coefficient valued 𝑅𝑝 = 0.97 and RMSEP=4.7% was obtained for MC using reflectance data as compared to 𝑅𝑝 = 0.901 and RMSEP= 9.2% using entropy data.
Pu and Sun (2015) used NIRS to show that the moisture in the central part of mango fruit is lower than in the surrounding flesh. For this purpose, two lab scale HSI systems were used and it was concluded that with the increase in MC the value of the mean relative reflectance decreased. Five feature wavebands at 908, 1076, 1153, 1405 and 1706 nm were used to develop PLS models (and showed best prediction results with 𝑅𝑝2 = 0.97 and RMSEP=4.6%.
3.2 Soluble solids, acidity and assessment of the maturity stage
The soluble solids content (SSC) and total acidity (TA) can be predicted by using reflectance, transmittance and interactancemodes of NIRS and Vis-NIRS. Good calibrations for different fruits can be obtained using transmittance mode. Reflectance mode also reaps satisfactory results for the fruit surface which is directly illuminated by the source (V Andrew McGlone et al., 2003). NIRS has successfully been brought to use for the determination of the soluble solids content (SSC) of many fruit species as apples (Iyo and Kawano 2001; Gomez 2001; Zude et al., 2006), kiwifruit (Ying et al., 2005), mushrooms (Roy et al., 1993) and citrus fruit (Guthrie et al., 2005; Gomez et al., 2006).
In case of tomatoes, SSC and TA are major internal quality indices contributing to the flavor (Kader 1984; Flores et al., 2009). Flores et al., (2009) conducted a research to predict the internal quality parameters such as soluble solid content (SSC) and titratable acidity (TA) of the intact tomatoes (Lycopersicum esculentum Mill., cv. ‘Raf’) for two consecutive years. This variety is peculiar for its distinctive dark-green color and for its shape; moreover, due to its salinity resistance it possesses an exquisite flavor rarely found in other varieties. The study focused on the comparison of the new generation diode ray instruments with a laboratory scale NIR monochromator. The harvested fruit was stored at 10oC and 95% RH. Different wavelength bands and different pretreatments were used to develop calibration models. The result concluded that the irregular shaped variety under study was accurately predicted by NIR using the spectra collected in the range of 400-1700nm excluding the
21
wavelengths above 1700nm, as they were found unnecessary for the application. The SECV for the prediction of SSC was in the range of 0.55-0.74 oBrix and those of TA ranged in between 0.06% to 0.1% citric acid (Osborne et al., 1993; Lammertyn et al., 2000).
The soluble solid contents (SSC) of citrus fruits could be predicted by using partial least square (PLS) and modified PLS (MPLS) models.
V. McGlone et al., (2003) conducted a research to predict the SSC and TA of Citrus reticulata (cv. "Miyagawa") known as Satsuma Mandarin using transmission, reflectance and interactance modes within spectral windows of 500-1100nm. Direct transmission mode with 700-930nm spectral window gave most accurate SSC predictions with R2 value of 0.93 and RMSEP=0.32%. None of the three measurement modes provided accurate prediction of TA and the only predictive ability achieved (best values being R2~0.65 and RMSEP~0.15%) was afforded indirectly through a correlation with the skin chlorophyll changes occurring with fruit maturity. In a more recent study on Satsuma mandarin, reflectance in a window of 400-2350nm was used obtaining an RMSEP value of 0.16 and an 𝑅𝑐2 = 0.94 (Gomez et al., 2006).
Also other authors assessed internal quality parameters of mandarin fruit for total soluble solids (SSC) and dry matter (DM). By applying modified partial least square (MPLS) model using 720-950 nm window in 00 interactance spectroscopy with two scans they obtained an 𝑅
𝑐2 of 0.41 for SSC and 0.91 for DM and RMSEP of 0.22% and 0.45% for the above attributes respectively, for 17 different populations. They found out that the performance of the calibration model was very satisfactory for the prediction of SSC and DM whereas it was unacceptable for juiciness and TA (Guthrie et al., 2005).
Cayuela (2008) predicted the SSC and TA in oranges by developing PLS models using NIR spectrophotometer with a post dispersive reflectance configuration. According to these authors fruit samples were kept at 20oC for 24 hours prior to measurements. Destructive techniques were used to get the values of SSC, TA and pH using digital refractometer, potentiometric titration of citrus juice and pH meter respectively prior to spectral analysis. Spectra were collected in two spectral windows of wavelength ranges 578-1090.2nm and 1110-1842.2nm respectively. For SSC the effect of spectral acquisition modalities on the efficacy of the model were also investigated and particularly by taking four and two spectral measurements along the fruit equator. The results were found to be more reliable for
22
the prediction of the SSC and not very consistent in case of TA and pH because of the low level of these parameters in citrus fruit. It was found that PLS models performed better than the MPLS models with the best results being 𝑅𝑐2 = 0.88 and an internal validation SECV of 0.41 for SSC and that the acquisition of two spectral measurements gives better results as compared to four spectral measurements. Moreover, in this research the typical diffuse spectra of oranges were found in resemblance to those of Satsuma mandarins by Gómez et al., (2006).
Some authors applied hyperspectral imaging in the range 400-1000 nm to predict the SSC, TA, pH, and DM in strawberries by selecting 6 wavelengths form the visible NIR region based on the β-coefficient of PLS analysis. Both PLS and MLR models gave same correlation coefficients of calibration i.e. 𝑅𝑐 = between 0.80 for SSC and 0.92 for DM (ElMasry et al., 2007). In the same work the images were also used to classify fruits according to their maturity stage. The same techniques and spectral range (500-1000nm) was also used to predict SSC and firmness of blueberries (Leiva-Valenzuela et al., 2013). For these high-value crops implementing a sorting line for soluble solids would, in fact be, highly desirable. Schaare and Fraser (2000) compared the reflectance, interactance and interference modes of spectroscopic measurements for estimation of SSC of Actinidia chinensis (yellow fleshed Kiwifruits). According to this research the interactance mode spectra were found to give the most accurate results for SSC estimation (also the results were valid for estimation of flesh color and density). SSC were predicted with a SEP of +0.80oBrix with correlation coefficient R2=0.93. Whole fruit densities and flesh hue angles were also predicted. Moreover on kiwifruits (Moghimi et al., 2010), combined Vis-NIR in the wavelength range of 400-1000nm and chemiometric techniques to predict SSC and TA. The prediction performance showed 𝑅2values of 0.93 and 0.94 and RMSEP of 0.26oBrix and 0.076 for both parameters respectively.
Pu et al., (2016) studied the prediction of SSC, pH and maturity discrimination in lychees by employing shortwave NIR in the range of 600-1000nm and longwave NIR in the range of 1000-2500nm. This research concluded that spectral set in the longwave NIR region performed better having values 𝑅𝑝= 0.88 and RMSEP=0.91 oBrix for SSC and 𝑅𝑝 = 0.74 and RMSEP=0.29 for pH.
Some studies related to hard green mangos tried to index the eating quality of the fruits in terms of SSC (Subedi et al., 2007). PLSR models were optimized (for second derivative of absorbance spectra)
23
for SSC and DM in terms of short wave NIR wavelength range. The SSC models showed an 𝑅𝑣2 = 0.92 with SEP of 0.67 and bias of 1.25%.
Moreover, another study by (Rungpichayapichet et al., 2016) developed calibration models for mango ripening index, SSC, TA, and firmness using diffuse reflectance spectra (700-1100nm) and PLSR. It was found out that using combined data of a few years for calibration greatly enhanced the prediction accuracy. All desired parameters were very suitably predicted by establishing prediction models from three year data with a 𝑅2 value of 0.9 and SEP of 1.2% for SSC and 𝑅2 =0.74 and SEP=0.38% for TA.
Marques et al., (2016) conducted a study for the evaluation of hand held NIR spectrometer based on linear variable filter technology (LVF) for quality control analysis of mango ‘Tommy Atkins’ by building calibration models using PLSR for determination of SSC, TA, dry matter (DM) and pulp firmness. The spectrophotometer was found feasible to determine the quality parameters giving the coefficient of determination values 0.92 and 0.50 for SSC and TA respectively, and RMSEP of 0.55oBrix for SSC and 0.17% citric acid.
These techniques may also be a valid support to enhance efficiency of cultivar breeding as for apple fruit phenotypes. Pre-storage and post-storage (0.5oC, 6-10 weeks) NIR spectra of fruit were recorded and in the case of SSC and DM, the genetic correlation between observed and predicted performance was as high as 0.91 for SSC and 0.95 for DM (Kumar et al., 2015).
Moreover a desired objective of these predictive models is that they should be extended to as much pre-harvest conditions as possible, and therefore when testing different varieties, a multi-cultivar model is often compared to individual ones as in the case of plums (Louw and Theron 2010). These authors developed multivariate prediction models using FT-NIRS (800-2700nm) for SSC, TA, weight, sugar to acid ratio and firmness in three different cultivars of African plums. ‘Pioneer’ and ‘Laetitia’ cultivar specific models had a better predictability capacity as compared to ‘Angeleno’ model and it was concluded that multi cultivar models outperformed single cultivar models on 𝑅2 values. Bureau et al., (2009) used spectra of 598 fruits from 8 different cultivars of apricot at different maturity stages to predict a general model for SSC, TA and other attributes and found a high correlation for SSC and TA, whereas other quality attributes were not satisfactorily predicted. These models were, in fact, applied for the prediction of other 279 fruits giving a prediction error of less than 8% of fresh weight for SSC and about
24
15% for TA. Yang et al., (2014) developed a robust model on sugar beet with 890 samples (820 in calibration and 79 in prediction) over 28 varieties which showed coefficient of determination value i.e. 𝑅2 for calibration models of sugar content of 0.908 and RMSECV of 0.38.
On the other side in some cases the variety discrimination is also important, and therefore there are studies aimed to detect variety other than to predict other quality attributes as for pears where the authors discriminated 3 varieties by means of hyperspectral imaging (Li et al., 2016) and artichokes where 2 varieties were correctly classified (Amodio et al, unpublished). The results of this paper can be utilized to develop simple, low-cost and efficacious equipment in the further study.
In another study aimed to determining SSC and firmness of intact ‘Aurora-1’ peaches and to discriminate among harvest date and maturity stage the authors concluded that for SSC, the model obtained from validation set 𝑅𝑀𝑆𝐸𝑃 = 1.08%, R2= 0.59 showed better performance than when applied on independent data set (𝑅𝑀𝑆𝐸𝑃 = 1.04%, R2= 0.45) and that no segregation of the samples was obtained for harvest season and maturity stage (Nascimento et al., 2016).
Generally, results on fruits demonstrate that soluble solids can be predicted with good accuracy encouraging the implementation of online systems to monitor this and eventually other quality attributes. In this case, it should be considered that other acquisition variables may affect the final results as for instance the distance from the light source and the position of the fruit as investigated on apple fruits for the prediction of SSC (Liu et al., 2007). The apples were equilibrated by placing them at 19oC and 68% RH for two days. The distances of 0, 2, 4, and 6 mm were taken under consideration. Variance analysis was employed to obtain statistical analysis of FT-NIRS followed by development of calibration models using PLS. Best calibration model gave 𝑅2 = 0.84 and SEP of 0.77. The research concluded that the different distances had different effect on the performance of the calibration models.
Moreover, in cases of cut products, model developed directly on the slices can give better prediction accuracy as found for sugar beet (Pan et al., 2015) for which SSC, moisture and sucrose content was predicted. With the same idea, Lu et al. (2000) developed a model after acquisition to predict the sugar content and firmness, finding that the prediction of sugar content for peeled apples was better than for unpeeled apples, where the RMSE increased by 0.17 oBrix, on an average. Flores et al. (2008) conducted a study to access the SSC of the intact and cut melons and watermelons using a NIR diode array
25
spectrometer for data of two consecutive years. In case of cut melons the SECV was 0.60oBrix and 𝑅2 = 0.88, whereas, in case of cut water melons, the values of above parameters were 0.49o Brix, with R2 of 0.76, but some uncertainty in the prediction results may be accepted for a crop like this, where the prediction of internal sugar content would be very valuable.
Generally, for melons the variation of SSC along the longitudinal direction may be the major limitation in the robustness of the calibration models as pointed out for orange flesh netted melon fruits (Cucumis melo L. reticulatus group). The research found out that SSC in the outer mesocarp was 3 units higher at the stylar end of the fruit compared with the stem end, and that SSC in the inner mesocarp was higher than in the outer tissue, showing higher uniformity at spatial positions. With increasing maturity of the fruit, the linear relationship between the outer 10 millimeter and subsequent middle 10 millimeters of thickness of tissue also varied as different R2 values were observed, affecting the performances of the calibration model. So for these fruits this variability should be taken into account to set up a performing acquisition set-up.
In addition to SSC and TA, NIR spectroscopy have also been successfully used for prediction of sugar and organic acid composition of fruits and vegetables.
The presence of glucose and sucrose in potatoes was predicted by Rady et al. (2015) using visible NIR spectroscopy. Each sample to be tested was a slice of 12.7mm thickness uniformly cut from all tubers. PLSR demonstrated that strongly correlated models were built for glucose (correlation coefficient as high as 0.97 for ‘Russet Norkotah’ and 0.81 for ‘Frito Lay’ cultivar as compared to those of sucrose which showed less correlation performance. The results depicted high classification errors for sucrose (30% for RN and 34% for FL).
Fernández-Novales et al., (2009) concluded NIR spectroscopy as a promising technique for determination of reducing sugar content during grape ripening, winemaking and aging. NIR spectra of 146 samples were collected in the region of 800-1050nm. Spectra were interpreted and calibrations were developed using PCA, PLS and MLR regression. The values of 𝑅2, SECV and RMSECV for the PLS model in full spectral range were 0.98, 13.62g/l and 13.58g/l, respectively.
26
3.3 Macro and micronutrients: vitamins, phenolic, antioxidant activity
Despite the high content of water in fruits and vegetables, whose peaks predominated over the ones of low concentration constituents causing reduction in prediction accuracy, as their spectra may overlap with water (Nicolai et al., 2007), many studies have been conducted to estimate the content of minor constituents including phytochemicals.
Research has been conducted to estimate the total antioxidant activity using infrared spectroscopy coupled with chemiometric predictive models. In context of antioxidant activity, infrared spectroscopy has garnered interest due to the reduced time required for the analysis, the enhanced precision and the simple sample preparation, no requirement for reagents and extraction steps (Lu and Rasco 2012). Various spectroscopic methods have, in fact, been used for the determination of the Vitamin C content, carotenoids, folates, phenols, and generally for the antioxidant capacity of fruits and vegetables, as also for fiber content. Liu et al., (2015) Liu et al., (2015)
Liu et al., (2015) used multispectral imaging in combination with chemiometric methods for measurement of lycopene and phenolic compounds content in intact tomatoes and concluded that the models developed with back propagation neural network (BPNN) gave the best performance. For lycopene and total phenolic content prediction, the residual predictive content (RPD) was 4.59 and 9.33, respectively.
Rungpichayapichet et al., (2015) compared the NIRS and color measurement to predict β-carotene content in Mango and found out that long wave NIR served the prediction purpose better as compared to the short wave NIR. The coefficient of determination 𝑅2 > 0.8 and standard error of prediction of 11.6-20.2 retinol equivalents RE 100g-1 edible part EP were obtained by NIRS calibration.
De Nardo et al., (2009) declared attenuated total reflectance (ATR) spectroscopy combined with multivariate analysis as a reliable and effective technique for rapid quantification of lycopene and β-carotene in tomato juices. High performance liquid chromatography (HPLC) was used as a reference method. Unique marker bands were shown by infrared spectra at 968cm-1 for β-carotene and 957cm-1 for lycopene. Multivariate spectral data analysis gave r values of >0.9 between the ATR-IR predicted and HPLC reference values. Standard error of cross-validation (SECV) values of 0.5 and 0.04 mg/100g of juice for lycopene and β-carotene were given.
27
content in pericarp and HSI information. 3-D images of lychee were acquired in the range of 350-1050nm from HSI system. For data dimensionality reduction and selection of optimal wavelength in relation to anthocyanin content, successive projection algorithm (SPA) and stepwise regression (SWR) algorithm was used. To develop a quantitative relationship between the anthocyanin content in the pericarp and HSI information in both optimal wavelength sets, radial basis functional neural network (RBF-NN) was used to fuse together SPA-RBF-SVR and SWR-RBF-SVR models.
Ferrer-Gallego et al., (2011) measured the phenolic compounds in the grapes and grape skin using NIR spectroscopy technique in the wavelength range of 1100-2498nm. The ratio performance deviation (RPD) was found to be 4.8, 2.1, 5.8 and 4.2 for anthocyanins, phenolic acids, flavanols, and flavonols in intact grapes, respectively. RPD values for the same parameters in case of grape skin were found to be 4.4, 6.3, 13.6, and 12.7 respectively. The study concluded that in order to obtain best results the use of a fiber-optic probe is recommended for directly recording the spectra of intact grapes.
Hyperspectral imaging and FT-NIR have also been used to predict phenolic content and antioxidant activity of fresh-cut artichokes, with FT-NIR giving more accurate results particularly for phenols which were predicted with an RMSEP of 18 mg/100g (Amodio et al., unpublished).
Ignat et al., (2012) conducted a study to non-destructively estimate the ascorbic acid content of bell peppers during various stages of growth in reflectance mode obtaining Vis-NIR (477-950nm) and NIR (850-1888nm) spectra. The destructive analysis of the three cultivars showed that the ‘Ever Green’ variety possessed the highest content of ascorbic acid of 148.1mg/100g as compared to ‘No.117’ and ‘Celica’. The PLS models predicted the ascorbic acid contents of all three cultivars with a cross validation error of 15.1-18.9mg/100g (RPD=2-2.4). In the same way another work evaluated the ability of NIR to predict ascorbic acid, chlorophyll a and b, and total phenolic compounds in the exocarp and mesocarp tissues, respectively of summer squash concluding that NIRS could be used for screening purposes (Blanco-Diaz et al., 2014).
Pissard et al., (2013) collected the spectra of three different varieties of apples collected for three consecutive years in the range of 400-2500nm using NIR reflectance mode for the prediction of Vitamin C and polyphenolic content. The research concluded that good prediction precision for vitamin C was achieved using NIR with a SEP of 4.9mg 100-1g FW and R2 = 0.8. In case of total polyphenol content
28
these values were obtained to be 140µg g-1 FW and R2 = 0.94. Therefore, the quality of the apples was successfully predicted using NIRS.
Also for nutritional compounds NIR spectroscopy can be used to screen different genotypes with the purpose of selecting cultivar with high nutritional values. One example is a study on Cassava root where more than 3000 samples were used to predict total carotenoids, and β-carotene and dry matter, with determination coefficients higher than 0.92. In the same study NIRS also distinguished the roots with high or low cyanogenic potential (R2: 0.86).
Sinelli et al., (2008) developed predictive models for blueberry to evaluate the content of total phenols (RMSEP = 0.18mg catechin/g), total flavonoids (RMSEP = 0.25mgcatechin/g) and total anthocyanins (RMSEP= 0.22mg catechin/g), whereas for ascorbic acid model performance were lower. Also for nutritional compounds NIR spectroscopy can be used to screen different genotypes with the purpose of selecting cultivar with high nutritional values. One example is a study on Cassava root where more than 3000 samples were used to predict total carotenoids, and β-carotene and dry matter, with determination coefficients higher than 0.92. In the same study NIRS could also distinguish roots with high or low cyanogenic potential (R2: 0.86).
Research work has also been done to predict the fiber content in various cereal products, barley cultivars and Brazilian soybean (Kays and Barton 2002; Kays et al., 2005; Ferreira et al., 2015).
Ferreira et al., (2015) accessed the total dietary fiber in ground Brazilian soybeans employing FT-NIR spectroscopy in the range of 1000-2500nm using diffuse reflectance. The best prediction results were obtained using PLSR model and the R2 value was found to be 0.80 with a RMSEP=0.86, conforming the reliability of NIRS technology for accurate prediction of total dietary fiber
Moreover, fiber content have been predicted on ground cereals. Kays et al., (2005) investigated the total dietary fiber (TDF) content of barley cultivars using NIRS reflectance and transmission modes for whole polished and grounded grains. For polished whole grains, MPLS models were developed in the transmission spectral range of 850-1048nm obtaining SECV of 10.4 and R2 value of 0.82. In case of ground barley samples, reflectance spectroscopy was employed in the wavelength range of 1104-2494 nm getting better prediction with SECV of 5.2 and an R2 of 0.96. Hence, the reflectance mode gave better results than the transmission mode due to enhanced amount of information in the wavelength region
29
utilized. Also Kays and Barton (2002) used the NIRS to predict the soluble and insoluble dietary fiber grounded cereals. It was concluded by the research that insoluble dietary fibers were predicted more accurately as compared to the soluble dietary fibers. The values of SECV and R2 for insoluble dietary fiber were 1.5% and 0.98, respectively, whereas the same values for soluble dietary fibers were 1.15% and 0.82.
Beside the application of spectroscopy on intact fruits and vegetable these techniques may also be used as destructive methods on juices, pastes and powders made from horticultural products or on chemical tissues extracts prepared as in the conventional analytical methods, since even in this way the measurement of nutritional content would be much faster and less expensive (in time and resources) than the conventional reference method. Interesting results on fruit paste have been reported for profiling tomato carotenoids having good accuracy for β-carotene content (𝑅2𝐶𝑉 of 0.89 and RMSECV=0.174µg g-1and for all-trans lycopene content ( 𝑅2𝐶𝑉 = 0.75 and RMECV=6.88µg g-1) (Deak et al., 2015).
Bureau et al., (2013) tested attenuated total reflectance FT-IR on 284 and 483 samples from two successive years and of different cultivars possessing large phenotypic variability. Homogenates of all peach fruit samples were also analyzed using ATR-FTIR three methods were used to determine sugar and organic acid composition, namely, colorimetric enzymatic measurement (ENZ), high performance liquid chromatography and proton NMR spectroscopy, concluding that ENZ reference data provided best correlation with ATR-FTIR data, with best results giving RMSECV in range of 5.8-8.7% for SSC and 5.9-8.0% for TA.
Yang and Irudayaraj (2002) used six different spectroscopic techniques capable of detecting the vitamin C content in powdered mixture and solutions of food and pharmaceutical products by comparing the efficacy of NIR (0.988), FT-NIR (0.992), FTIR-ATR (0.999), diffuse reflectance (DRIFTS) (0.976), Fourier transform infrared-photoacoustic FTIR-PAS (0.988) and FT Raman spectroscopy (0.95). Overall prediction error ranged from 0.2 to 3 with best results obtained when using FT-NIR and FT Raman techniques. Another example regarding the prediction and localization of glucosinolates on freeze-dried broccoli by means of hyperspectral imaging demonstrated good potentiality on these samples (Hernandez-Hierro et al., 2014).
30
4. CONCLUSIONS
Further research perspectives in this field should be focused on simplifying existing models reducing the number of wavelength in order to facilitate the implementation of online sorting systems based on nutritional content and on exploiting the possibility of using these techniques to develop new methods for unexplored nutritional compounds and over a large number of species and cultivar, also to assess the impact of pre and postharvest factors on the fate of these compounds. Moreover, also the scope of using spectroscopic techniques to assess nutritional content on fruit extracts prepared as for the conventional analytic methods would be an interesting perspective to reduce the time of measurements and to allow to conduct the analysis without having a chemical laboratory with sophisticated equipment and expert technicians.
Finally, in this chapter the use of these techniques as a classification methods were not deeply commented, since the focus was on quantitative methods, but classification algorithms may be applied to discriminate fruits and vegetable for their origins, including also the growing practices or for quality discrimination with a particular regard to their nutritional quality.
31
REFERENCES
Amigo, J. M., I. Marti and A. Gowen (2013). "Hyperspectral imaging and chemometrics: a perfect combination for the analysis of food structure, composition and quality." Chemometric in Food Chemistry, Elsevier, Amsterdam: 343-370.
Ariana, D. P. and R. Lu (2008). "Quality evaluation of pickling cucumbers using hyperspectral reflectance and transmittance imaging: Part I. Development of a prototype." Sensing and Instrumentation for Food Quality and Safety 2(3): 144-151.
Ariana, D. P. and R. Lu (2010). "Evaluation of internal defect and surface color of whole pickles using hyperspectral imaging." Journal of Food Engineering 96(4): 583-590.
Baardseth, P., H. Helgesen and T. Isaksson (1996). "Multivariate techniques in the analysis of meat quality." Meat Science 43: 135-149.
Bellon-Maurel, V. (1992). Application de la spectroscopie proche infrarouge au contrôle en ligne de la qualité des fruits et legumes.
Birth, G., G. Dull, W. Renfroe and S. Kays (1985). "Nondestructive spectrophotometric determination of dry matter in onions." Journal of the American Society for Horticultural Science (USA).
Blanco-Díaz, M. T., M. Del Río-Celestino, D. Martínez-Valdivieso and R. Font (2014). "Use of visible and near-infrared spectroscopy for predicting antioxidant compounds in summer squash (Cucurbita pepo ssp pepo)." Food chemistry 164: 301-308.
Brereton, R. G. (2007). Applied chemometrics for scientists, John Wiley & Sons.
Büning-Pfaue, H. (2003). "Analysis of water in food by near infrared spectroscopy." Food Chemistry
82(1): 107-115.
Bureau, S., B. n. d. Quilot-Turion, V. r. Signoret, C. Renaud, M. Maucourt, D. Bancel and C. M. Renard (2013). "Determination of the Composition in Sugars and Organic Acids in Peach Using Mid Infrared Spectroscopy: Comparison of Prediction Results According to Data Sets and Different Reference Methods." Analytical chemistry 85(23): 11312-11318.
Bureau, S., D. Ruiz, M. Reich, B. Gouble, D. Bertrand, J.-M. Audergon and C. M. G. C. Renard (2009). "Rapid and non-destructive analysis of apricot fruit quality using FT-near-infrared spectroscopy." Food Chemistry 113(4): 1323-1328.