First analysis of data concerning damage occurred
to churches of the Marche region following the 2016
central Italy earthquakes
S. Carbonari1, a. Dall’aSta2, l. Dezi1, F. Gara1, G. leoni2, M. MoriCi2, a. Prota3 and a. zona2
1 Department of Construction, Civil Engineering and Architecture, Università Politecnica
delle Marche, Ancona, Italy
2 School of Architecture and Design, University of Camerino, Ascoli Piceno, Italy
3 Department of Structures for Engineering and Architecture, University Federico II, Naples,
Italy
(Received: 15 March 2018; accepted: 3 February 2019)
ABSTRACT The seismic sequence that struck central Italy from August to October 2016 caused severe damage to many historical and artistic buildings. In particular, churches were widely affected due to the intrinsic peculiarities of their structural system, unable to develop an efficient box-like resisting mechanism. After the seismic events, teams of experts carried out a massive survey of churches to assess both the occurred damage and their usability. Teams were coordinated by the Department of Civil Protection and the Ministry of Cultural Heritage. In this paper, a methodology for processing the data recorded during the inspections of a number of churches of the Marche region is proposed and used to analyse a sample data set. Starting from the subdivision of the sampled churches into homogeneous typologies, the most recurring damage mechanisms are identified. In addition, the global damage index of each church is correlated with the relevant highest pseudo spectral acceleration at period 0.30 s registered at the site as a consequence of the main shocks; relationships between the seismic intensity and the observed damage are then derived from such a correlation. Finally, the overall damage occurred to churches of the sample is compared to that estimated through empirical models available in the literature.
Key words: churches fragility, cultural heritage, earthquake damage, post earthquake investigation.
1. Introduction
Churches in central Italy are widespread buildings with very often high historical and artistic value, constituting an important component of the Italian cultural heritage. Their architecture is characterised by recurrent structural subsystems, e.g. façade, side walls, transept, apse, nave, and side aisles, which tend to exhibit often independent seismic responses and are commonly indicated as elements (Doglioni et al., 1994). The independent seismic behaviour of macro-element can be explained as a consequence of the considerable walls dimensions, the absence of intermediate floors, the poor interlock of walls, the presence of arches and vaults with not
opposed thrust, and the presence of deformable wooden roofing. Studies carried out on damage occurred to churches following the earthquakes of Friuli 1976 (Doglioni et al., 1994), Umbria-Marche 1997 (Lagomarsino and Podestà, 2004a, 2004b), Molise 2002 (Lagomarsino and Podestà, 2004c), L’Aquila 2009 (Lagomarsino, 2012), and Emilia 2012 (Indirli et al., 2012; Sorrentino et
al., 2014) demonstrated that the damage mechanisms have recurrent characteristics, despite the
uniqueness of each building.
Starting from the knowledge gained in previous studies carried out after major seismic events, the first data on the damage suffered by the cultural heritage of the Marche region are post-processed in this work with the final objective of identifying the relationships between observed damage and earthquake intensity. A post-processing methodology is proposed and applied to a subset of the data collected from the post-earthquake investigations carried out after the main shocks of the 2016 central Italy seismic sequence. Problems relevant to the processing of data, often characterised by inhomogeneous information, are addressed, proposing strategies for their interpretation.
2. Statistical processing of church damage data
2.1. Database construction
After the sequence of seismic events that started in central Italy on 24 August 2016, several teams of specialised technicians were activated to inspect the damage suffered by the buildings of the Italian architectural heritage. Damage survey forms relevant to the damage detection and classification (DPCM 23 febbraio 2006, 2006) were compiled to provide useful information for public safety, allowing the identification of situations requiring urgent provisional interventions.
Teams, coordinated by the Department of Civil Protection (DPC) and the Ministry of Cultural Heritage (MiBACT), through structures operating within the Command and Control Direction (Dicomac) and the regional offices, were composed by MiBACT’s officials and structural engineers belonging to the Seismic Engineering Laboratory Network (ReLUIS). Personnel of the Italian Fire Corps were also included where necessary to grant safe access to the damaged structures.
During the inspections, the A-DC damage survey form (DPCM 23 febbraio 2006, 2006; Modello A-DC PCM-DPC MiBAC, 2006) were used, collecting general data of the building (name, geographical position, historical dating, contained mobile goods, etc.), data of the planar-volumetric organization of the main elements of the building (e.g. central nave, apse, transept,
façade) and its state of preservation. In addition, in a specific section of the survey form, the
macro-elements that could be potentially activated, their relevant level of occurred damage and the nature of the damage (seismic or non-seismic) were addressed. Finally, access restrictions and the need of urgent provisional interventions to assure the public safety and the heritage preservation were reported in the survey form.
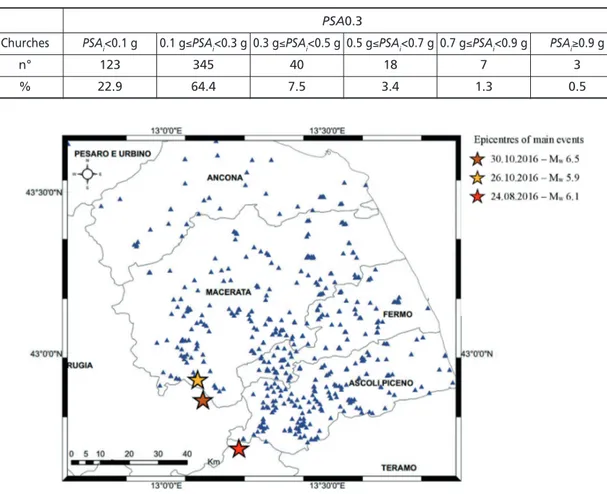
The sample of data adopted in the present study is obtained from 536 churches evenly distributed over the Marche region (Fig. 1), except for the areas close to the epicentres.
The ground motion intensity at the different locations was obtained from the official Shake Map data published online by the Italian National Institute of Geophysics and Volcanology (INGV, 2012), in terms of peak ground acceleration (PGA), peak ground velocity (PGV) or
pseudo spectral accelerations (PSA) at 0.3 (PSA0.3), 1.0 and 3.0 s. These shake maps were computed assuming that the ground motion intensity at each location is lognormally distributed, combining the instrumental measurements of shaking after the main events with information about local geology, earthquake location and magnitude to estimate shaking variations throughout a geographic area.
For the vulnerability assessment presented in the following, PSA0.3 was chosen as measure of ground motion intensity, given that structures as those considered in this study have generally a first initial tangent period, which characterises the global behaviour, close to 0.30 s. However, it is worth mentioning that this approach might present some limitations as it could be not suitable for some churches of the sample (e.g. characterised by the presence of partially connected structural components having specific periods). Further investigations on this aspect were not developed in this study and could be the object of future research activities.
Considering the intensity measure at the location of the i-th church (PSAi), the entire sample was divided into five intervals of PSA. The distribution of the sample over the intervals is reported in Table 1, considering the maximum PSAi suffered by the i-th church at the inspection date. It can be noted that the sample is representative of churches subjected to a low average intensity (PSA < 0.3 g).
Table 1 - Distributions of churches of the sample according to the maximum PSA0.3 suffered at the date of inspection. PSA0.3
Churches PSAi<0.1 g 0.1 g≤PSAi<0.3 g 0.3 g≤PSAi<0.5 g 0.5 g≤PSAi<0.7 g 0.7 g≤PSAi<0.9 g PSAi≥0.9 g
n° 123 345 40 18 7 3
% 22.9 64.4 7.5 3.4 1.3 0.5
2.2. Churches general information
In order to derive realistic relationships between expected damage and seismic intensity, it is necessary to classify the sample into categories that are representative of different architectural typologies, in order to highlight possible correlations between architectural configurations, vulnerability, and damage. In this way, information on the state of preservation is also gained (being reasonably to make the hypothesis that important churches were subjected to periodic maintenance).
It is also essential to consider the overall state of preservation of the church that can affect the extent of the damage developed during earthquakes; this information was derived from the survey forms and suitably analysed within the proposed framework. Finally, it is interesting to mention that the analysed sample includes churches that also experienced the 1997 Umbria-Marche earthquakes (RiMARCANDO 1997-2007, 2007) and that were subjected to restorations more or less incisively depending on available funding and extent of suffered damage. Unfortunately, the A-DC damage survey form does not include a specific section dedicated to previous interventions, architectural restoration, and seismic improvements. Thus, the sample could not be analysed including this interesting aspect and consequently some cases (e.g. churches suffering low damage located near the seismic epicentre) have been analysed accepting this intrinsic limitation.
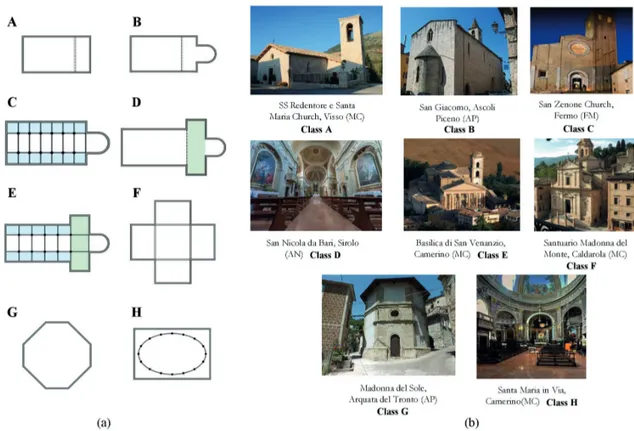
A typological classification of churches constituting the sample was first defined starting from a post-processing of data available from the general part of the A-DC damage survey form. In particular, based on the plan and altimetry configuration of the churches, the following typological groups were defined (Fig. 2):
A. one-nave church;
B. one-nave church with apse; C. three-nave church with apse;
D. one-nave church with transept and apse; E. three-nave church with transept and apse; F. Greek cross plan church;
G. octagonal plan church; H. elliptical plan church;
Fig. 3a shows the distribution of the churches based on the proposed classification; most of churches, namely the 70% of the sample, fall into the first two categories A and B, the 23% in the C-H classes, while for the remaining 7% cases it was not possible to give a classification for the lack of data reported in the A-DC forms.
By considering five plan area ranges (<100 m2, 100-200 m2, 200-500 m2, 500-1000 m2 and >
1000 m2), churches that have a surface area less than 100 m2 mostly populate the sample (Fig.
3b), while only 2% of them has a surface greater than 1000 m2. This result, in conjunction with
the distribution of the typological categories previously introduced, demonstrates that most part of the churches is constituted by a medium-small size characterised by a simple plan.
In processing the sample in terms of the state of preservation, it came out that most of the churches had a good/fair state of maintenance (about 81%), while only a small percentage of them were in a bad state of preservation (around 4%).
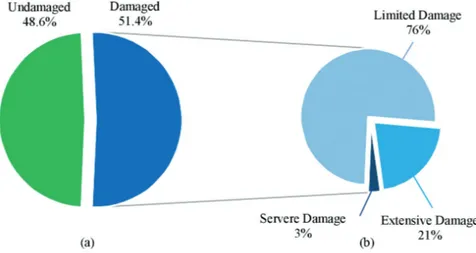
Furthermore, the analysis of the data reveals that 51.4% of the sample presented a limited existing damage (i.e. damage that existed prior to the earthquake of 24 August 2016), while the
remaining part of the sample underwent damage due to the 2016 earthquake sequence (Fig. 4a). In particular, with reference to the existing damage, 76% of the sample had limited damage, while only 3% of cases had severe damage (Fig. 4b).
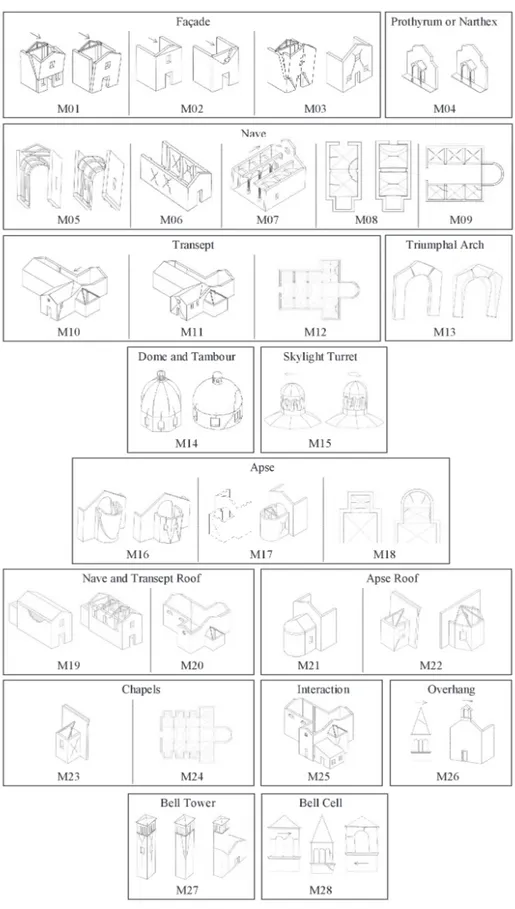
2.3. Analysis of activated mechanism and damage index evaluation
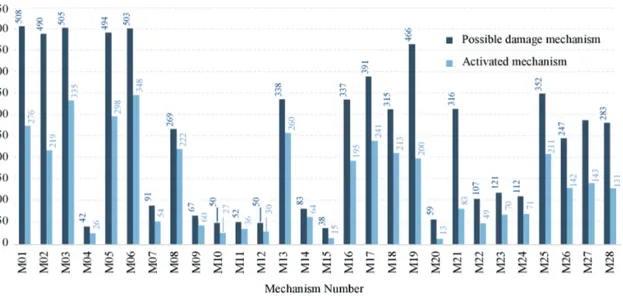
According to the Italian guidelines for cultural heritage (Modello A-DC PCM-DPC MiBAC, 2006), the seismic damage of churches can be classified according to the 28 mechanisms provided by the A-DC survey forms (Fig. 5). For each damage mechanism that can be potentially activated,
Fig. 2 - Typological plan classification: a) group scheme and b) same example of churches.
six levels of damage, from d0 (no damage) to d5 (partial or total collapse of the macro-element) are defined, according to the observational criterion of severity evaluation. Starting from the level of damage of each mechanism, it is possible to define a global damage index for the church, obtained from a weighted average of the active/activated damage mechanisms.
With reference to the sample of surveyed churches, Fig. 6 shows the comparison between the number of potential mechanisms that can be activated and the number of mechanisms that were actually activated with at least the d1 damage level. It can be observed that the largest numbers of potential mechanisms refer to the façade (in-plane and out-of-plane), lateral walls, vaults, apse, triumphal arch, roof, bell tower, and bell cell, in accordance with the typological distribution of the sample characterised by churches with simple structural systems. In particular, the mechanisms of the vault and the triumphal arch were very often activated (73% and 77% respectively) if compared to the potential activation, while the absolute most activated is the dome mechanism (90%).
If the possible and activated mechanisms of the churches in Abruzzo after the 2009 L’Aquila earthquake are considered (da Porto et al., 2012), the registered damage arises in a similar way for
façade mechanisms, lateral walls, apse, roof, and triumphal arch, while for the other mechanisms
some differences are observed. Furthermore, also the registered damage in the Emilia and Veneto churches, after the Emilia 2012 earthquake, appears similar in terms of potential-activated mechanisms, even if the typologies of churches are quite different with respect to those in the Marche and Abruzzo regions (Taffarel et al., 2016).
The sample of churches is divided into subsets, according to the maximum experienced PSA registered on site at the date of the technical survey. Three PSA ranges are considering (PSA ≤ 0.15 g, 0.15 g < PSA ≤ 0.30 g and PSA > 0.30 g) and values of the average damage for each mechanism relevant to churches of each subset are reported in Fig. 7. It is worth to mention that the time distribution of surveys, which began after the event of 24 August, interrupted with the events of 26 and 30 October, and resumed in November 2016, makes it necessary to associate each church with the correct maximum value of PSA, namely the one experienced by the building before the technical inspection occurred. Surveys on 51.5% of the churches of the sample were
Fig. 4 - Churches with existing damage: a) distribution of presence in the sample and b) severity and extension of damage.
carried out before 26 October, while the remaining 48.5% of the churches were inspected starting from November 2016.
It can be observed that the level of the average damage increases with the registered PSA. However, some mechanisms related to churches with more complex structural systems have opposite trends; this apparent inconsistency is probably due to the small number of churches falling within the typological category that can potentially develop such damage mechanisms, e.g. for some damage mechanisms of transept and aisles, the sample considered is not representative.
Starting from the damage of the single mechanisms, an overall damage index id can be evaluated for each church with the expression:
(1)
Fig. 6 - Comparison between possible damage mechanisms and activated damage mechanisms.
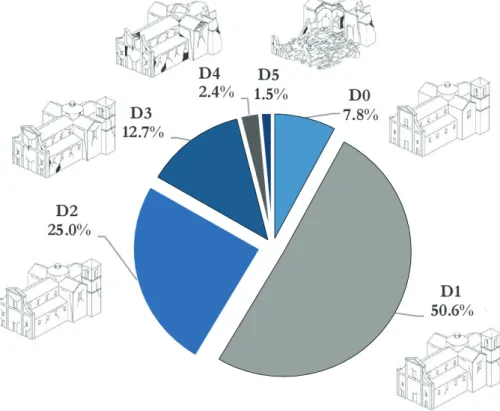
where N is the number of potential mechanisms and dk is the level of damage exhibited by each single activated mechanism. In order to make the vulnerability analysis of churches consistent with that of buildings, the damage indexes are grouped into damage classes (Lagomarsino and Podestà 2004a, 2004b; De Matteis et al., 2016), establishing a correlation with the six Dk damage levels (from D0 to D5) defined by the EMS-98 intensity (Grünthal, 1998). The correlation between the
id index ranges and the overall damage levels Dk proposed by Lagomarsino and Podestà (2004b)
is reported in Table 2.
Fig. 8 shows, for each damage level, the percentage of churches falling within each interval. It resulted that 50.6% of the churches presents the damage level D1, the 25% is characterised by a damage level D2, while the 12.7, 2.4 and 1.5% have damage levels D3, D4 and D5, respectively. The distribution of measured damage agrees with the distribution of the sample in the PSA range defined in Table 1, where it emerges that the sample is populated by churches that have suffered middle-low intensity of PSA0.3.
2.4. Proposal for new damage-intensity relationships
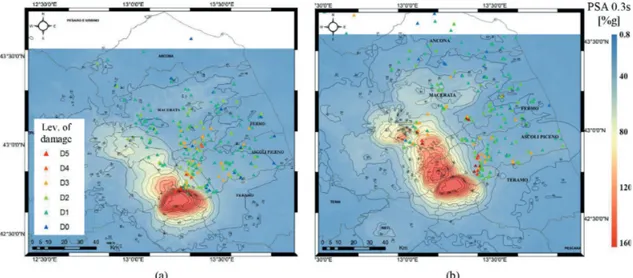
Assuming PSA0.3 as intensity measure, Fig. 9 shows, for the whole set of churches, the shake maps relevant to events of the 2016 seismic sequence, obtained by re-processing data from the INGV through the QGIS software (QGIS Development Team, 2015), together with the position of the inspected churches and the occurred damage. As already stated, the maximum values of
PSA provided by INGV at the date of the technical survey are considered. Thus, Fig. 9a refers
to accelerations of the seismic event of 24 August and reports locations of churches inspected
before 30 October, whereas Fig. 9b shows the envelope of accelerations of all the seismic events (occurred in August and October) and indicates locations of churches inspected after 30 October.
It can be observed that the damage level distribution reasonably agrees with the recorded maximum PSAs (at 0.30 s). However, results are extremely dispersed and some cases, characterised by higher epicentral distances, present excessive damage levels compared to the recorded values of PSA. This is probably a consequence of the bad state of maintenance (Casapulla et al., 2017), structural configurations promoting specific vulnerabilities (e.g. slender lateral walls or façade), or particular local site amplification, not revealed by the shake maps. In other cases, low damage level is registered for higher values of estimated PSA, probably due to seismic improvements or architectural restorations made to the involved churches, as previously discussed.
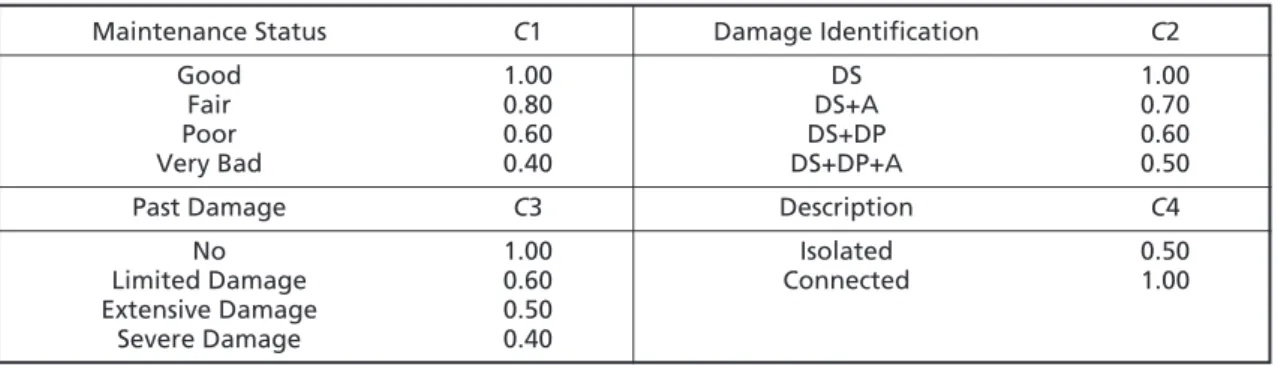
Thus, in order to identify a relationship between the intensity measure and the occurred damage, it is necessary to homogenise the sample. On the basis of the information available in the A-DC survey forms, four adjusting coefficients are introduced in the calculation of the damage index id, in accordance with
Table 2 - Definition of the structural damage levels based on the damage index id (Lagomarsino and Podestà, 2004b).
Level Damage Score Description
0 id ≤ 0.05 No damage: light damage only in one or two mechanisms 1 0.05 <id ≤ 0.25 Negligible to slight damage: light damage in some mechanisms 2 0.25 <id ≤ 0.40 Moderate damage: light damage in many mechanisms,
with one or two mechanisms active at medium level 3 0.40 <id ≤ 0.60 Substantial to heavy damage: many mechanisms have been
activated at medium level with severe damage in some mechanisms
4 0.60 <id ≤ 0.80 Very heavy damage: severe damage in many mechanisms, with the collapse of some macro-elements of the church 5 id > 0.80 Destruction: at least 2/3 of the mechanism exhibit
severe damage
(2) where:
- C1 takes into account the general state of maintenance of the church;
- C2 takes into account the type of damage (seismic damage, previous damage, aggravation);
- C3 takes into account the extension of the previous damage;
- C4 takes into account the urban context (if connected with other buildings).
The purpose of the coefficients is to obtain a damage index only related to earthquake effects, independently on other factors that may have influenced the church response. Values of coefficients adopted in the evaluation of the new damage index are reported in Table 3; considering that not all the A-DC survey forms included data needed to evaluate the coefficients, the sample was reduced to churches in which all information is available (386 out of 536 churches).
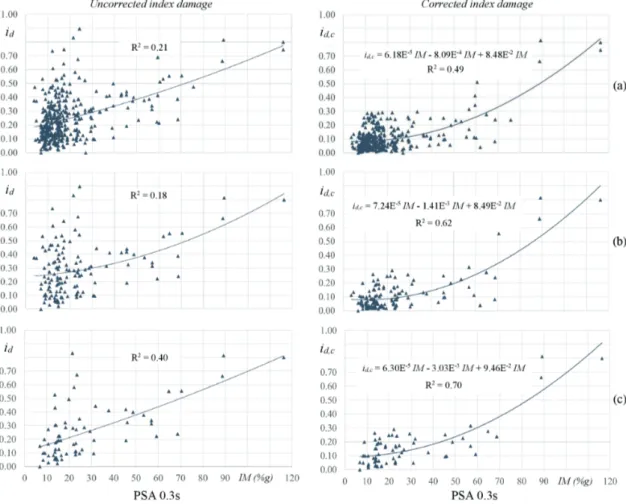
Comparisons between uncorrected id and corrected damage indexes id,c are reported in Fig. 10 as a function of the maximum PSA0.3 experienced by the building up to the time of inspection; these were obtained considering the reduced sample (Fig. 10a) and subsets constituted by single nave churches (Fig. 10b) and single nave churches only presenting an earthquake damage (Fig.
Fig. 10 - Comparisons between uncorrected (id) and corrected (id,c) damage indexes and the maximum PSA0.3: a) entire
10c). By applying coefficients C1-C4, to the reduced database, the determination coefficients R2
increase sensibly and the scattering of data reduces. Furthermore, for both the whole sample and the two subsets, a parabolic law appears to best fit the corrected observational data.
2.5. Vulnerability of the analysed sample
Starting from the post-processing of data from inspections of churches damaged by the 1997 Marche-Umbria earthquakes, Lagomarsino and Podestà (2004a, 2004b) defined vulnerability laws that express the expected average damage as a function of the EMS-98 macroseismic intensity
IMCS. If a suitable correlation law between intensities peak ground acceleration (PGA) and IMCS is assumed, the fragility functions may be evaluated in terms of IMCS. To this aim, many correlations may be found in the literature (Gómez et. al., 2007), usually in the form:
(3) where a1 and a2 are calibrated with specific reference to geographical areas. In the following, the correlation law by Faccioli and Cauzzi (2006) is adopted, for which a1 and a2 are 6.54 and 1.96, respectively.
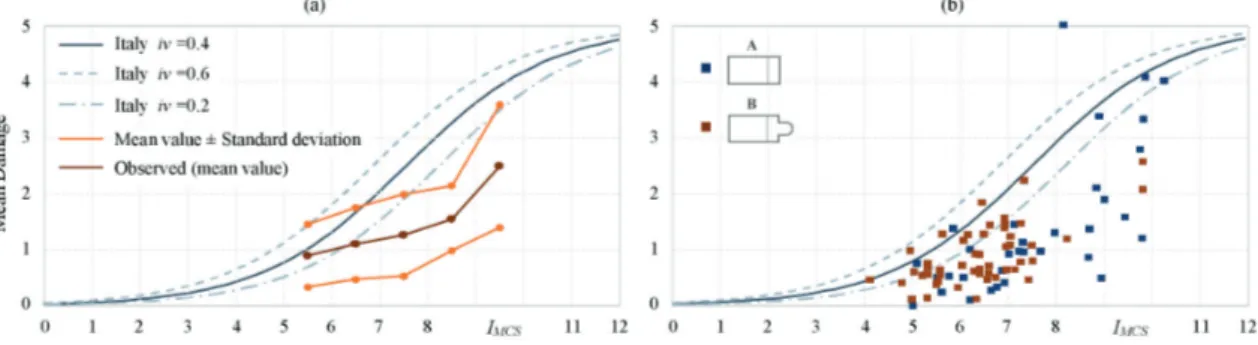
The observational damage data are compared with the empirically determined vulnerability curves proposed by Lagomarsino and Podestà (2004a, 2004b), assuming three different values of the vulnerability index (iv = 0.2, 0.4, and 0.6), within the following expression which provides the mean damage index µD as a function of the macro-seismic intensity IMCS:
(4) Fig. 11 compares vulnerability curves obtained from Eq. 4 with those obtained from the observational damage data considering both the whole sample of churches (Fig. 11a) and a subset constituted by single nave churches with or without the apse (Fig. 11b).
It can be observed that the estimate of the average damage is relatively correct for low macroseismic intensities, while for high values of intensity, the vulnerability index of the sample appears to be lower than that found by Lagomarsino and Podestà (2004a, 2004b), probably due to the lack of data relevant to churches that experienced high PGAs. Moreover, for churches characterised by a simple plan organization (i.e. single nave churches with or without apse) the
Fig. 11 - Comparison of vulnerability curves and curves observed from observational data for: a) the whole sample and b) single nave churches with or without the apse.
observed vulnerabilities are all below the curves proposed in the literature (Fig. 11b). In most churches of the sample seismic improvements were made following the Umbria-Marche 1997 earthquakes; although it is not possible to analyse the whole sample in this term (a partial list of the main churches subjected to seismic improvements after Umbria Marche 1997 event is only reported in RiMARCANDO 1997-2007 (2007), seismic improvements can provide a justification of the observed results.
3. Conclusion
The problem of post-processing damage data on architectural heritage obtained from survey following the seismic sequence of the 2016 central Italy earthquakes is addressed in this paper. In particular, a methodology is proposed for the processing of data and the interpretation of results, aimed at defining relationships between the observed damage and the seismic intensity.
The method is applied to a sample of churches of the Marche region, defining first relationships between the observed damage and the PSAs, corresponding to a period of 0.3 s. Correction coefficients of the damage index are introduced to account for the overall state of maintenance of the church as well as the type of damage observed, and parabolic laws are derived to correlate damage with the PSA0.3.
Finally, comparing vulnerability curves available in the literature with the average observed damage, a lower vulnerability of the churches of the sample is found, with respect to that resulting from studies following the 1997 Umbria-Marche earthquakes.
Acknowledgements. Technical inspections for the detection and assessment of damage to architectural
heritage, as well as results of this work, are part of the agreement between the DPC and the ReLUIS consortium, concerning the support offered by ReLUIS in the management of the earthquake emergency in central Italy.
REFERENCES
Casapulla C., Salzano P., Sandoli A., Argiento L.U., Ceroni F., Calderoni B. and Prota A.; 2017: Analisi statistica
del danno strutturale rilevato nelle chiese colpite dai terremoti centro Italia 2016-17. In: Proc. XVII Convegno
ANIDIS, Pistoia, Italy, 12 pp.
da Porto F., Silva B., Costa C. and Modena C.; 2012: Macro-scale analysis of damage to churches after earthquake in Abruzzo (Italy) on April 6, 2009. J. Earthquake Eng., 16, 739-758.
De Matteis G., Criber E. and Brando G.; 2016: Damage probability matrices for three-nave masonry churches in
Abruzzi after the 2009 L’Aquila Earthquake. Int. J. Archit. Heritage, 10, 120-145.
Table 3 - Definition of the coefficient C1-C4 for evaluation the new damage levels id,c.
Maintenance Status C1 Damage Identification C2
Good 1.00 DS 1.00
Fair 0.80 DS+A 0.70 Poor 0.60 DS+DP 0.60
Very Bad 0.40 DS+DP+A 0.50
Past Damage C3 Description C4
No 1.00 Isolated 0.50
Limited Damage 0.60 Connected 1.00
Extensive Damage 0.50
Doglioni F., Moretti A. and Petrini V. (a cura di): 1994: Le chiese e i terremoti: dalla vulnerabilità constatata nel
terremoto del Friuli al miglioramento antisismico nel restauro, verso una politica di prevenzione. Lint Editoriale
Associati, Trieste, Italy, 320 pp.
DPCM 23 febbraio 2006; 2006: Approvazione dei modelli per il rilevamento dei danni, a seguito di eventi calamitosi,
ai beni appartenenti al patrimonio culturale. G.U. 07.03.2006, n. 55, 26 pp.
Gómez Capera A.A., Albarello D. and Gasperini P.; 2007: Aggiornamento relazioni fra l’intensità macrosismica e
PGA. Progetto DPC-INGV S1, Deliverable D11, <esse1.mi.ingv.it/d11.html>.
Faccioli E. and Cauzzi C.; 2006: Macroseismic intensities for seismic scenarios estimated from instrumentally based
correlations. In: Proc. First European Conference on Earthquake Engineering and Seismology, paper n. 569.
Grünthal G.; 1998: European Macroseismic Scale 1998 (EMS-98). Cahiers du Centre Européen de Géodynamique et de Séismologie, Luxembourg, 15, 1-99.
Indirli M., Marghella G. and Marzo A.; 2012: Damage and collpse mechanisms in churches during the Pianura Padana
Emiliana earthquake. Energia Ambiente Innovazione, 11, 69-94.
INGV; 2012: Shake maps data <shakemap.rm.ingv.it/shake/index.html>.
Lagomarsino S.; 2012: Damage assessment of churches after L’Aquila earthquake (2009). Bull. Earthquake Eng., 10, 73-92.
Lagomarsino S. and Podestà S.; 2004a: Seismic vulnerability of ancient churches I. Damage assessment and emergency. Earthquake Spectra, 20, 377-394.
Lagomarsino S. and Podestà S.; 2004b: Seismic vulnerability of ancient churches II. Statistical analysis of surveyed
data and methods for risk analysis. Earthquake Spectra, 20, 395-412.
Lagomarsino S. and Podestà S.; 2004c: Damage and vulnerability assessment of the churches after the 2002 Molise,
Italy, Earthquake. Earthquake Spectra, 20, S271-S283.
Modello A-DC PCM-DPC MiBAC; 2006: Scheda per il rilievo del danno ai beni culturali - Chiese. <www.beniculturali. it>.
QGIS Development Team; 2015: QGIS geographical information system. Open Source Geospatial Foundation Project, <qgis.osgeo.org>.
RiMARCANDO 1997-2007; 2007: A 10 anni dal sisma. Ministero per i Beni e le Attività Culturali, Direzione Regionale per i Beni Culturali e Paesaggistici delle Marche, Bollettino n. 2, Edizione Speciale, 180 pp.
Sorrentino L., Liberatore L., Decanini L.D. and Liberatore D.; 2014: The performance of churches in the 2012 Emilia
earthquakes. Bull Earthquake Eng., 12, 2299-2331.
Taffarel S., Giaretton M., Da Porto F. and Modena C.; 2016: Damage and vulnerability assessment of URM buildings
after the 2012 northern Italy earthquakes. In: Proc. 16th International Brick and Block Masonry Conference,
Padova, Italy, 8 pp.
Corresponding author: Michele Morici
School of Architecture and Design, University of Camerino Viale della Rimembranza, 63100 Ascoli Piceno, Italy Phone: +39 0737 404249; e-mail: [email protected]