1
XXXII PhD Programme in Medical Sciences and Biotechnologies
(curriculum: Neoplastic, metabolic and age-related diseases)Department of Health Science
PhD Thesis
Targeted molecular characterization of
adult midline and circumscribed gliomas
for the identification of new potential
targets for personalized therapy
Tutor
Professor Renzo Luciano Boldorini
Candidate
Dr Elena Trisolini
3
INDEX
1. INTRODUCTION ... 4
1.1 Diffuse midline glioma ... 4
1.1.1 Diagnosis ... 7 1.1.2 Therapy ... 9 1.2 Circumscribed gliomas ... 11 1.2.1 Pylocitic Astrocytoma ... 11 1.2.2 Ependymoma ... 13 1.2.3 Ganglioglioma ... 15
1.2.4 Dysembryoplastic neuroepithelial tumour (DNET) ... 16
1.3 NTRK genes ... 16
1.4 FGFR1 gene ... 19
2. AIM OF THE STUDY ... 21
3. MATERIAL AND METHODS ... 22
3.1 Sample collection ... 22
3.1.1. Midline Gliomas ... 22
3.2.1 Circumscribed gliomas ... 22
3.2 Tissue microarray ... 23
... 24
3.3 DNA extraction and quantification ... 24
3.3 Sanger sequencing ... 24
3.4 Fluorescence in situ hybridization (FISH) ... 25
3.7 Statistical analysis ... 28
4. RESULTS ... 29
4.1 Molecular characteristics of French and Italian cohort of midline gliomas ... 29
4.2 NTRK gene analysis in MLG ... 36
4.2.1 NTRK1 status ... 36
4.1.2 NTRK2 and NTRK3 status ... 47
4.3 Molecular analysis in circumscribed gliomas76 ... 47
4.3.1 Clinico-pathological features of pilocytic astrocytomas, gangliogliomas, ependymomas and DNET ... 47
4.3.2 FGFR1 activating mutations in circumscribed gliomas ... 48
4.3.3 BRAF mutation analysis ... 49
Table 9. BRAF mutations’ distribution in pilocytic astrocytomas ... 50
5. DISCUSSION ... 52
6. FUTURE PERSPECTIVES ... 58
4
1. INTRODUCTION
1.1 Diffuse midline glioma
Diffuse midline gliomas (MLGs) are infiltrative gliomas, mainly with an astrocytic differentiation, which affect midline structures of central nervous system (CNS): cerebellum, ventricles, thalamus, hypothalamus, pineal region, pons, spinal cord and brainstem1. MLGs occur more frequently in paediatric patients and young adults, while in adults fewer than 10% of diffuse gliomas arise in midline structures.
MLG typically harbour a missense mutation, p.Lys27Met, in H3 histone family member 3A (H3F3A) and histone cluster 1 H3 family member B (HIST1H3B) genes. H3F3A (1q42.12) and HIST1H3B (6p22.2) genes encode variants of the histone H3 protein, which is responsible for chromatin structure and consequently for gene expression. While HIST1H3B mutations are anatomically restricted to brainstem2,3, H3F3A mutants have been reported in MLG of various locations2,4-9, and other histone variants (e.g. H3F3A p.Gly34Val) occur in a subset of hemispheric supratentorial pediatric high-grade gliomas2,3,8,10. In pediatric MLGs, mutations in histone H3 variants associate with more aggressive clinical phenotype and poorer prognosis6,8,11. Based on these observations, histone H3-mutant gliomas progressively emerged as a phenotypically and molecularly separated group of tumours. The WHO 2016 classification subsequently introduced “diffuse midline glioma, H3K27M-mutant” as a new grade IV entity, even in the absence of histopathological markers of anaplasia (i.e. mitotic figures, microvascular proliferation and necrosis)12.
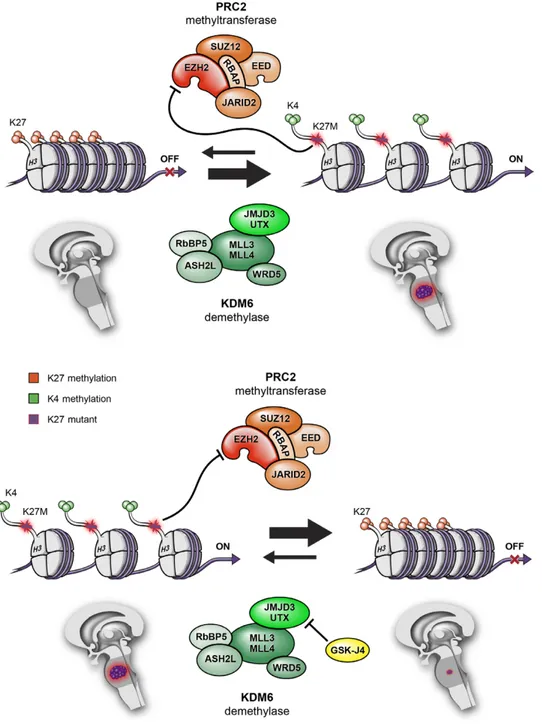
Histone protein mutations contribute to gliomagenesis in this subgroup of tumours. Histone proteins are modified by the polycomb repressive complex 2 (PRC2) methyltransferase and by lysine (K)-specific demethylase (KDM). PRC2 increases methylation of Lys27, which promotes a more compact and transcriptionally repressed chromatin state. Whereas, KDM demethylase complex removes methyl groups from Lys27, promoting an open and transcriptionally active chromatin state. Histone H3K27M mutant protein binds PRC2 histone methyltransferase and functionally inactivates it, leading to a global reduction of Lys27 methylation, thereby promoting an open chromatin structure that favours a deregulated gene transcription13 (Figure 1). Nowadays, an inhibitor (GSKJ4) of a protein composing KDM
5
demethylase complex is under study; this molecule is able to increases Lys27 methylation and so it suppresses gene expression and reduces tumour growth14.
Figure 1. Histone modifications by PRC2 methyltransferase and KDM demethylase activities, and associations with transcriptionally active versus inactive states13.
According to a 2016 WHO classification update15, the term “diffuse midline glioma, H3 K27M-mutant” should be reserved for tumours that are diffuse (infiltrating), midline (thalamus, brain stem, spinal cord, etc.), gliomas and harbouring H3K27M mutation; it is important to remark that not each CNS tumour that harbours H3K27M mutation is a diffuse midline glioma. Histologically, MLG can resemble astrocytic (30% of all
6
MLGs), oligodendrocytic or other CNS tumours. In the past was known that H3K27M mutation was exclusively of MLG, nowadays, there are a number of tumours that are not diffuse midline gliomas which reported the same H3K27M mutation, including ependymomas, pilocytic astrocytomas, pediatric diffuse astrocytomas and gangliogliomas15. Authors showed that there is a group of gliomas that displays high-grade histology and clinical features and imaging of diffuse midline gliomas but do not harbours H3K27M mutation; it has been proposed to introduce H3K27M-wild-type tumour entity into WHO classification of CNS tumours2.
In paediatric patients, MLGs have a more aggressive clinical phenotype and poorer prognosis, which is not associated with H3K27M mutation but probably with the age of onset. Indeed, studies confirm that there is no association between this mutation and a worst overall survival (OS) at any age. The poor prognosis is also due to the difficult access to tumour site for surgery16.
While few studies specifically investigated the molecular landscape of adult MLG, recent works suggested that this subset of tumours may present with phenotypic and molecular characteristics differing from both pediatric MLG and adult supratentorial gliomas. As an illustration, although H3F3A mutations have been reported in adult MLG of the thalamus, hypothalamus, pineal region, brainstem, cerebellum and spinal cord7,14,17-20, their prognostic significance in adults remains unclear17,18. Whole-exome sequencing analysis of 20 adult MLG identified recurrent mutations in TP53, H3F3A and ATRX while HIST1H3B and ACVR1 were not found21. Although less frequent, IDH1 and FGFR1 hotspot mutations represent particular interest in this population21,22, because small molecule inhibitors targeting these mutants are being developed and there is an urgent need for new treatments in this disease23,24.
Overall, the genomic landscape of adult MLG remains poorly understood, due to the rarity of the disease in this population and the lack of available histological material. Indeed, despite growing evidence indicating significant clinical and genomic heterogeneity among adult midline tumours25, the need for histological confirmation in presence of a typical radiological presentation is often debated, because of the morbidity and mortality of surgical procedures in midline locations and assumption that histological diagnosis would only have limited impact on therapeutic management20.
7
Other mutations in canonical cancer pathways frequently target the receptor tyrosine kinase RAS / PI3K pathway (e.g. mutations in PDGFRA, PIK3CA, PIK3R1, or PTEN; occurring in -50% of cases), the p53 pathway (e.g. mutations in TP53, PPM1D, CHEK2, or ATM; occurring in 70% of cases), and to a lesser extent the retinoblastoma protein pathway26-28. Activating mutations or fusions targeting FGFR1 were specifically identified in a small proportion of thalamic high-grade gliomas (10%)29. In contrast, recurrent mutations in ACVR1, the gene encoding the BMP receptor ACVR1, were detected in a subset (-20%) of diffuse intrinsic pontine gliomas (DIPGs), and seem to correlate with H3.1 mutations26-28.
Concerning structural variations, high-level focal amplifications detected in diffuse midline gliomas include amplification of PDGFRA (in as many as 50% of DIPGs), MYC/MYCN (in as many as 35%), CDK4/6 or CCND1-3(in 20%), ID2 (in 10%), and MET (in 7%), whereas homozygous deletion of CDKN2A/B or loss of RB1 or NF1 is detected only very rarely (in < 5% of cases)12. Fusion events involving the tyrosine kinase receptor gene FGFR1 occur in thalamic diffuse gliomas, and a small proportion (4%) of paediatric pontine gliomas have been found to carry neurotrophin receptor (NTRK) fusion genes. Common broad chromosomal alterations include single copy gains of chromosome 1q and chromosome 2. In addition, there may be a subset of pontine gliomas (as many as 20%) that harbour few copy number changes26,28,30.
1.1.1 Diagnosis
Main clinical signs and symptoms at diagnosis are progressive cognitive disorders and focal deficits, seizure (mainly in young patients), increase of intracranial pressure, cephalalgy, epilepsy and other behavioural disturbances31.
The first examination is a computed tomorgaphy (CT) to confirm the presence of a lesion. After a positive result, the patient is submitted to magnetic resonance imaging (MRI) with contrast to highlight the lesion and its morphology. Then to evaluate the metabolic status of the lesion, positron emission tomography (PET) with F-fluorodeoxyglucose contrast is assessed. Moreover, in low grade gliomas the uptake slightly increases compared to normal tissue, whereas in high grade gliomas, the uptake increases significantly. According to these findings, PET results allow glioma grading31,32.
8
For the characterization of the tumour, a needle biopsy is required for morphologic and molecular biology analyses. This procedure is usually reserved for patients with multiple co-morbidities whom could not tolerate a large cranial surgery or for those with unresectable tumours due to its location33.
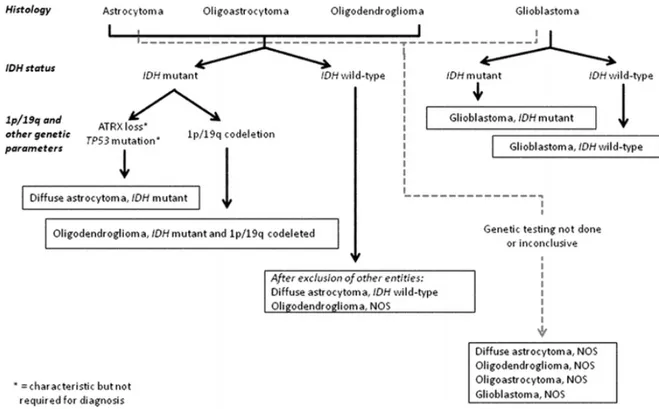
The algorithm below (Figure 2) shows the workflow assessed for an integrated diagnosis of glioma:
Figure 2. Algorithm to classify the diffuse gliomas based on histological and genetic features. Genetic
profile characterization is fundamental to achieve an “integrated” diagnosis. A similar flow can be followed for anaplastic level diffuse gliomas (Louis et al., 2016).
According to 2016 WHO and European Association for Neuro-Oncology (EANO) guidelines, investigations need to be performed as follows:
- IDH-status is evaluated by polymerase chain reaction (PCR) and direct sequencing; alternatively, immunohistochemistry (IHC) for IDH R132H is possible but negative cases need to be confirmed.
- ATRX loss and TP53 mutation are indirectly detected by IHC; their status is not required for the diagnosis, but it may be helpful to substantiate the diagnoses of IDH-mutant diffuse astrocytoma and anaplastic astrocytoma;
9
- 1p19q co-deletion is confirmed through a multilocus analysis, like Multiple Ligation-dependent Probe Amplification (MLPA);
- If IDH and 1p19q status are not available, the tumour is diagnosed as astrocytoma/anaplastic astrocytoma, NOS or oligodendroglioma/anaplastic oligodendroglioma, NOS or glioblastoma, NOS;
- H3K27M mutation can be detected by IHC using an antibody that recognizes the mutated protein or by PCR and direct sequencing.
Then other markers are evaluated to choose the appropriate treatment to administer to patients, like MGMT-promoter methylation status.
1.1.2 Therapy
Targeted therapy: drugs on clinical trials
NTRK inhibitors: ongoing trials are testing small-molecules tyrosin kinase inhibitors that block Trk activity. The most commonly studied drugs are Entrectinib and Larotrectinib, which display a significant antitumour activity with acceptable toxicity profile. Larotrectinib is a pan-Trk inhibitor with high specificity34 and Entrectinib binds and inhibits TrkA, TrkB, TrkC, ROS1 and ALK35.
Studies performed on gliomas and non-gliomas cases reported important findings: a small percentage of patients showed NTRK fusion as unique genetic alteration known, leading to a therapeutically relevant outcome in the future36.
FGFR inhibitors: inhibitors of FGFR receptor are on clinical evaluation, one of them is Erdafitinib (JNJ-42756493), an oral ATP-competitive pan-FGFR selective inhibitor, which blocks tyrosine phosphorylation of activated FGFR. There are many other molecules that are under pre-clinical and clinical trials that, until now, are displaying good outcomes. The future is to develop new therapeutic strategies for IDH-WT patients which display a poor prognosis37,38.
Surgical resection, radio and chemotherapy
Based on the localization of the gliomas, surgical resection is normally performed. After the resection, symptomatology generally disappears, with a good impact on patient quality of life. The depth of resection is done in order to preserve motor and intellective abilities, or at least, limiting the neurological damage.
10
AIOM 2016 guidelines38 recommend an adjuvant chemotherapy and radiotherapy (STUPP protocol). As chemotherapeutic agent is administered TMZ, which is an alkylating agent that damages the double-helix of DNA, resulting in apoptosis of tumour cells.
11
1.2 Circumscribed gliomas
Circumscribed gliomas -pilocytic astrocytomas (PA), gangliogliomas (GG), ependymomas (EP) and dysembryoplastic neuro-epithelial tumours (DNET)- are mostly low-grade tumours but may progress to anaplasia39. These tumours have lower genetic complexity40 than diffuse gliomas and therefore could be better candidate for targeted therapies, when complete surgical resection is not feasible.
1.2.1 Pylocitic Astrocytoma
Pilocytic astrocytomas are the most common glioma in children and adolescents, and affect males slightly more often than females (it accounts for 33.2% of all gliomas in the 0-14 years age group and 17.6% of all childhood primary brain tumours41). They are mainly located in the cerebellum and cerebral midline structures but can be found anywhere along the neuraxis; in the paediatric population, more tumours arise in the infratentorial region. Preferred sites include the optic nerve (optic nerve glioma), optic chiasm/hypothalamus, thalamus and basal ganglia, cerebral hemispheres, cerebellum, and brain stem and less frequently in the spinal cord12.
They are generally circumscribed and slow-growing, and may be cystic. Pilocytic astrocytoma largely behaves as is typical of a WHO grade I tumour12, and patients can be treated by surgical resection. However, complete resection may not be possible in some locations, such as the optic pathways and the hypothalamus. Pilocytic astrocytomas, particularly those involving the optic pathways, are a hallmark of neurofibromatosis type 1 (NF1).
In adults, pilocytic astrocytoma tends to arise about a decade earlier (mean patient age: 22 years) than does WHO grade II diffuse astrocytoma, but relatively few arise in patients aged > 50 years.
This astrocytic tumour of low to moderate cellularity often has a biphasic pattern, with varying proportions of compacted bipolar cells with Rosenthal fibres and loose-textured multipolar cells with microcysts. The biphasic pattern is best seen in cerebellar tumours. However, pilocytic astrocytoma can exhibit a wide range of tissue patterns, sometimes several within the same lesion. Although many pilocytic astrocytomas are benign, some show considerable hyperchromasia and pleomorphism. Rare mitoses are present, but brisk mitotic activity, in particular diffuse
12
brisk mitotic activity, characterizes anaplastic change, which has prognostic implications42.
Genetic profile
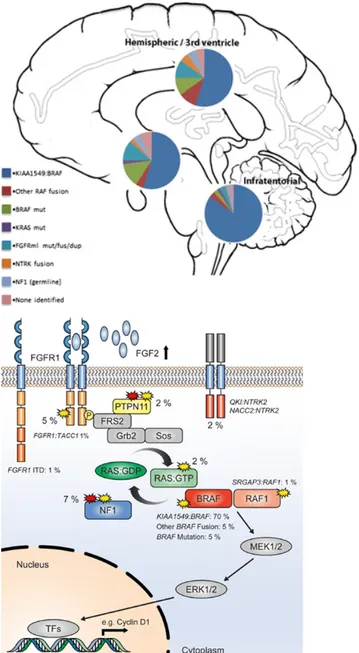
The most frequent abnormality in pilocytic astrocytomas overall (found in > 70% of all cases) is an approximately 2 Mb duplication of 7q34, encompassing the BRAFgene. This is a tandem duplication resulting in a transforming fusion gene between KIAA1549 and BRAF43. The N-terminus of the KIAA1549 protein replaces the N-terminal regulatory region of BRAF, retaining the BRAF kinase domain, which is consequently uncontrolled and constitutively activates the MAPK pathway43. This abnormality is found at all anatomical locations, but is most frequent in cerebellar tumours and somewhat less common at other sites. The gene fusions involve nine different combinations of KIAA1549 and BRAF exons, making identification by RT-PCR or immunochemistry difficult, resulting in many centres accepting the demonstration of a duplication at 7q34 (usually using FISH probes) as evidence of the KIAA1549-BRAF fusion. In addition to harbouring BRAF fusion genes, essentially all pilocytic astrocytomas have been shown to have an alteration affecting some component of the MAPK pathway44. These alterations include the well-documented NF1 mutations, the hotspot BRAF mutation commonly known as the V600E mutation, KRAS mutations, alterations of NTRK-family receptor kinase genes and recurrent aberrations affecting the FGFR1; they include hotspot point mutations (N546K and K656E), FGFR1-TACC1 fusions similar to those seen in adult glioblastoma45.
Concerning genetic susceptibility, pilocytic astrocytomas are the principal CNS neoplasm associated with neurofibromatosis 1 (NF1) and approximately 15% of individuals with NF1 develop pilocytic astrocytomas, particularly of the optic nerve pathways (optic pathway glioma), but other anatomical sites can also be affected. Conversely, as many as one third of all patients with a pilocytic astrocytoma of the optic nerve have NF112.
13
Figure 3 Left: Estimated frequency of particular MAPK pathway alterations in different anatomic locations. Right: Summary showing the MAP kinase pathway with the approximate incidence of the different mutations in percent46.
1.2.2 Ependymoma
Ependymomas are well-circumscribed tumours usually arising in or near the ventricular system or spinal canal, in the cerebral hemispheres, or at extra-CNS sites. Overall, 60% of the tumours develop in the posterior fossa, 30% in the supratentorial
compartment, and 10% in the spinal canal
[http://seer.cancer.gov/archive/csr/1975_2004].
Ependymomas can develop in patients of any age, with reported patient ages ranging from birth to 81 years [http://www.cbtrus.org]. However, incidence is greatly
14
dependent on histological variant, molecular group, and location. Posterior fossa ependymomas are most common among children, with a mean patient age at presentation of 6.4 years, and spinal tumours dominate a second age peak at 30-40 years. Supratentorial ependymomas affect paediatric as well as adult patients12. The 10-year overall survival (OS) is about 64% in pediatric patients and ranges from 70% to 89% in adult patients [http://www.cbtrus.org]. Tumours in infancy are associated with a particularly poor survival rate of only 42%– 55% at 5 years after diagnosis. The extent of surgical resection has for a very long time been the only clinical prognostic marker in EPN known to be associated with survival47. The current standard of care includes maximal safe surgical resection, followed by focal radiotherapy47.
Classic ependymoma is a well-delineated glioma with monomorphic cells characterized by a variable density and round to oval nuclei with speckled nuclear chromatin. The key histological features are perivascular anucleate zones (pseudorosettes) and (true) ependymal rosettes; cell density can vary considerably in ependymoma.
A diagnosis of anaplastic ependymoma can be confidently made when an ependymal tumour shows a high cell density and elevated mitotic count alongside widespread microvascular proliferation and necrosis. Like the classic tumour, anaplastic ependymoma rarely invades adjacent CNS parenchyma to any significant extent. Traditionally, classic ependymoma and anaplastic ependymoma are considered to correspond histologically to WHO grades II and III, respectively. However, no association between gradeand biological behaviour or survival has been definitively established48.
Genetic profile
Molecular alterations are very common in ependymoma and comprise cytogenetic, genetic, epigenetic, and transcriptomic changes. Ependymomas display a broad range of cytogenetic aberrations, most commonly gains of chromosomes 1q, 5, 7, 9, 11, 18, and 20 and losses of chromosomes 1p, 3, 6q, 6, 9p, 13q, 17, and 2249,50.
Using DNA methylation profiling, several studies have provided support for the existence of distinct molecular groups among ependymomas51,52. In a large cohort (containing > 500 tumours), three groups were identified in each of the three CNS
15
compartments (i.e. supratentorial, posterior fossa, and spinal)52. Tumours with a subependymomatous morphology were classified into separate spinal (SP), posterior fossa (PF), and supratentorial groups (ST), called SP-SE, PF-SE, and ST-SE, respectively. Fusion genes involving either RELA or YAP1 characterize the other two supratentorial groups: ST-EPN-RELA and ST-EPN-VAP1. Supratentorial ependymomas are characterized by a recurrent structural variant, the C11orf95-RELA fusion gene, which is a by-product of chromothripsis and occurs in 70% of paediatric supratentorial ependymomas.
1.2.3 Ganglioglioma
Ganglioglioma is a well-differentiated, slow-growing glioneuronal neoplasm composed of dysplastic ganglion cells (i.e. large cells with dysmorphic neuronal features, without the architectural arrangement or cytological characteristics of cortical neurons) in combination with neoplastic glial cells. Gangliogliomas preferentially present in the temporal lobe (70% of cases) of children or young adults with early-onset focal epilepsy but these tumours can occur throughout the CNS, including brain stem, cerebellum, spinal cord, optic nerves, pituitary, and pineal gland12,53.
BRAF V600E mutation occurs in approximately 25% of gangliogliomas, whereas IDH mutation or combined loss of chromosomal arms 1p and 19q exclude a diagnosis of a ganglioglioma. The prognosis is favourable, with a recurrence-free survival rate as high as 97% at 7.5 years12.
In anaplastic gangliogliomas, malignant changes almost invariably involve the glial component and include increased cellularity, pleomorphism, and increased numbers of mitotic figures. Other potential anaplastic features include vascular proliferation and necrosis54.
Genetic profile
BRAF V600E mutation is the most common genetic alteration in gangliogliomas, occurring in 20-60% of investigated cases55,56. This broad range of reported mutation frequency is probably related to the sensitivity of the detection methods used, as well as the patient age range in the investigated series, given that BRAF point mutations are particularly frequent in younger patients57. BRAF V600E is not specific for
16
gangliogliomas and it is also observed in other brain tumours, in particular pleomorphic xanthoastrocytomas, pilocytic astrocytomas, and dysembryoplastic neuroepithelial tumours55,56. V600E-mutant BRAF protein is localized mainly to ganglion cells, but can also be found in cells of intermediate differentiation, as well as in the glial compartment, suggesting that ganglion and glial cells in ganglioglioma may derive from a common precursor cell57.
1.2.4 Dysembryoplastic neuroepithelial tumour (DNET)
DNET is a benign glioneuronal neoplasm typically located in the temporal lobe of children or young adults with early-onset epilepsy, predominantly with a cortical location and a multinodular architecture, and with a histological hallmark of a specific glioneuronal element characterized by columns made up of bundles of axons oriented perpendicularly to the cortical surface. These columns are lined by oligodendrocyte-like cells embedded in a mucoid matrix and interspersed with floating neurons. If only the specific glioneuronal element is observed, the simple form of DNET is diagnosed. Complex variants of DNET additionally contain glial tumour components, often with a nodular appearance. Long-term follow-up after epilepsy surgery shows an excellent outcome; recurrence or progression is exceptional12.
Genetic profile
Paediatric DNETs have been shown to have stable genomes58, whereas recurrent gains of whole chromosomes 5 and 7 were found in approximately 20% and 30% of cases, respectively, in a series of adult DNETs59. As in other glioneuronal tumours, recurrent BRAF V600E mutations were identified in 30% of DNETs. These mutations were associated with activation of mTOR signalling60. Neither TP53 mutations nor IDH1/IDH2 mutations or H3K27M mutations have been detected in DNETs12. Similarly, codeletion of whole chromosome arms 1p/19q has not been demonstrated in DNET58,59.
1.3 NTRK genes
The tropomyosin receptor kinase (Trk) family comprises 3 transmembrane proteins named TrkA, TrkB and TrkC receptors that are encoded by neurotrophic tyrosine receptor kinase 1, NTRK1 (chromosome 1q23.1), NTRK2 (chromosome 9q21.33) and
17
NTRK3 genes (chromosome 15q25.3), respectively. Gene fusions involving NTRK genes encode chimeric Trk proteins with constitutively activated or overexpressed kinase function conferring oncogenic potential61. NTRK gene fusions are found in many human cancers including tumours of the CNS, mainly in high grade gliomas, referring to anaplastic astrocytomas, anaplastic oligodendrogliomas (both WHO grade III) and in GBMs (WHO grade IV)62,63.
Trks are tyrosine kinases receptors expressed in human neuronal tissue and involved in development and function of the nervous system through activation by neurotrophins (NTs). Trks are structured with an extracellular ligand binding domain, a transmembrane region and an intracellular tyrosin kinase domain. The binding of the ligand to the receptor triggers the dimerisation of the receptors and phosphorylation of specific tyrosine residues in the intracytoplasmic kinase domain.
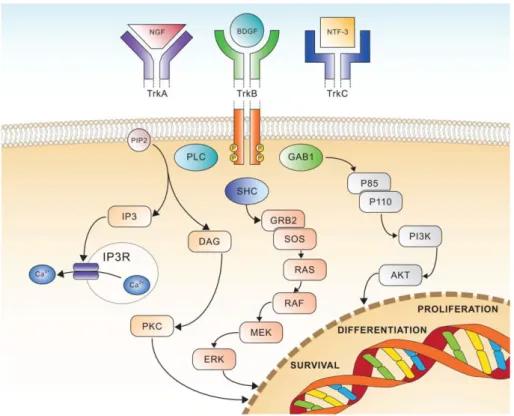
TrkA ligand is nerve growth factor (NGF) which activates MAPK pathway and ERK signalling (Figure 4). Otherwise this ligand-receptor interaction activates PLCγ and PI3K pathways. These are mechanisms that promote survival, differentiation, cell growth and preventing apoptosis61.
TrkB is bound by brain-derived growth factor (BDGF), and NT-4 and NT-5 whereas TrkC couples NT-3. These latter receptors activate RAS/MAPK/ERK or PLCγ or PI3K pathways resulting in signal transduction pathways leading to proliferation, differentiation and survival (Figure 4)63.
18
Figure 4. Schematic view of Trk receptors signalling, showing the three major pathways involved in cell differentiation, proliferation and survival63.
NTRK translocations have been found in many tumours and involve the 3’ region of the NTRK gene, which contains exons that encode the transmembrane domain (TM) and the tyrosine kinase domain (TK). The 3’ region joins with a 5’ sequence of a fusion partner gene by a chromosomal rearrangement. More precisely, the ligand binding domain is replaced by 5’ fusion partner. When the fusion gene is transcribed, it gives rise to an oncogenic chimera that is a constitutively activated or overexpressed kinases63.
NTRK gene fusion have been found initially in paediatric high grade gliomas with a recurrence of 40%28 and have been demonstrated that NTRK3 is rearranged with ETS variant 6 (ETV6) gene (mapped on 12p13.2 and encoding for a transcription factor), while NTRK1 with tropomyosin 3 (TPM3) gene (located on chromosome 1q21.3), both these chimeric genes act as oncogenes62. Further studies demonstrated the presence of these translocations also in low grade pediatric gliomas and in adult high grade gliomas.
The gene fusions observed in high grade gliomas patients are: - TPM3- NTRK1; NFASC-NTRK1; BCAN-NTRK1 in GBMs;
19
- AGBL4-NTRK2; VCAN-NTRK2; VCL-NTRK2 in GBMs; - NACC2-NTRK2; QKI-NTRK2 in astrocytomas; - ETV6-NTRK3; BTBD1-NTRK3 in GBMs.
All of them confers an oncogenic behaviour to fusion proteins28.
NTRK gene fusions are common in children affected by diffuse intrinsic pontine glioma (DIPG)28. NTRK fusion genes in children <3 years old affected by high grade gliomas are associated to the paucity of additional mutations, and the rapid tumour onset, strongly suggest that these fusion genes are potent oncogenic drivers in early postnatal brain tumour development. Recently, the identification of NTRK fusions, also in other solid tumours, come into focus due to the availability of targeted therapies like NTRK inhibitors63.
1.4 FGFR1 gene
FGFR genes control many biological functions, including cell proliferation, survival, and cytoskeletal regulation. FGFRs signaling is important during embryonal development of the CNS, and as a survival mechanism for adult neurons and astrocytes and promote self-renewal and fate specification of neural stem cells64.
In many cancers, FGFRs aberrations have been implicated in tumour development and progression65,66, and include FGFRs overexpression, amplification, mutations, splicing isoform variations, and FGFRs translocations67. While FGFRs genomic alterations have been identified in many solid tissue cancers, such events remain rare in glioblastoma (GBM)68. Nonetheless, FGFRs expression changes in astrocytes can lead to malignant transformation and GBM progression due to the activation of mitogenic, migratory, and antiapoptotic responses69. Of note, fusions between FGFRs and TACCs (transforming acidic coiled-coil containing proteins) genes were shown to be oncogenic in GBM70, and occur in about 3% of GBM patients68. Whole-genome analyses of patient samples have revealed that the number of FGFRs mutations and amplifications are generally very low in GBM (FGFR1: 51/3068 samples, FGFR2: 12/2662; FGFR3: 16/2887; FGFR4: 9/2456; cancer.sanger.ac.uk).
Moreover, the expression of FGFR1 increases with WHO grade in astrocytomas, and increased FGFR1 levels in GBM are not due to amplification of the FGFR1 gene64.
20
Functionally, FGFR1 expression in malignant glioma has been associated with increased migration of cancer cells71. In this study, a high expression of EPHA4 in glioma cells was found to potentiate FGF2–FGFR1 signaling and promoted cell growth and migration through the AKT/MAPK and RAC1/CDC42 pathways, respectively. Loilome and colleagues72 identified FGFR1 as a potential transducer of FGF2 effects on glioma cell proliferation, but whether other FGFRs also contribute was not directly tested. Nevertheless, the pharmacological inhibition of FGFRs signaling significantly reduced tumour cell growth in a range of established and patient-derived glioma lines. The malignancy-promoting effects of FGFR1 were further demonstrated in a study that found FGFR1 signaling promoting radioresistance in glioma cell lines through PLC1γ and HIF1α73. FGFR1 expression is regulated by the stem-cell associated transcription factor ZEB1, suggesting that FGFR1 may be associated with GBM cancer stem cells. A comprehensive analysis of the functions of FGFR1-3 in GBM found that FGFR1 indeed is preferentially expressed on GBM cancer stem cells, where it regulates the expression of the critical stem cell transcription factors SOX2, OLIG2, and ZEB1, thereby promoting tumourigenicity in vivo74. In summary, FGFR1 is a key regulator of tumour growth, invasion, therapy resistance, and cancer stemness in malignant glioma.
21
2. AIM OF THE STUDY
Since midline gliomas are one of the more aggressive tumours of CNS and generally unresectable, the aim of this study is to contribute to unravel the genomic landscape of this heterogeneous group of gliomas in order to better define the prognostic value of molecular biomarkers and identify new therapeutic strategies that could improve patient care. Recently, a new class of tyrosine kinase inhibitors has been introduced in clinical trials. For this reason, we investigated the presence of FGFR1 mutations and NTRK gene rearrangements in order to explore the frequency, the possible correlation with clinical, histologic and genomic features and also the feasibility of testing in the diagnostic routine analysis to allow a possible future use of targeted therapies in clinical practice.
Moreover, since there is a scant literature about FGFR1 mutation rate in rarer CNS tumours like pilocytic astrocytoma, ganglioglioma, dysembryoblastic neuroepithelial tumour and ependymoma and also specific inhibitors are available in clinical trials, our idea is to investigate these mutational hotspots in a cohort of circumscribed gliomas. This information could be helpful in defining different therapeutic strategies when surgery is not feasible.
22
3. MATERIAL AND METHODS
3.1 Sample collection
3.1.1. Midline Gliomas
Patients (>15 years) with diagnosis of MLG were retrospectively identified from each institution’s databases (OncoNeuroTek tumour bank, GH Pitié-Salpêtrière, (Paris, France) and AOU Maggiore della Carità, SCDU Anatomia Patologica (Novara, Italy)) between 1996 – 2017 for the French cohort and from 1993 to 2017 for the Italian cohort. For two patients (Italian cohort) the primary tumour and the recurrent tumour were collected.
Inclusion criteria were as follows:
(1) tumour arising in midbrain location (thalamus, hypothalamus, pineal region, brainstem, cerebellum or spinal cord), verified on neuroimaging at diagnosis;
(2) histopathological confirmation of diffuse glioma according to WHO 2016 classification;
(3) available follow-up data.
All tumour samples underwent histopathological review.
The French cohort has been analyzed previously75 to the Italian one and it has been considered as a starting point for subsequent analyses.
3.2.1 Circumscribed gliomas
Patients (>15 years) with diagnosis of pilocytic astrocytoma (PA), ganglioglioma (GG), dysembryoblastic neuroepithelial tumour (DNET) and ependymoma (EP) were retrospectively identified from each institution’s databases (Onconeurotek tumour bank GH Pitié-Salpêtrière, (Paris, France), and “AOU Maggiore della Carità, SCDU Anatomia Patologica (Novara, Italy)) according to the histopathological diagnosis. All tumour samples underwent histopathological review.
All tumour samples and clinical data were collected in accordance with the tenets of the Declaration of Helsinki.
23
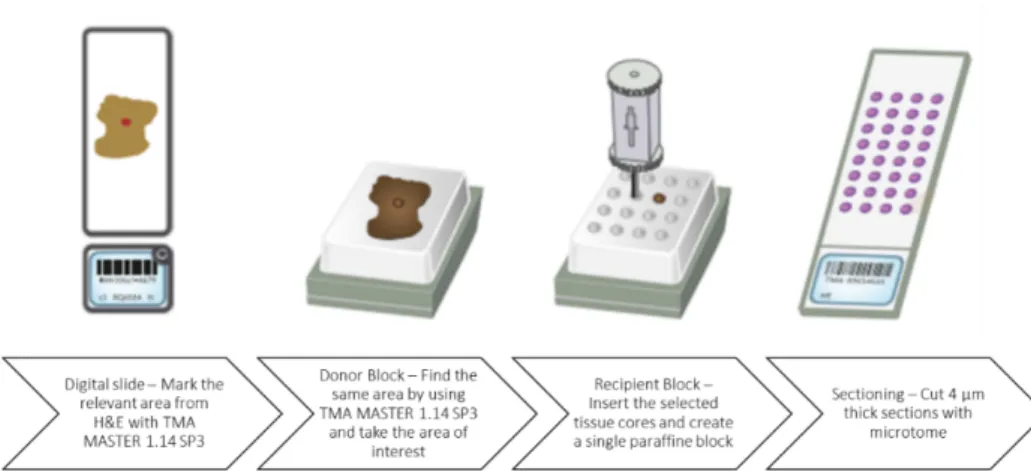
3.2 Tissue microarray
Tissue microarray (TMA) technique allow to handle up to several samples in one block or in one slide as it may contain hundreds of small different and representative tissue samples on a single paraffin block. These samples are obtained by the extraction of a tissue core of 1.5 mm of diameter, by using a holed needle, from “donor blocks” and re-embedded all together in a single empty block, called “recipient block”, at defined coordinates. In the array are also put other tissues (like liver) as references for the orientation of the array.
At first, haematoxylin-eosin (H&E) stained slides of each sample that will be included in the TMA are required to select the most significant tumour areas avoiding normal brain tissue, necrosis or haemorrhagic regions. For each sample, 1 to 3 areas have been selected for TMA construction by marking on the H&E slide, depending on the extension of the tumour area. The marked H&E slide is necessary for the alignment of the selected areas to the corresponding FFPE block. The alignment is done through a PC connected to the instrument TMA Master (3DHISTECH LTD) and the software used is TMA Master 1.14 SP3 (3DHISTECH LTD). After that, the same instrument takes tissue cores from FFPE samples (donor blocks), and then all the cores are re-embedded in one single recipient block.
TMA was constructed only for midline gliomas belonging to the Italian cohort. In our recipient block are present 107 samples cores and 8 liver cores used as orientation references.
TMA construction was performed by the team of Dr. Milo Frattini at Istituto Cantonale di Patologia (Locarno, Switzerland).
For the following steps, 4 µm sections from the recipient block are cut using the microtome and put on a positively charged glass slide in order to perform FISH analysis and immunohistochemistry stainings.
24
3.3 DNA extraction and quantification
Genomic DNA of GH Pitié-Salpêtrière’s cases was extracted from formalin-fixed paraffin-embedded (FFPE) or frozen samples, as previously described75. Genomic DNA of patients from Maggiore della Carità Hospital were extracted from five 5μm sections of FFPE samples by the GeneRead DNA FFPE Kit (Qiagen) on the QIAcube automatic extractor (Qiagen) according to the manufacturer’s protocol.
3.3 Sanger sequencing
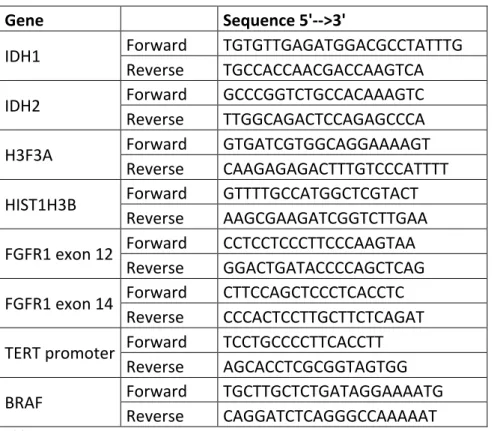
Hotspot mutation regions of IDH1 (codon 132), IDH2 (codon 172), TERT promoter (positions -250 and -228), FGFR1 exons 12 (codon 546) and 14 (codon 656), H3F3A (codons 27 and 34), HIST1H3B (codon 27) and BRAF exon 15 (codon 600) were amplified by standard PCR amplification and sequenced by Sanger sequencing. Primer sequences are reported in Table 1.
25
Gene Sequence 5'-->3'
IDH1 Forward TGTGTTGAGATGGACGCCTATTTG
Reverse TGCCACCAACGACCAAGTCA
IDH2 Forward GCCCGGTCTGCCACAAAGTC
Reverse TTGGCAGACTCCAGAGCCCA
H3F3A Forward GTGATCGTGGCAGGAAAAGT
Reverse CAAGAGAGACTTTGTCCCATTTT
HIST1H3B Forward GTTTTGCCATGGCTCGTACT
Reverse AAGCGAAGATCGGTCTTGAA
FGFR1 exon 12 Forward CCTCCTCCCTTCCCAAGTAA
Reverse GGACTGATACCCCAGCTCAG
FGFR1 exon 14 Forward CTTCCAGCTCCCTCACCTC
Reverse CCCACTCCTTGCTTCTCAGAT
TERT promoter Forward TCCTGCCCCTTCACCTT
Reverse AGCACCTCGCGGTAGTGG
BRAF Forward TGCTTGCTCTGATAGGAAAATG
Reverse CAGGATCTCAGGGCCAAAAAT
Table 1. Primers’ sequences
All PCR amplifications were performed at 3 minutes at 94°C; 35 cycles at 94°C 15 seconds, 60°C 45 seconds, 72°C 1 minute, with a final step at 72°C for 8 minutes. PCR reactions were set up with AmpliTaq Gold 360 MasterMix (Thermo Fisher) 1x, 500nM of each primer and only for TERT promoter amplification, 10% 360 GC enhancer (Thermo Fisher).
Sequencing reactions were performed with BigDye Terminator v.1.1 (Thermo Fisher) and analysed on the sequencer 3130 Genetic Analyser (Applied Biosystems).
3.4 Fluorescence in situ hybridization (FISH)
FISH analyses were perfomed by using NTRK1, NTRK2 and NTRK3 break-apart probes (ZytoLight SPEC Dual Color Break Apart probes, ZytoVision).
NTRK1 probe is a mixture of two direct labelled probes hybridizing to the 1q22-q23.1 band (Figure 6). The green fluorochrome direct labelled probe hybridizes proximal and the red fluorochrome direct labelled probe hybridizes distal to the NTRK1 gene.
26
NTRK2 probe is a mixture of two direct labelled probes hybridizing to the 9q21.32-q21.33 band (Figure 7). The green fluorochrome direct labelled probe hybridizes proximal to the NTRK2 breakpoint region at 9q21.32-q21.33, the red fluorochrome direct labelled probe hybridizes distal to the NTRK2 breakpoint region at 9q21.33.
NTRK3 probe is a mixture of two direct labelled probes hybridizing to the 15q25.3-q26.1 band (Figure 8). The orange fluorochrome direct labelled probe hybridizes proximal to the NTRK3 breakpoint region at 15q25.3, the green fluorochrome direct labelled probe hybridizes distal to the NTRK3 breakpoint region at 15q25.3-q26.1. The result interpretation is equal for all the 3 probes. If there is a translocation, the 2 fluorescent signals (green and red) are separated and there are 2 distinct colours coupled with a fusion signal corresponding to the wild-type allele. If there is no translocation the 2 signals appear as a fusion signal, for a total of 2 fusion signals/cell.
FISH protocol
4 µm thick sections of the FFPE tissue or TMA need to be cut and put on polarized (positively charged) slides. For each patient or TMA, 3 sections were cut, 1 for each gene analysis (NTRK1, NTRK2 and NTRK3).
Deparaffination: slides are incubated into a dry heat oven at 60°C overnight (ON). The
day after, tissues are re-hydrated through xylene and decreasing alcoholic series (10’ xylene, 10’ xylene, 5’ 100% alcohol, 5’ 95% alcohol, 5’ 80% alcohol, 5’ 75% alcohol, 5’ deionized water).
Pretreatment: incubation in pre-heated Heat Pretreatment Solution (ZytoLight
FISH-Tissue Implementation Kit, ZytoVision) at 92°C for 20’. Then the slides are brought to
Figure 6. NTRK1 probe map (not to
scale).
Figure 7. NTRK2 probe map (not to
scale).
Figure 8. NTRK3 probe map (not to
27
room temperature (RT) in deionized water for 5’. Subsequently, the slides are air-dried.
Tissue digestion: incubation with Pepsin Solution (ZytoLight FISH-Tissue
Implementation Kit, ZytoVision) is performed for 4’-7’ at 37°C in a hybridizer (TopBrite™, Resnova) with humidity chamber. After that slides are washed in Wash Buffer SSC (ZytoLight FISH-Tissue Implementation Kit, ZytoVision) for 5’ at RT and then 5’ in deionized water. Tissues are dehydrated (1’ 75% alcohol, 1’ 80% alcohol, 1’ 95% alcohol, 1’ 100% alcohol), then DAPI and coverslips are applied, and tissue digestion is checked by fluorescence microscope. If the tissue is digested enough (only nuclei are visible without cytoplasm and membranes) DAPI and coverslips are removed with Wash Buffer SSC (ZytoLight FISH-Tissue Implementation Kit, ZytoVision) for 5’ at RT and 5’ in deionized water. Since the probes used are hydrophobic, it is necessary to dehydrated through increasing alcoholic series (1’ 75% alcohol, 1’ 80% alcohol, 1’ 95% alcohol, 1’ 100% alcohol). Then sections are air-dried.
Probe hybridization: 5 µl of each probe are applied for each section (protecting from
light) coverslip is applied and sealed with Fixo-gum (Marabu, Germany) to keep the probe on the section and avoid its evaporation. Glass slides are put into the hybridizer (TopBrite™) with humidity chamber and denaturated for 10’ at 75°C and then hybridized at 37°C ON.
Stringency washes and mounting: the day after, coverslips are removed and stringency
washes are performed with 1X Wash Buffer SSC (ZytoLight FISH-Tissue Implementation Kit, ZytoVision), 2x5’at 37°C. Then tissues are dehydrated (1’ 75% alcohol, 1’ 80% alcohol, 1’ 95% alcohol, 1’ 100% alcohol), air-dried and counterstained with DAPI. FISH are ready and fluorescence can be detected through fluorescence microscope.
Fluorescence acquisition: fluorescent signals were acquired by using the Axioplan2
microscope (Zeiss) coupled with AxioCam HRm (Zeiss) camera and AxioVision software (Zeiss) for images acquisition. We acquired 3 fluorescences (FITC, Rhodamine and DAPI channels) for each high-power field at 63x (oil immersion). For each sample, we analysed at least 6 high-power fields and a minimum of 100 cells for each case across all the respective cores in the TMA.
28
Up to now, there are not present any guidelines that establish a specific cut-off (% positive cells) for NTRK rearrangements. We considered as positive, cases with any percentage of positive cells; positivity is considered when contiguous cells report a signal pattern consisting of one orange/green fusion signal, one separate orange signal and one separate green signal (ZytoVision).
3.5 Immunohistochemistry
ATRX expression analysis in samples of the Italian cohort were performed by immunohistochemistry on a Ventana BenchMark ULTRA automated platform (Roche Diagnostics) coupled with ultraView Universal DAB Detection Kit (Ventana Medical Systems – Roche). A rabbit polyclonal antibody (HPA001906, Sigma-Aldrich) was used at 1:400 dilution, 90’ antigen retrieval with CC1 buffer (Ventana Medical Systems – Roche), 60’ antibody incubation and signals were amplified with the Amplification kit (Ventana Medical Systems – Roche).
3.6 Other analyses
Cases belonging to the French cohort of MLG were previously analysed for ATRX and p53 nuclear expression by immunohistochemistry, CDKN2A/p16 loss and EGFR amplification at GH Pitié-Salpêtrière (Paris)75.
3.7 Statistical analysis
Continuous variables have been described with mean and standard deviation, categorical variables with counts and percentages. The distributions of the categorical variables within the groups were analysed with the chi-square test or with the Fisher exact test.
The distributions of continuous variables within the groups of interest were analysed with the independent t-student test.
The survival curves were obtained according to the Kaplan Meier method and were compared with the log-rank test.
P-values <0.05 were considered statistically significant. All the analyses were performed with the STATA15 software.
29
4. RESULTS
4.1 Molecular characteristics of French and Italian cohort of midline gliomas
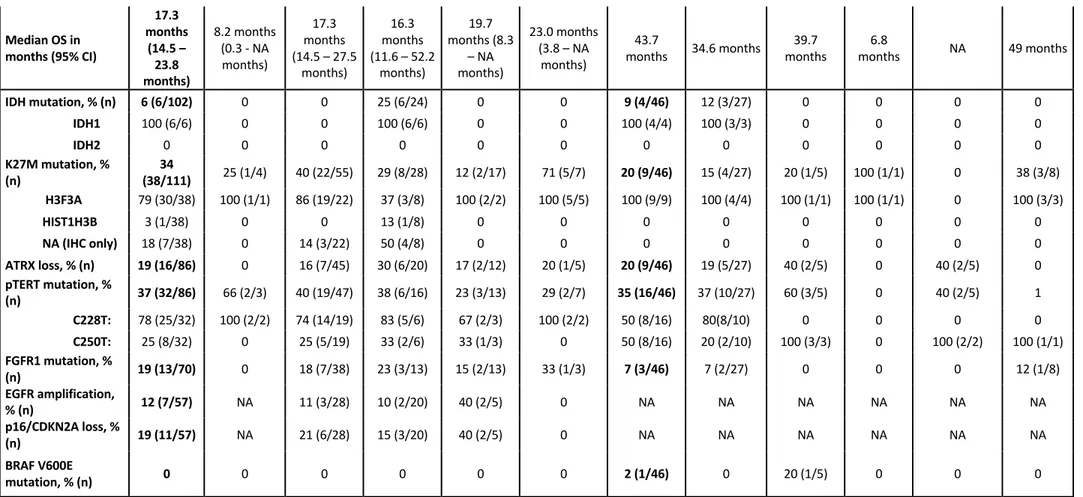
Patients characteristics and tumour main molecular alterations, according to the location are reported in Table 2.
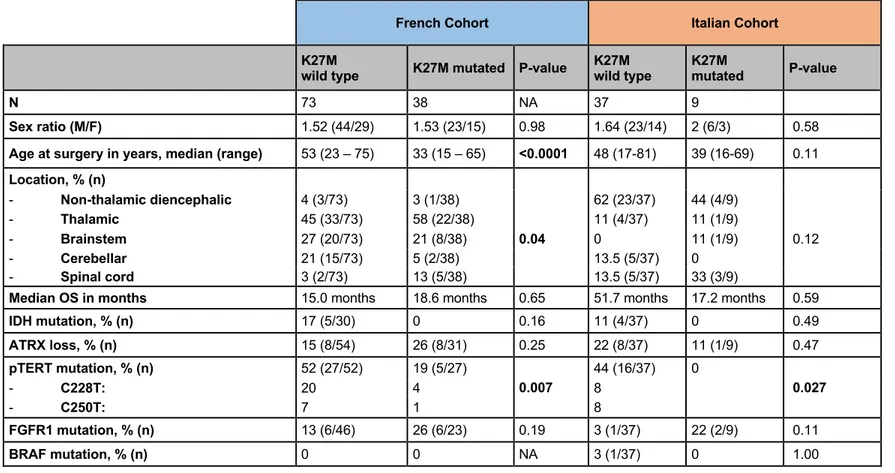
The two cohorts showed different distribution in the location of the tumour as well as in the percentage of H3F3A mutations. In the French cohort, histone H3K27M mutation was found in 38/110 patients (34%) and was significantly associated with a younger age at diagnosis (median 33 years vs. 53 years, p=6*10-5). In Italian cohort, H3F3A mutations were identified in 20% of cases and there was not seen any association with a younger age, probably due to the lower number of mutated cases. H3K27M mutation were mutually exclusive with IDH1, and inversely associated with TERTp mutation in both cohorts. H3K27M was found in all the locations but was significantly associated with thalamic and spinal locations in French cases; this evaluation did not reach any statistically significant differences in the Italian cohort due to the low number of mutated cases (Table 3).
In the French cohort, IDH1 mutations were found in 6 patients (1 grade II, 4 grade III, 1 grade IV) out of 102: strikingly, all 6 IDH1 mutated tumours were located in brainstem (6/24 vs. 0/78 for MLG not involving the brainstem; p=7.5.10-5). Noteworthy, only one out of the 5 IDH1 mutation identified by sequencing was IDH1 p.Arg132His (R132H), the other mutations were p.Arg132Gly (R132G), p.Arg132Cys (R132C), p.Arg132Leu (R132L), p.Arg132Gly (R132G), which contrasted with non-midline IDH1-mutant gliomas. Also in the Italian cohort is present a non-canonincal IDH1 mutation (R132G) in two cases (astrocytoma grade II of the ventricle) belonging to the same patient (primary and recurrent tumour).
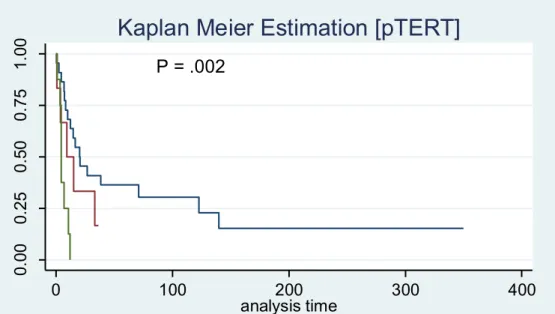
According to the 2016 WHO classification, all H3K27M mutated MLG were considered as grade IV tumours. However, we did not find any impact of histone H3K27M mutation in terms of overall survival in both cohort. Analysing the impact of specific alterations on survival, the French cohort showed that IDH1 mutation, loss of ATRX and FGFR1 mutations were associated with longer survival while the Italian cohort did not show any statistically significant differences within these gene alterations, probably due to the lower number of cases, but only with a poor survival in pTERT mutated cases (Figure 9, also reported in the French cohort).
30
Figure 9. Kaplan Meier curve of pTERT mutated vs wild-type cases (Italian cohort). The red line represents the C228T mutation, the green line the C250T mutation and the blue line the wild-type cases.
FGFR1 mutation analysis
Recurrent FGFR1 mutations affecting two hotspots were identified in 18% of patients (13/73) in the French cohort: p.Asn546Lys (9), p.Asn546Asp (2), p.Lys656Glu (2) with diverse locations: 7/37 thalamus (19%), 2/12 brainstem (17%), 2/13 cerebellar (15%), 1/3 spinal cord (33%) (p=0.9), in both H3K27M MLG (6/23) and histone wild-type MLG (6/45); p=0.3; 6/41 IDH wildtype vs. 0/4 IDH mutated, p=1. In order to investigate whether FGFR1 mutation were specific to midline diffuse gliomas, we sequenced from OncoNeuroTek tumour bank 479 DNA samples extracted from unselected hemispheric gliomas (170 GBM, 151 grade III, 157 grade II; of which, 197 were IDH mutated, 212 IDH wild type, and 70 undetermined) for the presence of FGFR1 mutations: we found only one mutation in a patient with an IDH wildtype GBM involving the corpus callosum, suggesting that FGFR1 mutations are restricted to midline diffuse gliomas (13/73 vs. 1/479; p=1.2.10-10). This data were further confirmed by public data (http://www.cbioportal.org): out of 1722 patients with diffuse gliomas, only 2 patients had FGFR1 activating mutation (13/73 vs. 2/1722; p=10-16): one GBM with K656E mutation but no clinical information on location and one 1p/19q-codeleted IDH1 mutant frontal oligodendroglioma with N546K mutation. In the Italian cohort, FGFR1 mutations were found only in 3/46 cases (7%), all p.Lys656Glu mutations (1 GBM-H3K27M of the III ventricle, 1 anaplastic
P = .002 0. 00 0. 25 0. 50 0. 75 1. 00 8 0 0 0 0 pTERT = 2 6 0 0 0 0 pTERT = 1 22 5 2 1 0 pTERT = 0 Number at risk 0 100 200 300 400 analysis time pTERT = 0 pTERT = 1 pTERT = 2
31
oligodendroglioma-H3K27M of the parasellar region and 1 intramedullary anaplastic astrocytoma). These cases were wild-type for IDH1/2, TERT promoter and BRAF, while 2 out of 3 cases were H3F3-K27M mutated.
32
French Cohort Italian Cohort
Total thalamic
Non-diencephalic Thalamic Brainstem Cerebellar Spinal cord Total
Non-thalamic
diencephalic Thalamic Brainstem Cerebellar
Spinal cord N, % (n) 116 4 (4/116) 48 (57/116) 26 (30/116) 15 (17/116) 7 (8/116) 46 27/46 5/46 1/46 5/46 8/46 Sex ratio (M/F) (71/45) 1.58 3 (3/1) (33/24) 1.38 2.33 (21/9) 1.13 (9/8) 1.67 (5/3) (29/17) 1.71 2 (18/9) 0.7 (2/3) 1 (1/0) 1.5 (3/2) 1.67 (5/3) Age at surgery in years, median (range) 46.5 (15 – 75) 55.5 (46 - 66) 49 (15 - 75) 41.5 (22 - 75) 50 (23 - 73) 34.5 (18 - 57) 46 (16-81) 45 (21-69) 51 (28-69) 17 49 (24-81) 49 (17-63) Histology according to 2016 WHO classification, % (n) Grade II (12/116) 10 0 12 (7/57) 13 (4/30) 6 (1/17) 0 (0/8) 24 (11/46) 26 (7/27) 20 (1/5) 0 0 38 (3/8) diffuse astrocytoma, IDH mutant 1 (1/116) 0 0 (0/57) 3 (1/30) 0 0 4 (2/46) 7 (2/27) 0 0 0 0 diffuse astrocytoma,
IDH wild type 6 (7/116) 0 11 (6/57) 3 (1/30) 0 0 20 (9/46) 19 (5/27) 20 (1/5) 0 0 38 (3/8)
diffuse astrocytoma,
NOS 3 (3/116) 0 2 (1/57) 3 (1/30) 6 (1/17) 0 0 0 0 0 0 0
oligodendroglioma, IDH mutant and
1p/19q codeleted 0 0 0 0 0 0 0 0 0 0 0 0
oligodendroglioma,
NOS 0 0 0 0 0 0 0 0 0 0 0 0
oligoastrocytoma,
33 Grade III (17/116) 15 0 9 (5/57) 33 (10/30) 0 25 (2/8) 17 (8/46) 22 (6/27) 40 (2/5) 0 40 (2/5) 38 (3/8) anaplastic astrocytoma, IDH mutant 3 (4/116) 0 0 13 (4/30) 0 0 2 (1/46) 4 (1/27) 0 0 0 0 anaplastic astrocytoma, IDH wild type 8 (9/116) 0 7 (4/57) 13 (4/30) 0 13 (1/8) 15 (7/46) 15 (4/27) 20 (1/5) 0 40 (2/5) 38 (3/8) anaplastic astrocytoma, NOS 3 (3/116) 0 0 7 (2/30) 0 13 (1/8) 0 0 0 0 0 0 anaplastic oligodendroglioma, IDH mutant and 1p/19q codeleted 0 0 0 0 0 0 0 0 0 0 0 0 anaplastic oligodendroglioma, NOS 0 0 0 0 0 0 4 (2/46) 4 (1/27) 20 (1/5) 0 0 0 anaplastic oligoastrocytoma, NOS 0 0 0 0 0 0 0 0 0 0 0 0
high grade glioma in
NF1 1 (1/116) 0 2 (1/57) 0 0 0 0 0 0 0 0 0 Grade IV (87/116) 75 100 (4/4) 79 (45/57) 53 (16/30) 94 (16/17) 75 (6/8) 48 (22/46) 52 (14/27) 40 (2/5) 1 60 (3/5) 25 (2/8) glioblastoma, IDH mutant 1 (1/116) 0 0 3 (1/30) 0 0 0 0 0 0 0 0 glioblastoma, IDH wild type 37 (43/116) 0 37 (21/57) 20 (6/30) 76 (13/18) 0 48 (22/46) 52 (14/27) 40 (2/5) 1 60 (3/5) 25 (2/8) glioblastoma, NOS 2 (2/116) 75 (3/4) 2 (1/57) 0 6 (1/17) 0 0 0 0 0 0 0 Diffuse midline glioma, H3 K27M mutant 35 (41/116) 25 (1/4) 40 (23/57) 30 (9/30) 12 (2/17) 75 (6/8) 20 (9/46) 4 1 1 0 3
34
Table 2. Patients characteristics and tumour main molecular alterations, according to the location.
Median OS in months (95% CI) 17.3 months (14.5 – 23.8 months) 8.2 months (0.3 - NA months) 17.3 months (14.5 – 27.5 months) 16.3 months (11.6 – 52.2 months) 19.7 months (8.3 – NA months) 23.0 months (3.8 – NA months) 43.7
months 34.6 months months 39.7 months 6.8 NA 49 months
IDH mutation, % (n) 6 (6/102) 0 0 25 (6/24) 0 0 9 (4/46) 12 (3/27) 0 0 0 0 IDH1 100 (6/6) 0 0 100 (6/6) 0 0 100 (4/4) 100 (3/3) 0 0 0 0 IDH2 0 0 0 0 0 0 0 0 0 0 0 0 K27M mutation, % (n) (38/111) 34 25 (1/4) 40 (22/55) 29 (8/28) 12 (2/17) 71 (5/7) 20 (9/46) 15 (4/27) 20 (1/5) 100 (1/1) 0 38 (3/8) H3F3A 79 (30/38) 100 (1/1) 86 (19/22) 37 (3/8) 100 (2/2) 100 (5/5) 100 (9/9) 100 (4/4) 100 (1/1) 100 (1/1) 0 100 (3/3) HIST1H3B 3 (1/38) 0 0 13 (1/8) 0 0 0 0 0 0 0 0 NA (IHC only) 18 (7/38) 0 14 (3/22) 50 (4/8) 0 0 0 0 0 0 0 0 ATRX loss, % (n) 19 (16/86) 0 16 (7/45) 30 (6/20) 17 (2/12) 20 (1/5) 20 (9/46) 19 (5/27) 40 (2/5) 0 40 (2/5) 0 pTERT mutation, % (n) 37 (32/86) 66 (2/3) 40 (19/47) 38 (6/16) 23 (3/13) 29 (2/7) 35 (16/46) 37 (10/27) 60 (3/5) 0 40 (2/5) 1 C228T: 78 (25/32) 100 (2/2) 74 (14/19) 83 (5/6) 67 (2/3) 100 (2/2) 50 (8/16) 80(8/10) 0 0 0 0 C250T: 25 (8/32) 0 25 (5/19) 33 (2/6) 33 (1/3) 0 50 (8/16) 20 (2/10) 100 (3/3) 0 100 (2/2) 100 (1/1) FGFR1 mutation, % (n) 19 (13/70) 0 18 (7/38) 23 (3/13) 15 (2/13) 33 (1/3) 7 (3/46) 7 (2/27) 0 0 0 12 (1/8) EGFR amplification, % (n) 12 (7/57) NA 11 (3/28) 10 (2/20) 40 (2/5) 0 NA NA NA NA NA NA p16/CDKN2A loss, % (n) 19 (11/57) NA 21 (6/28) 15 (3/20) 40 (2/5) 0 NA NA NA NA NA NA BRAF V600E mutation, % (n) 0 0 0 0 0 0 2 (1/46) 0 20 (1/5) 0 0 0
35
French Cohort Italian Cohort
K27M wild type K27M mutated P-value K27M wild type K27M mutated P-value
N 73 38 NA 37 9
Sex ratio (M/F) 1.52 (44/29) 1.53 (23/15) 0.98 1.64 (23/14) 2 (6/3) 0.58
Age at surgery in years, median (range) 53 (23 – 75) 33 (15 – 65) <0.0001 48 (17-81) 39 (16-69) 0.11
Location, % (n) - Non-thalamic diencephalic 4 (3/73) 3 (1/38) 62 (23/37) 44 (4/9) - Thalamic 45 (33/73) 58 (22/38) 11 (4/37) 11 (1/9) - Brainstem 27 (20/73) 21 (8/38) 0.04 0 11 (1/9) 0.12 - Cerebellar 21 (15/73) 5 (2/38) 13.5 (5/37) 0 - Spinal cord 3 (2/73) 13 (5/38) 13.5 (5/37) 33 (3/9)
Median OS in months 15.0 months 18.6 months 0.65 51.7 months 17.2 months 0.59
IDH mutation, % (n) 17 (5/30) 0 0.16 11 (4/37) 0 0.49 ATRX loss, % (n) 15 (8/54) 26 (8/31) 0.25 22 (8/37) 11 (1/9) 0.47 pTERT mutation, % (n) 52 (27/52) 19 (5/27) 0.007 44 (16/37) 0 0.027 - C228T: 20 4 8 - C250T: 7 1 8 FGFR1 mutation, % (n) 13 (6/46) 26 (6/23) 0.19 3 (1/37) 22 (2/9) 0.11 BRAF mutation, % (n) 0 0 NA 3 (1/37) 0 1.00
36
4.2 NTRK gene analysis in MLG
4.2.1 NTRK1 status
The Italian cohort of MLG was investigated for NTRK genes rearrangements.
In five cases out of 45 (11.1%) the analysis failed due to tissue artifacts (pre-analytical problems).
NTRK translocations were detected in 6 (15%) cases. Concerning case 2, we have selected and analysed primary (case 2A) and recurrent (case 2B) tumours. For statistical analysis the case number 2 were considered as a single case.
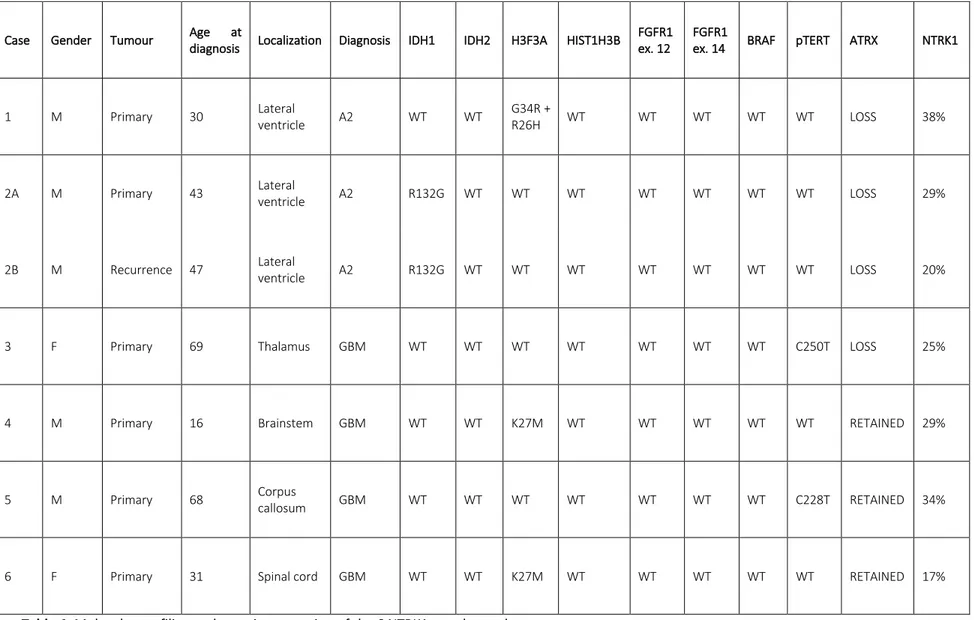
Clinical and genomic profiling of the 6 translocated reported: 4 (66,7%) males and 2 (33.3%) females, 43 year as mean age of diagnosis, 2 (33.3%) cases localized in lateral ventricle, 1 (16.67%) in thalamus, 1 (16.67%) in brainstem, 1 (16.67%) involving corpus callosum and 1 (16.67%) in spinal cord. Two cases (33.3%) were histological diagnosed as grade II astrocytoma (according to 2016 WHO classification) and 4 (66,7%) cases as GBMs. Five cases (83.3%) did not show IDH1 mutations, 1 case (16.67%) harbour R132G mutation in IDH1. None IDH2 mutations were identified. In one case (16.67%) G34R and R26H mutations were present in H3F3A gene, 2 (33.3%) cases showed K27M mutation in H3F3A and 3 (50%) cases were WT. All cases (100%) did not show mutations in HIST1H3B, FGFR1 (exon 12 and 14) and BRAF (exon 15). One case (16.67%) harboured pTERT C250T mutation, 1 case (16.67%) showed C228T and 4 cases (66,7%) were WT. Concerning ATRX status, 3 cases (50%) showed protein loss and in 3 cases (50%) ATRX expression is retained in the nucleus.
Regarding NTRK1, the percentages of cells showing NTRK1 translocation were: 38% in case 1, 29% and 20% respectively in case 2A and 2B, 25% in case 3, 29% in case 4, 34% in case 5 and 17% in case 6.
In Table 4, detailed genomic profiling and protein expression of the 6 translocated cases are shown.
37
Table 4. Molecular profiling and protein expression of the 6 NTRK1 translocated cases.
Case Gender Tumour Age at
diagnosis Localization Diagnosis IDH1 IDH2 H3F3A HIST1H3B
FGFR1 ex. 12
FGFR1
ex. 14 BRAF pTERT ATRX NTRK1
1 M Primary 30 Lateral ventricle A2 WT WT G34R + R26H WT WT WT WT WT LOSS 38%
2A M Primary 43 Lateral ventricle A2 R132G WT WT WT WT WT WT WT LOSS 29%
2B M Recurrence 47 Lateral ventricle A2 R132G WT WT WT WT WT WT WT LOSS 20%
3 F Primary 69 Thalamus GBM WT WT WT WT WT WT WT C250T LOSS 25%
4 M Primary 16 Brainstem GBM WT WT K27M WT WT WT WT WT RETAINED 29%
5 M Primary 68 Corpus callosum GBM WT WT WT WT WT WT WT C228T RETAINED 34%
38
The comparison between NTRK1 positive and negative cases are reported in Table 5.
NTRK1 translocation
Negative Positive P-value
N 35 6 NA
Sex ratio (M/F) 1.69 (22/13) 0.5 (2/4) 1.000
Age at surgery in years, median (range) 47 (17 – 81) 43 (16 – 69) 1.000
Location, % (n) 0.218 - Non-thalamic diencephalic 57 (20/35) 50 (3/6) - Thalamic 9 (3/35) 17 (1/6) - Brainstem 0 17 (1/6) - Cerebellar 14 (5/35) 0 - Spinal cord 20 (7/35) 17 (1/6) Diagnosis, % (n) 46 (16/35) A2-3 33 (2/6) A2 0.640 6 (2/35) OD3 66 (4/6) GBM 48 (17/35) GBM
Median OS in months 50.4 months 18.7 months 0.095
IDH mutation, % (n) 3 (1/35) 17 (1/6) ATRX loss, % (n) 14 (5/35) 50 (3/6) 0.268 pTERT mutation, % (n) 34 (12/35) 33 (2/6) 1.000 C228T (n): 6 1 C250T (n): 6 1 H3F3A-K27M mutation, % (n) 20 (7/35) 33 (2/6) 0.607 FGFR1 mutation, % (n) 9 (3/35) 0 1.000 BRAF mutation, % (n) 3 (1/35) 0 1.000
Table 5. Clinical, histological and molecular characteristics in patients with NTRK1 translocated versus
NTRK1 not-translocated MLG
The Fisher exact test did not find any correlation among NTRK1 gene rearrangements and clinical-pathological data (age, gender, tumour localization) and other molecular markers (IDH1/2, H3F3A, HIST1H3B, FGFR1, pTERT, BRAF and ATRX).
The Kaplan Meier survival curve showed a tendency to a worse prognosis in patients with translocation of NTRK1 even if the significance threshold is not reached (p-value 0.095, Figure 10).
39
Figure 10. Kaplan Meier curve. In red, the survival curve of translocated patients
In the following pages, some images of FISH analysis of positive cases are showed.
P = .095 0. 00 0. 25 0. 50 0. 75 1. 00 5 0 0 0 0 NTRK1 = 1 29 5 2 1 0 NTRK1 = 0 Number at risk 0 100 200 300 400 analysis time NTRK1 = 0 NTRK1 = 1
40
Case number 1 (Figure 11A and B) showed a translocation of NTRK1 in 38% of cells in
7 high powered fields for a total number of 100 cells.
Figure 11 A-B. The red arrows in the images indicate the NTRK1 gene rearrangement in case number
41
Case number 2: primary (case 2A) (Figure 12A and B) and recurrent (case 2B) (Figure
13A and B) tumours demonstrated a concordance in NTRK1 results, showing both a translocation in respectively 29% and 20% of cells.
Figure 12 A-B. The red arrows in the images show the NTRK1 gene rearrangement in case number
42
Figure 13 A-B. The red arrows in the images show the NTRK1 gene rearrangement in case the
43
Case number 3 (Figure 13 A-B) reported a gene rearrangement in 25% of cells.
Figure 13 A-B. The red arrows in the images indicate the NTRK1 gene rearrangement in case number
44
Case number 4 shows 29% of cells translocated for NTRK1 (Figure 14A and B).
Figure 14 A-B. The red arrows in the images show the NTRK1 gene rearrangement in case number 4.
45
Case number 5 reported NTRK1 translocation (figure 15A and B) in 34% of cells.
Figure 15 A-B. The red arrows in the images write down the NTRK1 gene rearrangement in case
46
Case number 6 (Figure 16A and B) displays the gene rearrangement in 17% of cells.
Figure 16 A-B. The red arrows in the images show the NTRK1 gene rearrangement in case number 6.
47
The other 35 (85%) cases did not show any translocation involving NTRK1 gene.
4.1.2 NTRK2 and NTRK3 status
Regarding NTRK2 gene we were able to obtain results of 43 (95.5%) cases out of 45. Whereas, for NTRK3 gene we reached a result in 42 (93.3%) out of 45 specimens, due to the lack of tissue sample.
Nevertheless, none of the cases reported NTRK2 or NTRK3 gene rearrangements.
4.3 Molecular analysis in circumscribed gliomas76
4.3.1 Clinico-pathological features of pilocytic astrocytomas, gangliogliomas, ependymomas and DNET
We retrospectively identified 108 pilocytic astrocytomas, 80 were from GH Pitié-Salpêtrière and 28 from AOU Maggiore della Carità. We analysed both the primary and the recurrent tumour of 4 patients (posterior fossa (2), supratentorial (1) and optic pathway (1)).
We retrospectively identified 75 grade II and 7 grade III gangliogliomas (all GH Pitié-Salpêtrière), 100 grade II (81 GH Pitié-Salpêtrière, 19 AOU Maggiore della Carità) and 26 grade III ependymomas (21 GH Pitié-Salpêtrière, 5 AOU Maggiore della Carità) and 7 DNETs (all GH Pitié-Salpêtrière).
The location of the tumours and the main demographic and pathological features are reported in Table 6.
48
PA GG II GG III EP II EP III DNET
N 108 75 7 100 26 7 Sex (M/F) 60/48 39/36 2/5 52/48 14/12 3/4 Mean age at surgery in years ± SD, (range) 34 ± 15 (16 – 76) 34 ± 14 (15 - 69) 44 ± 18 (20 - 65) 45 ± 16 (16 – 81) 40 ± 19 (16 – 76) 28 ± 12 (15 – 48) Location, % (n) Supratentorial 28.7 (31/108) 56 (42/75) 42.8 (3/7) 11 (11/100) 53.9 (14/26) 28.6 (2/7) Posterior Fossa 47.2 (51/108) 12 (9/75) 42.8 (3/7) 25 (25/100) 26.9 (7/26) 0 Optic pathway 8.3 (9/108) 0 0 0 0 0 Spinal cord 3.7 (4/108) 1.3 (1/75) 0 39 (39/100) 19.2 (5/26) 0 Not available 12.1 (13/108) 30.7 (23/75) 14.4 (1/7) 25 (25/100) 0 71.4 (5/7)
Table 6. Characteristics of the cohort (SD: standard deviation, PA: pilocytic astrocytoma, GG:
ganglioglioma, EP: ependymoma, DNET: dysembryoplastic neuroepithelial tumour)
4.3.2 FGFR1 activating mutations in circumscribed gliomas
Activating FGFR1 mutations were identified in 15/108 (13.9%) pilocytic astrocytomas: p.Asn546Lys (8 cases), p.Asn546Asp (1 case) and p.Lys656Glu (6 cases) (Table 7). In one patient, the p.Asn546Lys mutation was present at progression in the recurrent tumour. Strikingly, mutations were more frequent in optic pathway compared to other locations (6/9 vs 9/108; p=4.10-5).
No statistically significant different distribution of sexes (p=0.26) and age (p=0.56) were observed between mutated and wild-type pilocytic astrocytomas.
FGFR1 was mutated in 3/75 grade II vs 2/7 grade III gangliogliomas (p=0.05), 1/7 DNET, 1/100 ependymoma grade II (Table 8).
49
Location p.Asn546Lys p.Asn546Asp p.Lys656Glu wild-type mut/total (%)
Supratentorial 2* 0 3 26 5/31 (16.1 %)
Posterior Fossa 2 0 1 48 3/51 (5.9 %)
Optic pathway 3 1 2 3 6/9 (66.7 %)
Spinal cord 0 0 0 4 0/4 (0.0 %)
Not available 1 0 0 12 1/13 (6.3%)
*corresponding to the primitive and recurrent tumour of the same patient
Table 7. FGFR1 mutations’ distribution in pilocytic astrocytoma
GG: ganglioglioma, EP: ependymoma, DNET: dysembryoplastic neuroepithelial tumour
Table 8. BRAF and FGFR1 mutations’ distribution in other circumscribed gliomas
4.3.3 BRAF mutation analysis
We found 3/108 (2.8%) pilocytic astrocytomas with p.Val600Glu mutation, 6/108 (5.6%) with p.Thr599_Val600insThr mutation (4/6 cases with c.1797_1798insACA, 2/6 with c.1796_1797insTAC), 1/108 case with p.Val600_Lys601>Glu (c.1799_1801delTGA) (Table 9). In Figure 17A-B-C are reported the electropherograms of insertions and deletion detected in BRAF exon 15.
The p.Val600Glu mutation was found in 14/75 (18.2%) grade II gangliogliomas. The p.Val600Glu mutation seems to be associated to a younger age (23 Vs 36 years, p=0.0058) but did not show any different distribution between sexes (p=0.88).
None of ependymomas grade II and III were BRAF mutated (Table 8).
FGFR1 mutations BRAF mutation
p.Asn546Lys p.Asn546Asp p.Lys656Glu p.Lys656Asn p.Val600Glu GG grade II 1/75 (1.3%) 0 2/75 (2.6%) 0 14/75 (18.7%) GG grade III 2/7 (28.6%) 0 0 0 0 EP grade II 1/100 (1%) 0 0 0 0 EP grade III 0 0 0 0 0 DNET 0 0 0 1/7 (14.3%) 0
50
In this population we found no p.Thr599_Val600insThr mutation, in contrast to pilocytic astrocytomas (6/108 vs 0/215, p=2.10-3) and no p.Val600_Lys601>Glu.
Location p.Val600Glu p.Thr599_ Val600insThr p.Val600_ Lys601>Glu wild-type mut/total (%) Supratentorial 2 2* 0 27 4/31 (12.9%) Posterior Fossa 0 3 (2* + 1**) 0 48 3/51 (5.9%) Optic pathway 0 0 0 9 0/9 (0%) Spinal cord 0 0 0 4 0/4 (0%) Not available 1 1** 1 10 3/13 (23%) * c.1797_1798insACA - ** c.1796_1797insTAC
51
Figure 17A-B-C. Electropherograms of BRAF insertions