This content has been downloaded from IOPscience. Please scroll down to see the full text.
Download details:
IP Address: 193.204.8.28
This content was downloaded on 02/06/2016 at 08:33
Please note that terms and conditions apply.
New Graphical User Interface for EXAFS analysis with the GNXAS suite of programs
View the table of contents for this issue, or go to the journal homepage for more 2016 J. Phys.: Conf. Ser. 712 012002
New Graphical User Interface for EXAFS analysis
with the GNXAS suite of programs
Keisuke Hatada1,2, Fabio Iesari2, Leonardo Properzi2 , M. Minicucci2, and Andrea Di Cicco2
1
Groupe Th´eorie, D´epartement Mat´eriaux-Nanosciences, Institut de Physique de Rennes, UMR UR1-CNRS 6251, Universit´e de Rennes1, France
2
Physics Division, School of Science and Technology, University of Camerino, Camerino, 62032, Italy
E-mail: [email protected]
Abstract. GNXAS is a suite of programs based on multiple scattering calculations which performs a structural refinement of EXAFS spectra. It can be used for any system although it has been mainly developed to determine the local structure of disordered substances. We developed a user-friendly graphical user interface (GUI) to facilitate use of the codes by using wxPython. The developed GUI and the codes are multiplatform running on Windows, Macintosh and Linux systems, and are free shareware (http://gnxas.unicam.it). In this work we illustrate features and potentials of this newly developed version of GNXAS (w-GNXAS).
1. Introduction
The GNXAS suite of programs [1, 2, 3] is widely used for EXAFS refinements of the local structure of disordered systems by means of multiple scattering calculations through the n-body expansion of the x-ray absorption cross section. [2] Due to the n-body expansion, disorder effects are correctly included in the multiple-scattering signals of any order. Different modeling of the pair, triplet and higher-order distributions, based on Gaussian and non-Gaussian shapes, are possible. This approach has been applied to several interesting cases ranging from free molecules, crystalline and nanocrystalline solids, amorphous/glassy systems, liquids and solutions. Extension to Reverse Monte Carlo (RMC) modeling was also carried out and applied successfully to molecular [4] and liquid systems [5, 6].
GNXAS was originally developed for VMS, Unix, and Linux. Due to the use of obsolete Fortran expressions, the code was only able to be compiled by g77 compiler. We have recently revised the codes to suppress those old statements, thus now the code can be compiled by modern gfortran compilers. [7] The code has been compiled in static mode, so that it is fully portable, namely the users do not need to install additional libraries and dependencies. Furthermore, GNXAS was conceived to run with command lines. When it was developed, the text based input and output files were standard, so that the users were used to the operations. Nowadays, most of computer users are familiar only with the window based operations with a mouse, therefore this old style operation creates difficulty for novice users to start using the codes. For example another popular EXAFS analysis code FEFF [8] has very useful graphical interfaces [9, 10], which contributed to increase their users. Not only that but it helps to reduces human errors
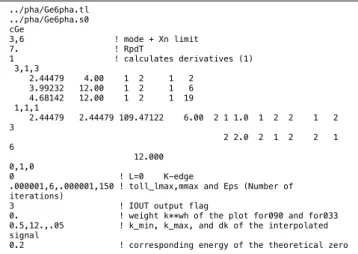
../pha/Ge6pha.s0 cGe 3,6 ! mode + Xn limit 7. ! RpdT 1 ! calculates derivatives (1) 3,1,3 2.44479 4.00 1 2 1 2 3.99232 12.00 1 2 1 6 4.68142 12.00 1 2 1 19 1,1,1 2.44479 2.44479 109.47122 6.00 2 1 1.0 1 2 2 1 2 3 2 2.0 2 1 2 2 1 6 12.000 0,1,0 0 ! L=0 K-edge
.000001,6,.000001,150 ! toll_lmax,mmax and Eps (Number of iterations)
3 ! IOUT output flag
0. ! weight k**wh of the plot for090 and for033 0.5,12.,.05 ! k_min, k_max, and dk of the interpolated signal
0.2 ! corresponding energy of the theoretical zero
Figure 1. A typical example of text based input file for GNXAS.
of input parameters. Thus this kind of software development is becoming very important for progress of theoretical codes. In this communication we present the newly developed graphical interface for GNXAS, which facilitates the use of the package for various operating systems.
2. Discussion
The original GNXAS is manipulated in terms of traditional command line. For example, to run gnxas which calculates n-body distribution functions, gn, for successive processes of EXAFS
analysis, one should type a command in a console window as # ./gnxas < c-Ge_xas.in
where ./gnxas is a command for its execution and c-Ge_xas.in is a name of input file. The symbol ”<” is for directing the input file to the executable file, which is used only for Linux and Macintosh versions of GNXAS, while Windows version does not use this symbol. For plotting output data, there are scripts provided for TopDrawer [11] and gnuplot [12]. The executable of TopDrawer is provided at the site of GNXAS.
Fig. 1 shows the input file c-Ge_xas.in from the data-analysis examples [13] as a typical example of text based input file. All the parameters are explained in so called ”red book” [1]. We see that the text type input file is not intuitive, and one should spend some time to be familiar with it. Moreover, one should learn command line manipulations. Thus, these text based operations discourage novice users.
A human friendly interface called w-GNXAS which is based on a Graphical User Interface (GUI) tool through the Python library ”wxPython” [14] controles these text based operations of GNXAS programs. Since the Python code is platform independent, it can be executed on any modern operating systems, such as Linux, Windows and Macintosh. With this newly developed GUI, the usage of GNXAS is intended to be more intuitive and facilitated. In this release we use Python 2.7, which is well tested and very stable. Users can control it directly typing commands on the appropriate panels and windows, on any operating systems. (See the image of Fig. 2) The input parameters and the data are read via the w-GNXAS interface, and they are directly transferred to GNXAS calculations. The plotting scripts are also prepared automatically. The results may be plotted by TopDrawer (or gnuplot, or other graphical software).
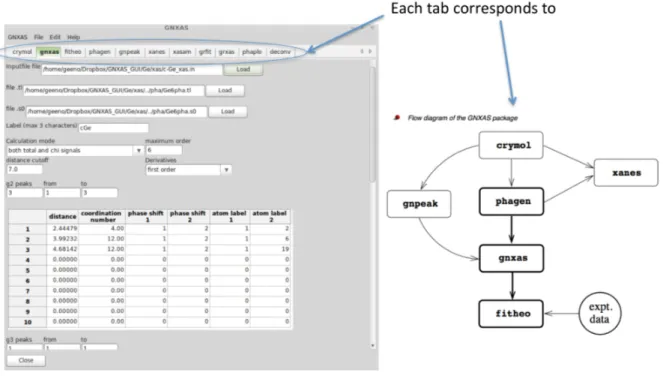
The left panel of Fig. 3 shows a typical image for the new w-GNXAS interface where the same input data in Fig. 1 are used. The w-GNXAS interface is constructed with several tabs in its main frame, such as crymol, gnxas, etc., which correspond to the programs of GNXAS suite.
!"#$ %&'()$ *&'+,-.$ /0123$ 40567$ 8272$ /64$
!
9/0123$
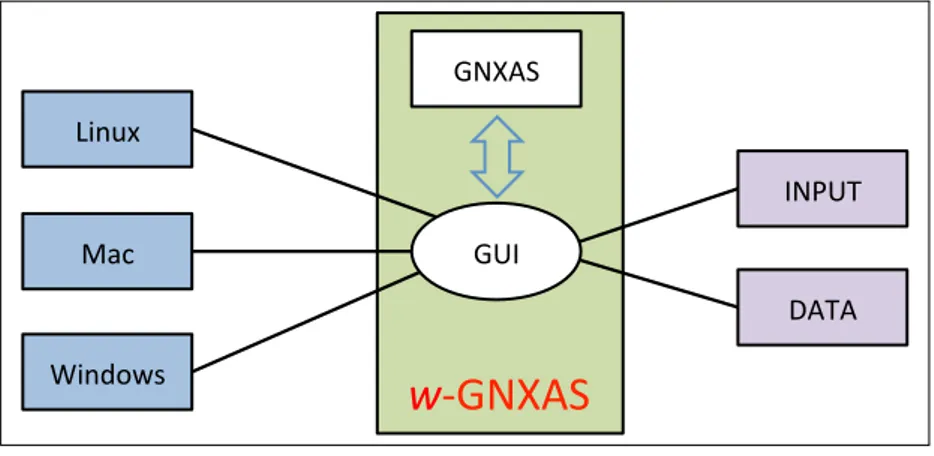
Figure 2. Flow diagram for the w-GNXAS program. GNXAS programs are controlled by the GUI of w-GNXAS. It is a cross platform toolkit, namely it can be used on Linux, Mac and Windows systems. The w-GNXAS types input commands and reads accessing to text based input and output files behind of its graphical windows. These files are compatible among different platforms as well. The output can be plotted by the TopDrawer or other graphical software, and script files for plotting are generated by GNXAS.
Hence users click a tab and choose a project to work on. The details of projects are described in the ”red book”.
After inserting the requested inputs inside the dialog panels (or prepare an input file and load it into the panel), users can run the code by clicking the ”run” button at the bottom of each window. (Fig. 4) Below that, there is a space to show the messages appearing in the console window during execution (log file). Users can check all the log messages (warning/errors) there. In the right side of Fig. 4 we show a typical output for EXAFS refinement of crystalline germanium at 300 K, using the data-analysis examples provided with the software [13]. The plot was generated by TopDrawer with a script prepared by GNXAS.
3. Summary
We realized a new user friendly graphical interface (w-GNXAS) for the GNXAS suite of programs, exploiting all of the potential of this advanced multiple-scattering data-analysis package. The new interface allows users to overcome the problem of inserting large amount of data with the old fashion text-style for input and output command files. All the codes of package including graphical interface are cross platform and statically compiled. Thus presently EXAFS structural refinements using GNXAS can be performed using this newly developed w-GNXAS adapted to Windows, Mac and Linux systems. After finishing tests, we will upload the program at the beginning of 2016 at the GNXAS website [15].
Figure 3. w-GNXAS has several tabs in the main frame (left panel) which correspond to the different programs in the GNXAS suite (shown in the right side of the figure). Users can select a specific calculation or project by clicking on the corresponding tabs.
Figure 4. Left panel: typical graphical window of w-GNXAS when selecting the program crymol to run. The console output can be checked and information about the selected model structure and possible warnings and error messages can be verified visually. Right panel: typical graphical output for the EXAFS refinement of crystalline Ge obtained by GNXAS (see data-analysis examples [13])
4. Acknowledgments
Parts of this work have been funded by European FP7 MSNano network under Grant Agreement No. PIRSES-GA-2012-317554, by FP7 MS-BEEM under Grant Agreement No. FP7-PEOPLE-2013-IEF-625388 and by COST Action MP1306 EUSpec.
References
[1] Extended suite of programs for advanced x-ray absorption data-analysis: methodology and practice, edited by A. Di Cicco (TASK publishing, Gdansk, Poland, ADDRESS, 2009).
[2] A. Filipponi, A. Di Cicco, and C. R. Natoli, Phys. Rev. B 52, 15122 (1995). [3] A. Filipponi and A. Di Cicco, Phys. Rev. B 52, 15135 (1995).
[4] A. Di Cicco and A. Trapananti, J. Phys.: Condens. Matter 17, S135 (2005). [5] A. Di Cicco, A. Trapananti, S. Faggioni, and A. Filipponi, PRL 91, 135505 (2003). [6] A. Di Cicco et al., Phys. Rev. B 89, 060102 (2014).
[7] GFORTRAN, http://www.gnuplot.info/.
[8] J. J. Rehr et al., Phys. Chem. Chem. Phys. 12, 5503 (2010). [9] B. Ravel and M. Newvillei, JSR 12, 537 (2005).
[10] S. Webb, SixPACK, http://www.sams-xrays.com/#!sixpack/rovht.
[11] J. Clement, TopDrawer, http://www.rcnp.osaka-u.ac.jp/okamura/ftp/pub/index.php?dir=topdrawer/. [12] T. Williams, C. Kelley, and many others, Gnuplot 5.0: an interactive plotting program,
http://gnuplot.sourceforge.net/.
[13] GNXAS data-analysis examples, http://gnxas.unicam.it/XASLABwww/pag gnxas/gnxas examp.html. [14] R. Dunn and H. Pasanen, wxPython, http://www.wxpython.org/.