This article was downloaded by: [Universita di Camerino], [Filippo Maggi] On: 16 July 2015, At: 08:19
Publisher: Taylor & Francis
Informa Ltd Registered in England and Wales Registered Number: 1072954 Registered office: 5 Howick Place, London, SW1P 1WG
Click for updates
Natural Product Research: Formerly
Natural Product Letters
Publication details, including instructions for authors and subscription information:
http://www.tandfonline.com/loi/gnpl20
SPME-GC-MS analysis of commercial
henna samples (Lawsonia inermis L.)
Tamara Mengonia, Dolores Vargas Peregrinaa, Roberta Censia, Manuela Corteseb, Massimo Ricciutellib, Filippo Maggia & Piera Di Martinoa
a
School of Pharmacy, University of Camerino, Camerino, Italy b
HPLC-MS laboratory, University of Camerino, Camerino, Italy Published online: 16 Jul 2015.
To cite this article: Tamara Mengoni, Dolores Vargas Peregrina, Roberta Censi, Manuela Cortese, Massimo Ricciutelli, Filippo Maggi & Piera Di Martino (2015): SPME-GC-MS analysis of commercial henna samples (Lawsonia inermis L.), Natural Product Research: Formerly Natural Product Letters To link to this article: http://dx.doi.org/10.1080/14786419.2015.1055491
PLEASE SCROLL DOWN FOR ARTICLE
Taylor & Francis makes every effort to ensure the accuracy of all the information (the “Content”) contained in the publications on our platform. However, Taylor & Francis, our agents, and our licensors make no representations or warranties whatsoever as to the accuracy, completeness, or suitability for any purpose of the Content. Any opinions and views expressed in this publication are the opinions and views of the authors, and are not the views of or endorsed by Taylor & Francis. The accuracy of the Content should not be relied upon and should be independently verified with primary sources of information. Taylor and Francis shall not be liable for any losses, actions, claims, proceedings, demands, costs, expenses, damages, and other liabilities whatsoever or howsoever caused arising directly or indirectly in connection with, in relation to or arising out of the use of the Content.
This article may be used for research, teaching, and private study purposes. Any substantial or systematic reproduction, redistribution, reselling, loan, sub-licensing, systematic supply, or distribution in any form to anyone is expressly forbidden. Terms &
Conditions of access and use can be found at http://www.tandfonline.com/page/terms-and-conditions
SPME-GC-MS analysis of commercial henna samples (
Lawsonia inermis L.)
Tamara Mengonia, Dolores Vargas Peregrinaa, Roberta Censia, Manuela Corteseb, Massimo Ricciutellib, Filippo Maggia*and Piera Di Martinoa
a
School of Pharmacy, University of Camerino, Camerino, Italy;bHPLC-MS laboratory, University of Camerino, Camerino, Italy
(Received 17 April 2015; final version received 21 May 2015)
The aim of this work was to provide a characterisation of volatile constituents from different commercial batches of henna (Lawsonia inermis) leaves of different geographic origin. Headspace solid-phase microextraction (HS-SPME) coupled with gas chromatography – mass spectrometry (GC – MS) was used for the purpose. A total of 72 components were identified by GC – MS in the headspace of different henna samples which proved to differ considerably from each other, because they were characterised by different classes of components, mainly aliphatic compounds (9.0 – 64.7%), terpenoids (5.8 – 45.5%) and aromatics (7.9 – 45.2%), with alkanes (0.9 – 18.5%), aldehydes (2.1 – 18.8%) and carboxylic acids (3.1 – 29.3%), monoterpenes (3.4 – 30.0%) and sesquiterpenes (0.8 – 23.7%) and phenyl propanoids (0.6 – 43.1%), being the most abundant, respectively. Major representatives of these groups were n-hexadecane (0.5 – 4.7%), (2E)-hexenal (0.5 – 11.7%) and acetic acid (2.8 – 24.5%), limonene (0.8 – 14.7%), carvol (3.8 – 7.1%), geranyl acetone (1.4 – 7.9%) and (E)-caryophyllene (3.3 – 8.4%), and (E)-anethole (0.6 – 35.0%), respectively. We assume that factors such as the manufacturing process, the storage conditions and the different geographic origin of the samples may contribute to such variability.
Keywords:henna; Lawsonia inermis; HS-SPME; GC – MS
1. Introduction
Derived from cut and dried leaves of Lawsonia inermis L. (Lythraceae), henna has been used for centuries for body art, especially in Arabic and Hindu cultures (De Groot2013). Today, henna is used as a hair dye and for temporary tattoos on the skin, frequently for self-use and easy domestic application, because of its strong colouring properties from the active component lawsone (2-hydroxy-1,4-naphthoquinone) and because people perceive henna as a natural product without the unfavourable effects of chemical colouring agents. Henna use has increased recently because of the fashion of temporary tattoos in both Europe and the USA, even if its use
q 2015 Taylor & Francis
*Corresponding author. Email:[email protected]
Natural Product Research, 2015
http://dx.doi.org/10.1080/14786419.2015.1055491
in the USA is not approved by the food and drug administration (FDA), which does not classify lawsone as a colourant permitted for direct application on the skin (FDA2012). On the contrary, henna is authorised as a colouring agent for hair, and is widely available in India, the Middle East, Europe, Australia, Canada and the USA.
The polar fraction of L. inermis has been characterised in depth in several studies.
Polar components identified in henna aerial parts are aldehydes, organic acids, flavonoids, phenolic compounds (Siddiqui & Kardar 2001; Mikhaeil et al.2004; Hema et al. 2010) and condensed tannins (Musa & Gasmelseed 2012). Also identified were 1-methyl-1-H-pyrrole, indole, aromatic compounds, such as toluene and styrene, and aliphatic compounds, many of them appearing to be unsaturated (Keheyan & Giulianelli 2006). Large amounts of carbohydrates, phenolic glycosides, gums and mucilages were also found (Jain et al. 2010; Hsouna et al.2011).
Concerning non-polar components, a few studies have reported the occurrence of sterols (Siddiqui & Kardar2001), aliphatic compounds, aromatic and heterocyclic compounds (Hema et al.2010; Hsouna et al.2011), and free and esterified fatty acids (Hsouna et al.2011; Jacob & Saral2013).
Studies focused on qualitative analysis of volatile components in henna as a finished product, that is, sold in the market as a hair dye, however, are lacking. Thus, the aim of our work was to provide a characterisation of volatile profiles of henna samples. Starting from different commercial henna hair, hand and tattoo batches found in the retail trade, we performed a headspace solid-phase microextraction (HS-SPME) coupled to gas chromatog-raphy – mass spectrometry (GC – MS) analysis to characterise the volatile constituents occurring in different commercial samples of different geographic origin. We used SPME technique because this is a non-destructive and non-invasive method to evaluate aroma compounds in different kinds of matrices (Demyttenaere et al. 2001; Hamm et al. 2003; Demyttenaere, Dagher, et al. 2003a, Demyttenaere, Sa´nchez Martinez, et al. 2003b; Demyttenaere, Morin˜a, et al. 2004a, Demyttenaere, Vanoverschelde, et al. 2004b; Van Lancker et al. 2008). It has been largely applied to aroma analysis in combination with GC and GC – MS, offering solvent-free and rapid sampling with low cost and ease of operation; moreover, it is sensitive, selective and also compatible with low detection limits (Pawliszyn
1997).
2. Results and discussion
The volatile components detected in the headspace of the six henna samples are reported in
Table 1, while the relative chromatograms are depicted in Figure S1. A total of 72 components were identified in the headspace of the six henna samples, accounting for 69.0 – 91.4% of the total peak areas. The samples proved to differ considerably from each other, because they were characterised by different classes of components, mainly aliphatic compounds (9.0 – 64.7%), terpenoids (5.8 – 45.5%) and aromatics (7.9 – 45.2%), with alkanes (0.9 – 18.5%), aldehydes (2.1 – 18.8%) and carboxylic acids (3.1 – 29.3%), monoterpenes (3.4 – 30.0%) and sesquiterpenes (0.8 – 23.7%), and phenyl propanoids (0.6 – 43.1%), being the most abundant, respectively. Major representatives of these groups were n-hexadecane (0.5 – 4.7%), (2E)-hexenal (0.5 – 11.7%) and acetic acid (2.8 – 24.5%), limonene (0.8 – 14.7%), carvol (3.8 – 7.1%), geranyl acetone (1.4 – 7.9%) and (E)-caryophyllene (3.3 – 8.4%), and (E)-anethole (0.6 – 35.0%), respectively.
Interestingly, acetic acid is a marker of fermentation, which probably occurs during manufacturing of henna. Being a weak acid, acetic acid slightly lowers pH of henna solution (about 5.5), allowing to extend the duration of the colour (Leung & Foster2003). Therefore, samples with high levels of this compound may be considered of higher stability.
2 T. Mengoni et al.
Table 1. Headspace components of henna samples determined by GC – MS. Samples N. Component a RI calc. b RI lit. c Moga no IRAN Mohini INDIA Minardi INDIA Sahara MOROCCO Zarqa PAKISTAN Leaves MOROCCO ID d 1 Formic acid 510 512 3.3 0.3 Std 2 Acetic acid 644 645 11.9 24.5 6.8 26.0 13.8 2.8 Std 3 Hexanal 803 801 0.6 0.9 1.0 Std 4 Furfural 832 825 1.1 1.5 0.4 3.3 0.2 RI,MS 5( 2 E )-Hexenal 858 857 1.4 0.6 1.4 11.7 0.5 1.9 RI,MS 6( 3 Z )-Hexenol 863 850 0.4 RI,MS 7 2-Acetylfuran 916 900 2.4 0.5 5.3 1.2 RI,MS 8 1,2-Butanolide 924 914 0.4 RI,MS 9 Benzaldehyde 962 961 2.1 0.4 2.2 0.3 Std 10 1-Octen-3-ol 986 982 0.3 Std 11 6-Methyl-5-hepten-2-one 991 981 1.2 1.3 1.7 RI,MS 12 n -Decane 1001 1000 0.9 Std 13 (2 E ,4 E )-Heptadienal 1014 1015 1.2 RI,MS 14 p -Cymene 1024 1023 3.0 Std 15 Limonene 1031 1026 14.7 1.0 3.0 2.7 0.8 0.4 Std 16 Benzyl alcohol 1042 1037 2.6 0.7 RI,MS 17 Fenylacetaldehyde 1046 1047 3.8 3.0 3.2 8.2 0.4 RI,MS 18 g-Terpinene 1060 1065 0.8 1.2 Std 19 3,5-Octadien-2-one 1076 1076 2.1 RI,MS 20 p ,a -Dimethylstyrene 1089 1089 5.0 RI,MS 21 (E ,E )-3,5-Octadien-2-one 1096 1098 1.0 RI,MS 22 Linalool 1103 1100 1.2 1.0 4.7 1.5 Std 23 n -Nonanal 1105 1101 1.1 3.4 RI,MS 24 6-Methyl-3,5-heptadiene-2- one 1108 1110 2.0 3.5 RI,MS 25 2-Phenylethanol 1117 1124 1.1 0.8 RI,MS 26 Camphor 1141 1144 0.2 0.4 2.2 Std 27 Menthone 1153 1155 0.7 1.2 0.7 RI,MS (Continued )
Natural Product Research 3
Table 1. (Continued ). Samples N. Component a RI calc. b RI lit. c Moga no IRAN Mohini INDIA Minardi INDIA Sahara MOROCCO Zarqa PAKISTAN Leaves MOROCCO ID d 28 Isopropyl-1- methylcyclohexanol 1163 1156 2.1 2.9 RI,MS 29 Terpinen-4-ol 1177 1177 1.5 0.4 Std 30 a -Terpineol 1191 1183 0.6 1.5 1.3 Std 31 Butoxyethoxyethanol 1193 1192 1.3 RI,MS 32 Methyl chavicol 1196 1198 1.2 1.3 2.0 RI,MS 33 n -Dodecane 1201 1200 1.9 Std 34 n -Decanal 1206 1205 1.8 3.6 Std 35 b -Cyclocitral 1217 1218 0.4 0.6 0.7 Std 36 Pulegone 1236 1233 1.1 RI,MS 37 Carvol 1242 1253 4.2 3.8 7.1 RI,MS 38 Anisaldehyde 1251 1249 1.0 0.3 3.0 RI,MS 39 Linalyl acetate 1256 1254 1.6 RI,MS 40 (E )-Anethole 1281 1279 6.6 0.6 3.8 0.6 35.0 Std 41 n -Tridecane 1294 1300 0.5 Std 42 Carvacrol 1299 1297 0.4 Std 43 Eugenol 1355 1346 1.6 2.3 3.1 Std 44 3,4-Dimethylacetophenone 1358 2.9 2.0 MS 45 a -Copaene 1369 1370 1.4 5.2 0.4 2.7 RI,MS 46 Diphenyl ether 1393 1393 0.9 RI,MS 47 n -Tetradecane 1398 1400 0.9 1.1 0.7 1.2 0.9 Std 48 b -Cedrene 1403 1400 2.5 0.8 RI,MS 49 (E )-caryophyllene 1411 1414 3.8 8.4 5.0 3.3 Std 50 Octylcyclohexane 1440 1439 0.3 RI,MS 51 2-Methoxynaphthalene 1441 1433 1.5 RI,MS 52 a -Humulene 1446 1447 0.3 1.5 0.7 Std 53 Geranyl acetone 1453 1453 4.2 2.5 5.4 1.4 7.9 2.5 RI,MS 54 a -Isomethyl ionone 1474 1473 1.3 RI,MS (Continued ) 4 T. Mengoni et al.
Table 1. (Continued ). Samples N. Component a RI calc. b RI lit. c Moga no IRAN Mohini INDIA Minardi INDIA Sahara MOROCCO Zarqa PAKISTAN Leaves MOROCCO ID d 55 ar -Curcumene 1478 1477 0.7 0.7 7.9 RI,MS 56 (E )-b -Ionone 1482 1486 1.9 1.0 2.6 1.4 2.3 Std 57 a -Zingiberene 1491 1492 1.0 RI,MS 58 n -Pentadecane 1496 1500 0.6 4.1 1.4 Std 59 Dihydroactinidiolide 1517 1513 5.4 2.3 6.8 4.7 RI,MS 60 b -Sesquiphellandrene 1519 1518 7.3 1.9 RI,MS 61 Caryophyllenyl alcohol 1561 1569 0.4 1.7 RI,MS 62 2-Methylpentadecane 1560 1562 1.2 RI,MS 63 Caryophyllene oxide 1570 1571 2.7 5.6 Std 64 n -Hexadecane 1598 1600 0.5 4.7 0.9 2.5 0.6 Std 65 Isopropyl dodecanoate 1622 1618 5.4 RI,MS 66 ar -Turmerone 1656 1660 0.5 RI,MS 67 n -Heptadecane 1699 1700 4.4 2.0 Std 68 n -Octadecane 1800 1800 3.0 Std 69 Hexahydrofarnesyl acetone 1836 1838 1.3 1.8 0.8 0.6 RI,MS 70 Farnesyl acetone 1900 1895 0.3 0.2 RI,MS 71 Methyl palmitate 1911 1909 0.1 0.5 RI,MS 72 Methyl oleate 2094 2095 0.2 0.3 RI,MS Total identified (%) 91.4 69.6 79.3 86.6 80.6 84.7 Grouped compounds (%) Aliphatics 20.7 48.0 21.2 64.7 23.7 9.0 Aldehydes 3.1 5.0 3.9 18.8 4.8 2.1 Ketones 3.1 6.6 1.3 1.7 Esters 0.3 5.4 0.8 Alkanes 2.3 11.1 3.6 6.5 2.3 0.9 Carboxylic acids 11.9 24.5 6.8 29.3 13.8 3.1 Aromatic compounds 17.5 12.0 10.7 9.9 7.9 45.2 Terpenoids 50.9 8.1 47.4 12.03 43.7 29.3 Monoterpene hydrocarbons 15.4 1.0 3.0 2.7 5.0 0.4 (Continued )
Natural Product Research 5
Table 1. (Continued ). Samples N. Component a RI calc. b RI lit. c Moga no IRAN Mohini INDIA Minardi INDIA Sahara MOROCCO Zarqa PAKISTAN Leaves MOROCCO ID d Oxygenated monoterpenes 14.5 2.5 10.8 2.4 14.5 16.4 Sesquiterpene hydrocarbons 8.7 14.3 23.0 9.4 Oxygenated sesquiterpenes 4.5 9.4 0.8 0.5 0.8 Norisoprenoids 2.3 2.4 3.1 1.4 0.7 2.3 Other terpenoids 5.4 2.3 6.8 4.7 Others 2.4 0.9 5.3 1.2 aComp ounds are listed in order of their elut ion from a HP-5M S colu mn. bLin ear retent ion ind ex on HP-5M S co lumn, exper imenta lly determined using homol ogous series of C8 –C 30 alkan es. cRelative rete ntion ind ex taken fro m Adam s and NIST 08 libra ries fo r apola r capillary colu mn. dIde ntification method s: MS , b y co mparison of the mass spectru m wit h those of the comput er mass librar ies Wiley, Adam s, FFNSC 2 and NIST 08; RI, by com par iso n o f R I wit h those rep orted in the litera ture (Ad ams 2007 ; N IST 08 2008; FFNSC2 2012 ); STD, by compar ison of the rete ntion ti me and mass spec trum of available auth entic standa rd. 6 T. Mengoni et al.
Other components present in noteworthy levels were the sesquiterpenes ar-curcumene (7.9%) and b-sesquiphellandrene (7.3%) in the Zarqa sample (Pakistan) and the lactone dihydroactinidiolide (2.3 – 6.8%) in the Mogano (Iran), Mohini (India), Minaridi (India) and Sahara (Morocco) samples.
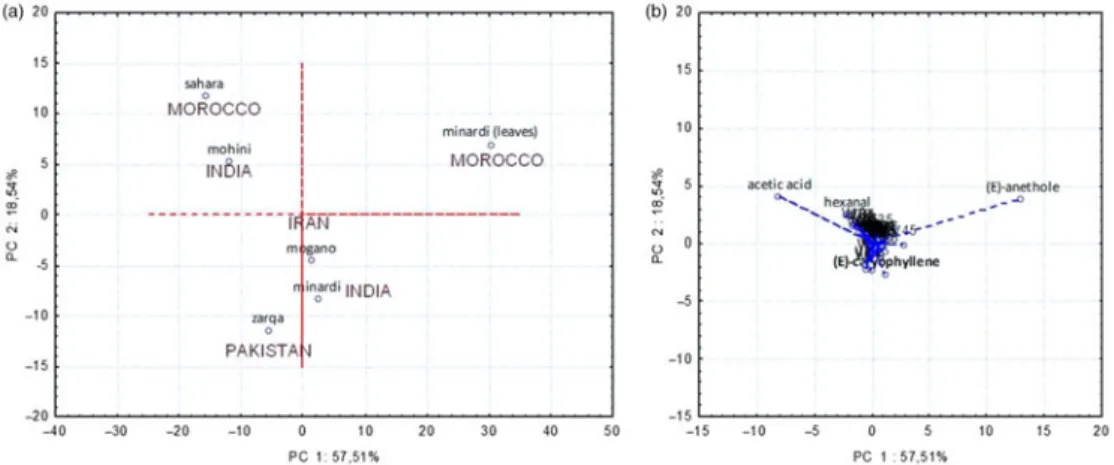
Multivariate analysis showed that the variability of data was generated mostly by the content of acetic acid, (E)-anethole and (E)-caryophyllene, as shown in the loading plot (Figure 1(b)). They were correlated with henna samples taking place in the same position of the score plot (Figure 1(a)). Sample 6 from Morocco was correlated with (E)-anethole, while samples 2 and 5 from India and Morocco, respectively, were mainly characterised by high levels of acetic acid. Finally, samples 1, 3 and 4, from Iran and Pakistan, respectively, were mostly correlated with sesquiterpenes such as (E)-caryophyllene.
3. Materials and methods See Supplementary materials.
4. Conclusions
Our study found significant variability in the headspace volatile components of the different henna products analysed, confirmed by the principal component analysis. We assume that factors such as the manufacturing process, the storage conditions and the different geographic origin of the samples may contribute to such variability. Results obtained by SPME analysis showed different chromatographic profiles for the six henna samples, leading to the conclusion that the volatile components in the samples of henna are heterogeneous, depending on the different origin and manufacturing process of the samples. Since there are no studies in the literature that offer qualitative and semi-quantitative analysis and comparison of data between different samples of commercial henna to highlight their variability, the results of this project fill a gap in knowledge about this plant derivative that is widely used for cosmetic purposes, but still poorly understood.
Supplementary material
Supplementary material relating to this paper are available online at http://dx.doi.org/10.1080/ 14786419.2015.1055491, alongside Table S1 and Figure S1.
Figure 1. (a) Score plot (PCA) for main variation of volatile components among henna samples. (b) The PCA loading plot for henna volatiles extracted by HS-SPME.
Natural Product Research 7
Acknowledgements
The authors would like to thank Mrs Flavia Gigli for her kind contribution to the GC-MS analysis. They would also like to thank Sheila Beatty for editing the English usage of the manuscript.
Disclosure statement
No potential conflict of interest was reported by the authors.
References
de Groot AC. 2013. Side-effects of henna and semi-permanent ‘black henna’ tattoos: a full review. Contact Dermatol. 69:1 – 25.
Demyttenaere JCR, Dagher C, Sandra P, Kallithraka S, Verhe´ R, De Kimpe N. 2003a. Flavour analysis of Greek white wine by solid-phase microextraction-capillary gas chromatography-mass spectrometry. J Chromatogr A. 985:233 – 246.
Demyttenaere JCR, Morin˜a RM, De Kimpe N, Sandra P. 2004a. Use of headspace solid-phase microextraction and headspace sorptive extraction for the detection of the volatile metabolites produced by toxigenic Fusarium species. J Chromatogr A. 1027:147– 154.
Demyttenaere JCR, Sa´nchez Martinez JI, Verhe´ R, Sandra P, De Kimpe N. 2003b. Analysis of volatiles of malt whisky by solid-phase microextraction and stir bar sorptive extraction. J Chromatogr A. 985:221 – 232.
Demyttenaere JCR, Van Belleghem K, De Kimpe N. 2001. Biotransformation of (R)-(þ)- and (S)-(2)-limonene by fungi and the use of solid phase microextraction for screening. Phytochemistry. 57:199– 208.
Demyttenaere JCR, Vanoverschelde J, De Kimpe N. 2004b. Biotransformation of (R)-(þ)- and (S)-(2)-citronellol by Aspergillus sp. and Penicillium sp., and the use of solid-phase microextraction for screening. J Chromatogr A. 1027:137– 146.
Food and drug Administration (FDA). 2012. Temporary Tattoos, Henna/Mehndi, and “Black Henna”. 23 October 2012.
(http://www.fda.gov/MedicalDevices/ProductsandMedicalProcedures/HomeHealthandConsumer/
ConsumerProducts/ContactLenses/ucm108569.htm).
Hamm S, Lesellier E, Bleton J, Tchapla A. 2003. Optimization of headspace solid phase microextraction for gas chromatography/mass spectrometry analysis of widely different volatility and polarity terpenoids in olibanum. J Chromatogr A. 1018:73 – 83.
Hema R, Kumaravel S, Gomathi S, Sivasubramaniam C. 2010. Gas Chromatography-Mass Spectroscopic analysis of Lawsonia inermis Leaves. New York Science J. 3:141 – 143.
Hsouna AB, Trigui M, Culioli G, Blache Y, Jaoua S. 2011. Antioxidant constituents from Lawsonia inermis leaves: isolation, structure elucidation and antioxidative capacity. Food Chem. 125:193 – 200.
Jacob PP, Saral AM. 2013. GC-MS Analysis of Lawsonia inermis seed oil. Int J Pharm Pharm Sci. 5:617 – 618. Jain VC, Shah DP, Sonani NG, Dhakara S, Patel NM. 2010. Pharmacognostical and preliminary phytochemical
investigation of Lawsonia inermis L. leaf. Rom J Biol-Plant Biol. 55:127 – 133.
Keheyan Y, Giulianelli L. 2006. Identification of historical ink ingredients using pyrolysis-GC-MS. A model study. e-Preserv Sci. 3:5 – 10.
Leung AY, Foster S. 2003. Encyclopedia of common natural ingredients used in Food, Drugs, and Cosmetics. New York: John Wiley & Sons.
Mikhaeil BR, Badria FA, Maatooq GT, Amer MM. 2004. Antioxidant and immunomodulatory constituents of henna leaves. Z. Naturforsch. 59c:468– 476.
Musa AE, Gasmelseed GA. 2012. Characterization of Lawsonia inermis (Henna) as vegetable tanning material. J For Prod Ind. 1:35 – 40.
Pawliszyn J. 1997. Solid Phase Microextraction: Theory and Practice. New York: Wiley-VCH. Siddiqui BS, Kardar MN. 2001. Triterpenoids from Lawsonia alba. Phytochemistry. 58:1195 – 1198.
Van Lancker F, Adams A, Delmulle B, De Saeger S, Moretti A, Van Peteghem C, De Kimpe N. 2008. Use of headspace SPME-GC-MS for the analysis of the volatiles produced by indoor molds grown on different substrates. J Environ Monit. 10:1127 – 1133.
8 T. Mengoni et al.