F1000Research
Open Peer Review
F1000 Faculty Reviews are commissioned from members of the prestigious F1000
. In order to make these reviews as Faculty
comprehensive and accessible as possible, peer review takes place before publication; the referees are listed below, but their reports are not formally published.
, University of Adelaide at the
Jozef Gécz
Women's and Children's Hospital and the Robinson Research Institute Australia
, Donders Institute for Hans van Bokhoven
Brain, Cognition and Behaviour Radboud University Medical Center Netherlands Discuss this article
(0) Comments 2
1 REVIEW
Advances in understanding – genetic basis of intellectual
disability [version 1; referees: 2 approved]
Pietro Chiurazzi , Filomena Pirozzi
2
Institute of Genomic Medicine, Catholic University School of Medicine, Rome, Italy
Department of Genetics and Genome Sciences, Case Western Reserve University School of Medicine, Cleveland, Ohio, USA
Abstract
Intellectual disability is the most common developmental disorder characterized by a congenital limitation in intellectual functioning and adaptive behavior. It often co-occurs with other mental conditions like attention deficit/hyperactivity disorder and autism spectrum disorder, and can be part of a malformation syndrome that affects other organs. Considering the heterogeneity of its causes (environmental and genetic), its frequency worldwide varies greatly. This review focuses on known genes underlying (syndromic and non-syndromic) intellectual disability, it provides a succinct analysis of their Gene Ontology, and it suggests the use of transcriptional profiling for the prioritization of candidate genes.
1
2
1 2 Referee Status: Invited Referees version 1 published 07 Apr 2016 1 207 Apr 2016, (F1000 Faculty Rev):599 (doi:
First published: 5
) 10.12688/f1000research.7134.1
07 Apr 2016, (F1000 Faculty Rev):599 (doi:
Latest published: 5
) 10.12688/f1000research.7134.1
v1
Pietro Chiurazzi ( ) Corresponding author: [email protected]
Chiurazzi P and Pirozzi F.
How to cite this article: Advances in understanding – genetic basis of intellectual disability [version 1;
2016, (F1000 Faculty Rev):599 (doi: )
referees: 2 approved] F1000Research 5 10.12688/f1000research.7134.1
© 2016 Chiurazzi P and Pirozzi F. This is an open access article distributed under the terms of the
Copyright: Creative Commons Attribution
, which permits unrestricted use, distribution, and reproduction in any medium, provided the original work is properly cited. Licence
The author(s) declared that no grants were involved in supporting this work. Grant information:
Competing interests: The authors declare that they have no competing interests.
07 Apr 2016, (F1000 Faculty Rev):599 (doi: )
Introduction
The advances in scientific technology related to gene sequenc-ing and discovery in recent years, such as high-throughput whole genome sequencing (WGS) and single-cell sequencing, have led to an increasing number of studies aimed at finding new causative genes for human diseases.
Owing to the heterogeneity of clinical features and causative fac-tors (both genetic and environmental), characterization of intellec-tual disability (ID) has benefited from these advances, as shown by the significant increase of publications (Figure 1). As defined by the Diagnostic and Statistical Manual of Mental Disorders, Fifth Edition (DSM-5), ID is characterized by significant limitations in intellectual functioning and adaptive behavior, which include conceptual, social, and practical skills, arising “prior to age 18” (but it would be fair to say “with a prenatal origin”). The disorder is con-sidered chronic and often co-occurs with other mental conditions like depression, attention deficit/hyperactivity disorder, and autism spectrum disorder (ASD). Furthermore, ID is often part of a malfor-mation syndrome that affects other organs and their functions. ID is the most common developmental disorder; however, given the heterogeneity of its causes, estimates of its frequency worldwide are highly variable (reviewed by 1). The prevalence of ID also varies depending on the age of patients, as illustrated by two Australian surveys in which prevalence was 3.3/1000 if the age range of 20 to 50 years was considered2 but increased to 14.3/1000 if the age range
was lowered to 6 to 15 years3.
The purposes of this review are to update the list of known genes related to ID and to provide a brief bioinformatic analysis of their Gene Ontology (GO). Eventually, we propose the use of a relative expression ratio (“Brain ratio”) to prioritize new candidate genes for ID.
Nomenclature: mental retardation versus intellectual disability
Changes in nomenclature (i.e. how we name things and concepts) are particularly delicate in science, since consistency in terminol-ogy allows more precise communication4. As discussed elsewhere5,
“mental retardation” has recently been substituted by the new term ID, which in our opinion is less accurate since it does not refer to the developmental nature of the disease and it does not reflect the progress of mental acquisitions that could nonetheless be achieved but at a slower pace. That said, we should remember that ID is not the only term employed to indicate delayed acquisition of psycho-motor milestones. In fact, “developmental delay” is the second most common term found in the Clinical Synopsis of OMIM (Online Mendelian Inheritance in Man) (after “mental retarda-tion”) and is widely used by pediatricians6. Other more complex
terms that have been proposed, such as “intellectual developmental disorder”, “neurodevelopmental disorder”, or “developmental cog-nitive impairment”7, though certainly more accurate than ID, have
not gained in popularity. However, all of these terms refer to the slower acquisition of psychomotor milestones, resulting in a sig-nificant impairment of cognitive functions (a) and adaptive behav-ior (b), obviously with an early onset (c), compared with peers.
Figure 1. Bar graph illustrating the number of publications per year from 2007 to 2015 obtained with the PubMed search “(intellectual disability OR mental retardation) AND (next-generation sequencing OR exome sequencing)”.
Cognitive abilities can be measured by using a panoply of psychological tests, including the Wechsler Intelligence Scale for Children, that have as the output a numerical value known as “intelligence quotient” (IQ).
It is worth remembering that the term “pervasive developmental disorder” (PDD) is often used by psychologists and psychiatrists to refer to a group of conditions characterized by altered develop-ment of multiple basic functions, including socialization and com-munication. In May 2013, the DSM-5 was released and the term PDD was abandoned and substituted by ASDs. Finally, the term “learning disability” is usually reserved for specific impairments, like dyslexia and dyscalculia, that are associated with a child’s academic underperformance but not with a lower IQ.
Nomenclature also reflects social trends and sensibilities that vary with time and according to the different cultural context. Social perception has become a decisive factor in changing nomencla-ture: the term “mental retardation” is not considered politically correct any longer because of the pejorative term “retard” that is used to stigmatize affected individuals4. The community of parents
and patients has indeed shown strong disagreement with the term “mental retardation”, leading to “Rosa’s law”, signed by President Obama on October 5, 2010. The new bill requires the federal gov-ernment to replace the term “mental retardation” with ID in every
context. Therefore, we will use the term ID in this article to refer to “mental retardation” from now on.
Environmental and genetic causes of intellectual disability
ID can be caused by a variety of environmental and genetic causes, often combined with each other8–12. As illustrated in Figure 2, most
of these causes exert their effects already during prenatal life. As indicated in table 1 of Chiurazzi and Oostra13, the severity of the
clinical presentation is loosely correlated with the causal factor, and gross chromosomal imbalances, perinatal asphyxia, prenatal infec-tions, or vascular accidents are related to the most severe cases. Variable (and dose-related) effects result from maternal exposure to toxic substances during pregnancy (e.g. environmental chemicals, use of drugs, and alcohol abuse), maternal conditions such as diabe-tes or phenylketonuria, and premature birth. Common (but prevent-able) environmental causes of ID are iodine deficiency and mal-nutrition (of both mother and child), affecting millions of people in “developing countries”. The frequency of these various factors varies greatly among different countries and depends on (maternal) lifestyle as well as health-care quality.
Mendelian causes of ID result in highly variable phenotypes rang-ing from mild (IQ of 55–70) to moderate (IQ of 40–55), severe (IQ of 25–40), and profound (IQ of less than 25), depending on the
Figure 2. Schematic representation of neurodevelopmental stages, related to genetic and environmental factors and their time window. *For genetic factors, the onset of symptoms or time of detection is shown. Modified from 79.
gene or genes involved, the effects of the mutation (dosage changes, loss-of-function mutation, and gain-of-function mutations), and the function(s) of the altered protein(s).
Clinically, it is useful to distinguish syndromic from nonsyndro-mic forms of ID, depending on the involvement of other organs and the presence (or absence) of malformations or a typical (facial) gestalt (or both). However, it is not uncommon to observe that some mutations in a given gene cause a syndrome but that other muta-tions in the same gene lead to nonsyndromic or “pure” forms of ID. Comorbidity with autism, epilepsy, and neuromuscular deficits (e.g. ataxia, spastic paraplegia, sensory/motor neuropathy, and muscular dystrophy) is common for nonsyndromic ID.
Development of a functional brain depends on a precise and com-plex sequence of neuronal and glial cell proliferation, migration, and maturation. Some ID syndromes are associated with gross brain malformations (e.g. holoprosencephaly, schizencephaly, porencephaly, hydrocephalus, agenesis of corpus callosum, and cerebellar hypoplasia) or with neuronal migration disorders (e.g. lissencephaly, micropolygyria, double cortex, and ventricular nodular heterotopia) that can be assessed by neuroimaging tech-niques. However, even in the presence of a morphologically normal brain, neuronal connectivity could be altered by a dysfunction of the glia (e.g. disorders of myelination) or neuronal crosstalk might be altered at the synaptic level, either because of a reduced number of mature dendritic spines or because of inefficient (or excessive) synaptic transmission14. Finally, even if both neurons and glial
cells are well positioned, connected, and working, they could be damaged by toxic compounds accumulating in metabolic disor-ders (toxic neurodegeneration). A careful clinical evaluation of the patient(s), including reconstruction of personal and family history, possibly integrated by neuroimaging or neurophysiological tests or both, may provide essential clues to reach a diagnosis and identify a specific cause of ID6,15,16.
A special note must be made for the extensive overlap between causes (and pathogenic pathways) of ID and those of autism or ASDs, since many patients have both ID and compromised social interaction and communication and vice versa17–19. For example,
more than 100 genes and 40 genomic loci associated with ASD had been reviewed by Betancur in 201120 and all of these were also
involved in ID.
Counting conditions with intellectual disability using OMIM
Curated lists of genes involved in ID have been published by some groups. Gilissen et al.21 created two lists including 528 genes
with a “confirmed” pathogenetic role and 628 “candidate” genes with mutations reported in fewer than five patients. Another com-prehensive list (DDG2P) was prepared to assist the Deciphering Developmental Disorders Study22, including 925 “confirmed”
developmental disorder genes up to November 201323. Yet another
list of 565 genes associated with ID (253 “known” and 312 “candidate”) has been reported by Grozeva et al.24, who used the
two previous lists as a starting point.
We decided to obtain an independent gene list by using OMIM and the National Center for Biotechnology Information (NCBI) GENE databases. To identify most (if not all) conditions with ID, we searched for entries with either “mental retardation” or “develop-mental delay”, “intellectual disability”, and “cognitive impairment” in the Clinical Synopsis. It is worth noting that, at least in OMIM, the term “mental retardation” is still the most common (followed by “developmental delay”) term found in the Clinical Synopsis of 981 OMIM entries. Furthermore, only conditions for which at least one gene has been identified were included. This OMIM search resulted in 900 conditions (listed in SupplementaryTable 1) and was performed by using the following search string:
((((mental retardation[Clinical Synopsis]) OR developmental delay[Clinical Synopsis]) OR intellectual disability[Clinical Syn-opsis]) OR cognitive impairment[Clinical SynSyn-opsis]) AND “prefix pound”[Properties].
These 900 conditions include several “genomic disorders” (i.e. microdeletion/duplication conditions such as Williams, velo-cardio- facial, and Wolf-Hirschhorn) and even Down syndrome. It is known that a few syndromes associated with these recurrent submicro-scopic chromosomal aberrations are actually due to the altered dosage of just one gene25–27. However, to obtain a list of single genes
underlying ID, after transferring the 900 conditions from OMIM to the NCBI GENE database (Figure 3) and finding 897 items, we manually removed 79 entries without a precise chromosomal loca-tion, including those corresponding to genomic disorders (that may be potentially due to more than one gene). This final list contains 818 protein-coding genes and has been ordered either by map_location or by alphabetical order of gene symbol (see SupplementaryTable 2). In both lists, removed items are indicated in red.
Mapping intellectual disability genes and enrichment on the X chromosome
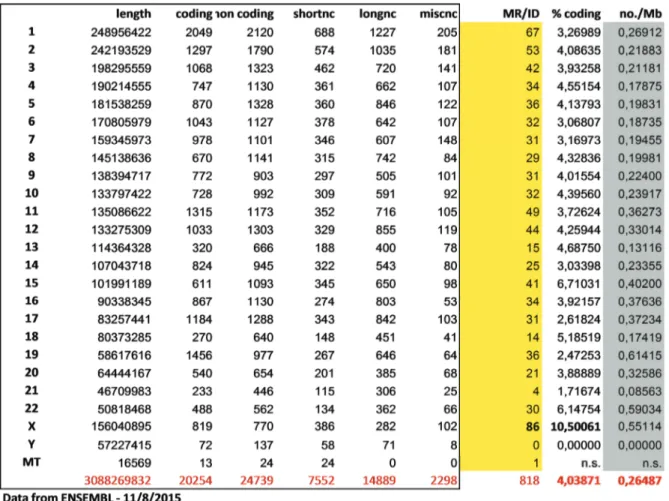
We then used the Genome Decoration page at NCBI to map the identified genes on the human karyogram (Figure 4). Not surpris-ingly, the density of ID genes is higher in G-negative bands that are typically richer in protein-coding genes. Figure 5 is derived from SupplementaryTable 2 and counts the number and proportion of ID genes relative to all protein-coding genes for each individual chromosome. The X chromosome appears to be enriched for genes mutated in patients with ID, be they syndromic or not (10% of all protein-coding genes on the X compared with 4% of the genomic average). Actually, the total number of X-linked ID (XLID) genes is higher than that (86) shown in Figure 5: now (March 2016) the total number of XLID genes is more than 100 out of about 800 protein-coding genes on the X chromosome28–30. XLID genes have been
identified earlier than autosomal ID genes because of their inher-itance pattern that allows transmission through several unaffected carrier females, and they may explain part of the reported excess of male patients with ID31,32. However, is this enrichment real or
sim-ply due to ascertainment bias, since the identification of X-linked families is easier? Twenty-five years after the cloning of the first XLMR gene (FMR1, inactivated in the fragile X syndrome), we still do not have a definitive answer to this question and we may have
Figure 3. Counts of the major terms describing impaired development of cognitive functions in OMIM. The largest number indicated in black on the upper left of each term is the total number of counts without any limits, whereas the number of entries with the term specified in the Clinical Synopsis is indicated in blue on the lower left. To the right of each term are the counts of entries containing the term linked to at least one gene (upper right with a pound prefix [#], in black) and all entries containing the term in their Clinical Synopsis AND being linked to at least one gene (lower right with a pound prefix [#], in red). OMIM, Online Mendelian Inheritance in Man.
to wait until all ID genes have been identified to settle the dispute. However, several authors suggested the possibility that “intelligence genes” actually concentrated on the X chromosome because of a selective advantage in males32–34; this evolutionary effect would also
explain why intelligence scores appear to be more variable in males compared with females (i.e. males tend to be over-represented at both ends of the general intelligence overall distribution)35.
Over the years, we and others have kept track of XLID conditions and genes29,36–39, and both sequencing40,41 as well as microdeletion/
duplication searches42 have been used to identify genetic
determi-nants of XLID. More genes are still being identified with exome sequencing of informative families30.
On the other hand, many syndromes with ID have been linked to auto-somal loci, and in recent years a quest for ID genes on the autosomes has progressed rapidly. Recessive forms of both syndromic and “pure” ID have been identified thanks to the study of large consan-guineous families coming from non-European countries like Iran43,44.
However, large recessive pedigrees are rare, whereas many sporadic cases are observed among children of non-consanguineous parents,
suggesting an autosomal dominant de novo origin45,46. These cases
can be diagnosed by using next-generation sequencing (NGS) analysis techniques47 that have become available at more affordable
prices in recent years.
Depending on the clinical signs and after an initial screening for fragile X syndrome (mostly with polymerase chain reaction [PCR]-based techniques) and for copy number variants (CNVs), usually with array comparative genomic hybridization (array-CGH), many patients will hopefully receive a diagnosis thanks to NGS using resequencing gene panels, whole exome sequencing (WES), or WGS. Resequencing panels with tens or even hundreds of genes are very useful to screen large cohorts of patients in a cost-effective way and with sufficient confidence to write a report. For example, a diagnostic NGS test screening 99 X-linked and 118 autosomal genes48 has identified a causative mutation in 25% of 96 male
and 10 female patients with ID (who had previously tested nega-tive for fragile X and had a normal array-CGH). If WES or WGS is employed and a de novo mutation is suspected, it is useful to analyze the proband-parents trio in order to reduce the number of variants. Finally, a note of caution should be made about the
Figure 4. Mapping of the intellectual disability genes on the human karyogram (G-banded) using the Genome Decoration page at National Center for Biotechnology Information. See website at http://www.ncbi.nlm.nih.gov/genome/tools/gdp. Please note that genes causing ID tend to concentrate in G-negative bands, like all other genes. CI, cognitive impairment; DD, developmental delay; ID, intellectual disability; MR, mental retardation.
interpretation of rare variants: even a de novo loss-of-function muta-tion should not be automatically considered pathogenic, as pointed out by Piton et al.29 for some XLID genes.
Gene Ontology analysis of intellectual disability genes
To provide an overview of the functions of the proteins encoded by genes listed in SupplementaryTable 2, we performed a GO analysis using the free tool DAVID (Database for Annotation, Visualization, and Integrated Discovery) 6.7 (https://david.ncifcrf. gov/)49. We analyzed the 818 official gene symbols with the
following DAVID tools: functional clustering, functional annota-tion, and functional table. To perform the analysis, we selected only the three main GO categories: Biological Process (BP_all), Molecular Function (MF_all), and Cellular Component (CC_all). We used medium stringency and default settings for the analysis, selecting Homo sapiens as the background species.
Of the 818 gene symbols, 774 (95%) were present in the DAVID GO dataset. Unmapped IDs are listed in Supplementary Table 3a. The three DAVID functionalities summarize the results in different
Figure 5. Distribution of intellectual disability genes per chromosome and comparison with the total amount of protein-coding and non-coding genes located on each chromosome. longnc, long non-coding; Mb, megabase; miscnc, miscellaneous non-coding; MR/ID, known mental retardation/intellectual disability genes; shortnc, short non-coding.
ways, providing a clustering of the GO terms on the basis of fold enrichment and relationships among ontology terms (functional clustering; see SupplementaryTable 3b) or providing statistics of the ontology terms present in the results (functional annotation; see Supplementary Table 3c). The functional chart (see Supplemen-taryTable 3d) reports the GO description for each gene present in the input list. We used functional clustering to highlight the over- represented GO terms, using an arbitrary fold enrichment cutoff of 10.00 (see Supplementary Table 3e). These clusters show an enrichment of cellular organelle (mainly mitochondria) assembly and functions.
GO results, by definition, are redundant and thus can be difficult to visualize. In fact, GO vocabularies are created as acyclic graphs, in which each term follows a hierarchical structure and has a “parent term” and a “child term”, and the complexity is increased by the
fact that each term is allowed to have multiple parent and child terms. This confers multiple levels of interpretation to the GO anal-ysis, although the increasing number of parent/child terms does not always add useful information50,51. To overcome this issue, DAVID
functional annotation results, together with their relative p values and fold enrichment values (see Supplementary Table 3f), were further used for REViGO (Reduce + Visualize Gene Ontology) analysis (http://revigo.irb.hr/)52. All terms were included, using the
following parameters: allowed similarity = 0.5 (small); first values provided = p values; database with GO term sizes = Homo sapiens; semantic similarity measure = SimRel. We decided to use the tree view for each main category (Biological Process, Cellular Component, and Molecular Function). Figure 6 shows the two graphs obtained with REViGO summarizing the over-represented (a) Biological Process or (b) Cellular Component GO terms associated with the 818 ID genes. These pictures underline that
Figure 6. REViGO tree analysis of over-represented Gene Ontology terms obtained with DAVID and associated with the 818 intellectual disability genes. Panel (a) shows Biological Process terms and panel (b) shows Cellular Component terms. DAVID, Database for Annotation, Visualization, and Integrated Discovery; REViGO, Reduce + Visualize Gene Ontology.
b
a
multiple essential metabolic pathways, especially those related to energy production, are highly associated with the 818 ID genes (a). Also, the Cellular Component GO terms are diversified (b), and mitochondria are well represented.
Finally, we evaluated the 818 ID gene list with g:Profiler53,54, another
useful GO annotation tool (http://biit.cs.ut.ee/gprofiler/), which scans not only GO terms but also other datasets like the Human Phenotype Ontology project55. Results obtained with g:Profiler are reported
in detail in SupplementaryTable 4 and confirm the variety of cel-lular components involved in ID pathogenesis, and mitochondria again show up in the list (see SupplementaryTable 4c), and among the top GO Biological Processes are “(central) nervous system development” and “neurogenesis” (see SupplementaryTable 4b). Interestingly, when the Human Phenotype Ontology terms are examined (see SupplementaryTable 4e), the first two terms of the list (with a highly significant p value of 9.61 × 10-297) are
“Neurode-velopmental abnormality” and “Intellectual disability”, followed by “Abnormality of nervous system physiology” (p value: 7.36 × 10-169)
and “Neurodevelopmental delay” (p value: 9.14 × 10-143).
Identification of (new) intellectual disability genes
Several strategies have been employed to identify ID genes over the years. A thorough clinical examination of the proband(s) and the reconstruction of the family history are mandatory15 before any
attempt is made to pinpoint the responsible gene. In fact, understand-ing the genetic context (sporadic/familial and dominant/recessive) and collecting all clinical evidence (“diagnostic handles”) facilitate reaching a diagnosis. Furthermore, fragile X syndrome should be excluded by using the available PCR-based tests, considering the frequency of this condition and the dynamic nature of most muta-tions in the FMR1 gene56, and array-CGH should be performed as a
first-tier test to detect or exclude the presence of potentially relevant CNVs57. It is important to remember that if a CNV is detected, not
only is the gene content of the deleted/duplicated region important but also the potential “position effects” (due to deletion or displace-ment of enhancers) are extremely relevant58–60. However, even if
array-CGH results were normal, a standard karyotype and confirm-atory fluorescence in situ hybridization (FISH) analysis would still be necessary if a balanced translocation/inversion is suspected. Then, if clinical examination and the first-tier tests (fragile X and array-CGH) are normal and balanced chromosomal aberrations have been excluded, direct searching for single-nucleotide variants (SNVs) or small insertions/deletions (indels) may be performed by using NGS techniques. Depending on the available resources, including bioinformatic support, either a large panel of known or candidate ID genes can be screened (as shown by 48) or the (cur-rently known) human exome (WES) or genome (WGS) could be investigated. These latter approaches can potentially identify “new genes” responsible for ID, although the number of variants
identified in each patient is challenging and not always easily interpreted41. The availability of at least the patient’s parents (trio
analysis) facilitates variant interpretation45, and many laboratories
prefer to invest the extra resources in order to increase the chances of reaching a diagnosis.
When examining the results of any WES/WGS experiment, known disease genes (e.g. OMIM genes) should be examined first if mutations are identified in any of them, even if the phenotype of proband(s) does not correspond to that already reported in the literature, since phenotypic heterogeneity is common in human genetics. Furthermore, SNV or indels identified in regulatory and untranscribed or untranslated regions of a specific ID gene could eventually be linked to abnormal transcript levels that cause the disease phenotype, as was found to occur in the X-linked HCFC1 gene61; however, such sequence changes are extremely difficult to
detect since they do not fall in the open reading frame and their effect might be appreciated only if mRNA levels were quantitated62.
In any case, a (long) list of potentially causative variants in several genes is the typical result of WES/WGS experiments and there-fore prioritization of candidate variants (based on the presumed effect on the encoded protein)63 is very important to identify the
(new) causative ID genes64. Gene prioritization establishes a
rank-ing of candidate genes on the basis of their relevance to the bio-logical process of interest: this is a critical process since the “real” causative gene might be excluded from further analysis depend-ing on the criteria chosen by the researcher. Several computational approaches have been developed for selecting disease candidate genes65,66 on the basis of either functional (what they do) or
topo-logical (where they do it) similarity to known disease genes. In the postgenomic era, when large sets of data are available on the majority of human genes, numerous correlations can be established to connect genes in networks on the basis of their sequence similar-ity (paralogues encoding similar proteins), similar transcriptional profile (genes with the same expression in various tissues), similar protein function (GO description), or interaction of the encoded proteins (genes encoding interacting proteins). Systems biology, by integrating heterogeneous datasets such as expression data, sequence information, functional annotation, and the biomedical literature, allows reconstruction of gene networks and molecular pathways relevant for the different physiological and pathological conditions and accelerates the interpretation of monogenic as well as complex neurodevelopmental conditions67.
Very recently, software packages like Exomizer68, PhenIX69, and
OVA70 have been made available that also incorporate phenotypic
information in the prioritization process, significantly increasing its efficiency71. This extra layer of information, directly related to
bioinformatics analysis pipeline thanks to the terminology stand-ardization efforts of the Human Phenotype Ontology project55.
Finally, given the association between some human diseases and non-coding RNAs72, it is important to keep in mind the possible
role of non-coding RNAs in the pathogenesis of ID, as suggested by the analysis performed by Gudenas and Wang73 on long
non-coding RNAs and CNVs in ID patients. In fact, pathogenic muta-tions in RNAs that do not code for proteins shall not be detected by WES and may also be missed by WGS, depending on the quality of sequence annotation.
Transcriptional profiles, Brain ratio, and Fetal Brain ratio
Probably one of the most relevant factors determining the relevance of a specific gene in causing a given phenotype is its transcriptional profile. When manually inspecting the results of WES/WGS experi-ments, immediately after scoring for the effect of identified variants on protein sequence, researchers ask about the expression of the candidate gene in the relevant tissue (e.g. brain for the ID phenotype). A number of databases collect mRNA expression data of multiple experiments (for example, the Gene Expression Omnibus [GEO] database, which is available at http://www.ncbi.nlm.nih.gov/geo/). A user-friendly gene expression portal is BioGPS (available at http://biogps.org/), initially established by the Genomics Institute of the Novartis Research Foundation74,75. Five reference datasets
can be visualized with BioGPS, but the most reliable human dataset (GEO dataset GSE1133) explores 79 human tissues—including 21 from the central nervous system (CNS)—and was obtained in 2004 with the Affymetrix U133A arrays76.
We decided to reanalyze the transcriptional profile of 30 brain areas and 49 other tissues of the human body (all in triplicate) that were explored with the Affymetrix U133 Plus 2.0 (a more recent chip with more identified transcripts) by Neurocrine (GEO dataset GSE7307 entitled “Human body index - transcriptional profiling”). Part of this dataset (comprising 20 CNS areas) has been reported by Roth et al.77 (2006), but the complete dataset is more
comprehen-sive and gives the opportunity to visualize the transcriptional profile of 20,588 annotated genes and to compare the CNS and the rest of the body. In our analysis, we used the Neurocrine dataset to priori-tize all available protein-coding genes on the basis of their relative expression level in the brain78. In fact, since the absolute
expres-sion value of a given transcript varies considerably compared with others, we first calculated an average level of expression in both CNS and non-CNS tissues for each available transcript and then we derived a “Brain ratio” (BR) defined as the average expression in (adult) CNS divided by the average expression in all other tissues. Such a ratio allows an easy and efficient comparison between genes with different “absolute” levels of transcription, highlighting those that are relatively more expressed in brain and therefore presumably more important for CNS function (and presumably cognition). We
then ranked all 20,588 annotated genes by decreasing BR and found that approximately 8% of all protein-coding genes have a BR above 2 but that approximately 10% of the 818 ID genes and approxi-mately 25% of all XLID genes have a BR above 278. Supplementary Table 5 reports the list of the 84 ID genes with a BR of more than 2 (plus two more genes immediately following in the ranking in posi-tions 85 and 86) and their corresponding calculated BRs as well as the functional clustering and annotation obtained with DAVID and the list of GO terms used for REViGO. Finally, we also calculated a “Fetal Brain ratio” (fBR) (expression in fetal brain divided by average expression in adult CNS), and the list of 64 (out of the 818) ID genes with an fBR above 2 is reported in SupplementaryTable 6 along with the results of the DAVID analysis.
Careful inspection of SupplementaryTable 5a suggests that genes with a high BR are usually mutated in nonsyndromic (“pure”) forms of ID but that ID genes with a lower BR (being more ubiq-uitously expressed) associate with syndromic ID conditions. Similarly, examination of SupplementaryTable 6a suggests that genes with a high fBR are sometimes mutated in brain malforma-tions, consistent with their developmental function78. Figure 6 and Figure 7 visually illustrate the above-mentioned concepts thanks to the REViGO analysis of GO terms, and the comparison of the two figures is important: whereas REViGO analysis of all 818 ID genes showed a patchwork of very different Biological Process (Figure 6a) GO terms, Figure 7a (based on the 84 ID genes with a BR of more than 2) clearly points to cell-cell signaling, synaptic function, and transmission of the nervous impulse and Figure 7b (based on the 64 ID genes with an fBR of more than 2) has 50% of GO terms pointing to regulation of transcription and the other 50% pointing to cell movements and developmental patterning. These differences are also apparent when g:Profiler is used to analyze the GO terms over-represented in these two lists (see SupplementaryTable 7).
Conclusions
To date, more than 800 genes are known to be involved in the pathogenesis of syndromic and nonsyndromic conditions with ID (see SupplementaryTable 2), and the functions of their respective proteins are very different. Since 800 out of ~4500 human disease genes currently listed in OMIM is ~18%, if we suppose that the same proportion of all human genes (~20,000) is related to ID, this would suggest that up to 3500 human genes (when mutated) could cause a Mendelian condition that includes ID as one of its components. However, this could be an overestimation since many human morbid genes currently reported by OMIM might have been identified also thanks to their ID phenotype: a more conservative estimate, based on the proportion of 10.5% of all protein-coding genes on the X involved in ID (Figure 5) that could be extended to the autosomes, leads to an estimate of approximately 2000 genes that, if mutated, would cause syndromic or nonsyndromic ID. Mutations in some of these genes might actually prove lethal during
Figure 7. REViGO tree analysis of over-represented Gene Ontology (GO) terms obtained with DAVID. Panel (a) shows GO (Biological Process) terms associated with the 86 intellectual disability (ID) genes with a Brain ratio of 2 or more, while panel (b) shows GO (Biological Process) terms associated with the 64 ID genes with a Fetal Brain ratio of 2 or more. DAVID, Database for Annotation, Visualization, and Integrated Discovery; REViGO, Reduce + Visualize Gene Ontology.
a
embryogenesis, but thanks to the new powerful sequencing techniques and more sophisticated bioinformatics pipelines, we might eventually identify all remaining protein-coding ID genes. In any case, analysis of a gene’s transcriptional profile will be useful for the prioritization of candidate genes, and their relative expres-sion in the adult or fetal CNS, estimated with the BR (or fBR), will facilitate comparison among genes with very different abso-lute levels of transcription. We have to remember that, although we expect that most genes with a high BR (e.g. above 2) will mainly impair cognition whenever mutated, the majority of ID genes are
also expressed in many other tissues (i.e. have a low BR) and will usually have a syndromic clinical presentation.
Competing interests
The authors declare that they have no competing interests. Grant information
The author(s) declared that no grants were involved in supporting this work.
1. Maulik PK, Harbour CK: Epidemiology of Intellectual Disability. In: JH Stone,
M Blouin, editors. International Encyclopedia of Rehabilitation. 2010.
Reference Source
2. Beange H, Taplin JE: Prevalence of intellectual disability in northern Sydney adults. J Intellect Disabil Res. 1996; 40(Pt 3): 191–197.
PubMed Abstract |Publisher Full Text
3. Leonard H, Petterson B, Bower C, et al.: Prevalence of intellectual disability in Western Australia. Paediatr Perinat Epidemiol. 2003; 17(1): 58–67.
PubMed Abstract |Publisher Full Text
4. Carey JC: Abbreviations and terminology surrounding autism spectrum disorders and intellectual disability. Am J Med Genet A. 2011; 155A(12): 2905.
PubMed Abstract |Publisher Full Text
5. Chiurazzi P: Mental retardation: is naming the real issue? Am J Med Genet A.
2011; 155A(5): 974–975.
PubMed Abstract |Publisher Full Text
6. Battaglia A, Carey JC: Diagnostic evaluation of developmental delay/mental
retardation: An overview. Am J Med Genet C Semin Med Genet. 2003; 117C(1):
3–14.
PubMed Abstract |Publisher Full Text
7. Salvador-Carulla L, Bertelli M: ‘Mental retardation’ or ‘intellectual disability’: time for a conceptual change. Psychopathology. 2008; 41(1): 10–16.
PubMed Abstract |Publisher Full Text
8. Inlow JK, Restifo LL: Molecular and comparative genetics of mental retardation.
Genetics. 2004; 166(2): 835–881.
PubMed Abstract |Publisher Full Text |Free Full Text
9. Chelly J, Khelfaoui M, Francis F, et al.: Genetics and pathophysiology of mental retardation. Eur J Hum Genet. 2006; 14(6): 701–713.
PubMed Abstract |Publisher Full Text
10. Raymond FL, Tarpey P: The genetics of mental retardation. Hum Mol Genet.
2006; 15(Spec No 2): R110–6.
PubMed Abstract |Publisher Full Text
11. Ropers HH: Genetics of intellectual disability. Curr Opin Genet Dev. 2008; 18(3):
Supplementary material
Supplementary Table 1 - OMIM terms search results. Click here to access the data.
Supplementary Table 2 - ID Genes identified through OMIM and NCBI Gene. Click here to access the data.
Supplementary Table 3 - DAVID analysis of ID genes. Click here to access the data.
Supplementary Table 4 - gProfiler analysis of ID genes. Click here to access the data.
Supplementary Table 5 - DAVID and REVIGO analysis of genes with Brain Ratio above 2. Click here to access the data.
Supplementary Table 6 - DAVID and REVIGO analysis of genes with Fetal Brain Ratio above 2. Click here to access the data.
Supplementary Table 7 - gProfiler analysis of genes with Brain/Fetal Brain Ratio above 2. Click here to access the data.
241–250.
PubMed Abstract |Publisher Full Text
12. Ropers HH: Genetics of early onset cognitive impairment. Annu Rev Genomics
Hum Genet. 2010; 11: 161–187.
PubMed Abstract |Publisher Full Text
13. Chiurazzi P, Oostra BA: Genetics of mental retardation. Curr Opin Pediatr. 2000; 12(6): 529–535.
PubMed Abstract
14. Dierssen M, Ramakers GJ: Dendritic pathology in mental retardation: from molecular genetics to neurobiology. Genes Brain Behav. 2006; 5(Suppl 2): 48–60.
PubMed Abstract |Publisher Full Text
15. Moeschler JB, Shevell M; Committee on Genetics: Comprehensive evaluation of the child with intellectual disability or global developmental delays. Pediatrics.
2014; 134(3): e903–18.
PubMed Abstract |Publisher Full Text
16. Srour M, Shevell M: Genetics and the investigation of developmental delay/ intellectual disability. Arch Dis Child. 2014; 99(4): 386–389.
PubMed Abstract |Publisher Full Text
17. Schwartz CE, Neri G: Autism and intellectual disability: two sides of the same coin. Am J Med Genet C Semin Med Genet. 2012; 160C(2): 89–90.
PubMed Abstract |Publisher Full Text
18. Gamsiz ED, Viscidi EW, Frederick AM, et al.: Intellectual disability is associated with increased runs of homozygosity in simplex autism. Am J Hum
Genet. 2013; 93(1): 103–109.
PubMed Abstract |Publisher Full Text |Free Full Text | F1000 Recommendation
19. De Rubeis S, He X, Goldberg AP, et al.: Synaptic, transcriptional and chromatin genes disrupted in autism. Nature. 2014; 515(7526): 209–215.
PubMed Abstract |Publisher Full Text |Free Full Text
20. Betancur C: Etiological heterogeneity in autism spectrum disorders: more than 100 genetic and genomic disorders and still counting. Brain Res. 2011; 1380:
42–77.
PubMed Abstract |Publisher Full Text
21. Gilissen C, Hehir-Kwa JY, Thung DT, et al.: Genome sequencing identifies major causes of severe intellectual disability. Nature. 2014; 511(7509): 344–347.
PubMed Abstract |Publisher Full Text | F1000 Recommendation
22. Deciphering Developmental Disorders Study: Large-scale discovery of novel genetic causes of developmental disorders. Nature. 2015; 519(7542): 223–228.
PubMed Abstract |Publisher Full Text | F1000 Recommendation
23. Wright CF, Fitzgerald TW, Jones WD, et al.: Genetic diagnosis of developmental disorders in the DDD study: a scalable analysis of genome-wide research data. Lancet. 2015; 385(9975): 1305–1314.
PubMed Abstract |Publisher Full Text |Free Full Text | F1000 Recommendation
24. Grozeva D, Carss K, Spasic-Boskovic O, et al.: Targeted Next-Generation Sequencing Analysis of 1,000 Individuals with Intellectual Disability. Hum
Mutat. 2015; 36(12): 1197–1204.
PubMed Abstract |Publisher Full Text | F1000 Recommendation
25. Kumar D: Disorders of the genome architecture: a review. Genomic Med. 2008; 2(3–4): 69–76.
PubMed Abstract |Publisher Full Text |Free Full Text
26. Vissers LE, Stankiewicz P: Microdeletion and microduplication syndromes.
Methods Mol Biol. 2012; 838: 29–75.
PubMed Abstract |Publisher Full Text
27. Zollino M, Orteschi D, Murdolo M, et al.: Mutations in KANSL1 cause the
17q21.31 microdeletion syndrome phenotype. Nat Genet. 2012; 44(6): 636–638.
PubMed Abstract |Publisher Full Text | F1000 Recommendation
28. Lubs HA, Stevenson RE, Schwartz CE: Fragile X and X-linked intellectual disability: four decades of discovery. Am J Hum Genet. 2012; 90(4): 579–590.
PubMed Abstract |Publisher Full Text |Free Full Text
29. Piton A, Redin C, Mandel JL: XLID-causing mutations and associated genes challenged in light of data from large-scale human exome sequencing.
Am J Hum Genet. 2013; 93(2): 368–383.
PubMed Abstract |Publisher Full Text |Free Full Text | F1000 Recommendation
30. Hu H, Haas SA, Chelly J, et al.: X-exome sequencing of 405 unresolved families identifies seven novel intellectual disability genes. Mol Psychiatry. 2016; 21(1):
133–148.
PubMed Abstract |Publisher Full Text
31. Lehrke R: Theory of X-linkage of major intellectual traits. Am J Ment Defic. 1972; 76(6): 611–619.
PubMed Abstract
32. Lubs HA: The other side of the coin: a hypothesis concerning the importance of genes for high intelligence and evolution of the X chromosome.
Am J Med Genet. 1999; 85(3): 206–208.
PubMed Abstract | Publisher Full Text | F1000 Recommendation
33. Skuse DH: X-linked genes and mental functioning. Hum Mol Genet. 2005; 14(Spec No 1): R27–32.
PubMed Abstract |Publisher Full Text | F1000 Recommendation
34. Graves JA, Koina E, Sankovic N: How the gene content of human sex chromosomes evolved. Curr Opin Genet Dev. 2006; 16(3): 219–224.
PubMed Abstract |Publisher Full Text | F1000 Recommendation
35. Johnson W, Carothers A, Deary IJ: A Role for the X Chromosome in Sex Differences in Variability in General Intelligence? Perspect Psychol Sci. 2009; 4(6): 598–611.
PubMed Abstract |Publisher Full Text
36. Chelly J, Mandel JL: Monogenic causes of X-linked mental retardation. Nat Rev
Genet. 2001; 2(9): 669–680.
PubMed Abstract |Publisher Full Text
37. Ropers HH, Hamel BC: X-linked mental retardation. Nat Rev Genet. 2005; 6(1):
46–57.
PubMed Abstract |Publisher Full Text
38. Chiurazzi P, Schwartz CE, Gecz J, et al.: XLMR genes: update 2007. Eur J Hum
Genet. 2008; 16(4): 422–434.
PubMed Abstract |Publisher Full Text
39. Gécz J, Shoubridge C, Corbett M: The genetic landscape of intellectual disability arising from chromosome X. Trends Genet. 2009; 25(7): 308–316.
PubMed Abstract |Publisher Full Text
40. Tarpey PS, Smith R, Pleasance E, et al.: A systematic, large-scale resequencing screen of X-chromosome coding exons in mental retardation. Nat Genet. 2009; 41(5): 535–543.
PubMed Abstract |Publisher Full Text |Free Full Text | F1000 Recommendation
41. Raymond FL, Whibley A, Stratton MR, et al.: Lessons learnt from large-scale exon re-sequencing of the X chromosome. Hum Mol Genet. 2009; 18(R1): R60–4.
PubMed Abstract |Publisher Full Text |Free Full Text
42. Whibley AC, Plagnol V, Tarpey PS, et al.: Fine-scale survey of X chromosome copy number variants and indels underlying intellectual disability. Am J Hum
Genet. 2010; 87(2): 173–188.
PubMed Abstract |Publisher Full Text |Free Full Text
43. Najmabadi H, Hu H, Garshasbi M, et al.: Deep sequencing reveals 50 novel genes for recessive cognitive disorders. Nature. 2011; 478(7367): 57–63.
PubMed Abstract |Publisher Full Text | F1000 Recommendation
44. Musante L, Ropers HH: Genetics of recessive cognitive disorders. Trends Genet.
2014; 30(1): 32–39.
PubMed Abstract |Publisher Full Text
45. Vissers LE, de Ligt J, Gilissen C, et al.: A de novo paradigm for mental
retardation. Nature genetics. 2010; 42(12): 1109–1112.
PubMed Abstract |Publisher Full Text | F1000 Recommendation
46. Veltman JA, Brunner HG: De novo mutations in human genetic disease. Nat Rev
Genet. 2012; 13(8): 565–575.
PubMed Abstract |Publisher Full Text
47. Topper S, Ober C, Das S: Exome sequencing and the genetics of intellectual disability. Clin Genet. 2011; 80(2): 117–126.
PubMed Abstract |Publisher Full Text |Free Full Text
48. Redin C, Gérard B, Lauer J, et al.: Efficient strategy for the molecular diagnosis of intellectual disability using targeted high-throughput sequencing.
J Med Genet. 2014; 51(11): 724–736.
PubMed Abstract |Publisher Full Text |Free Full Text | F1000 Recommendation
49. Huang da W, Sherman BT, Lempicki RA: Systematic and integrative analysis of large gene lists using DAVID bioinformatics resources. Nat Protoc. 2009; 4(1):
44–57.
PubMed Abstract |Publisher Full Text
50. Gene Ontology Consortium: Creating the gene ontology resource: design and implementation. Genome Res. 2001; 11(8): 1425–1433.
PubMed Abstract |Publisher Full Text |Free Full Text
51. Jantzen SG, Sutherland BJ, Minkley DR, et al.: GO Trimming: Systematically reducing redundancy in large Gene Ontology datasets. BMC Res Notes. 2011; 4: 267.
PubMed Abstract |Publisher Full Text |Free Full Text
52. Supek F, Bošnjak M, Škunca N, et al.: REVIGO summarizes and visualizes long lists of gene ontology terms. PLoS One. 2011; 6(7): e21800.
PubMed Abstract |Publisher Full Text |Free Full Text
53. Reimand J, Kull M, Peterson H, et al.: g:Profiler--a web-based toolset for functional profiling of gene lists from large-scale experiments. Nucleic Acids
Res. 2007; 35(Web Server issue): W193–200.
PubMed Abstract |Publisher Full Text |Free Full Text
54. Reimand J, Arak T, Vilo J: g:Profiler--a web server for functional interpretation of gene lists (2011 update). Nucleic Acids Res. 2011; 39(Web Server issue):
W307–15.
PubMed Abstract |Publisher Full Text |Free Full Text
55. Köhler S, Doelken SC, Mungall CJ, et al.: The Human Phenotype Ontology project: linking molecular biology and disease through phenotype data.
Nucleic Acids Res. 2014; 42(Database issue): D966–74.
PubMed Abstract |Publisher Full Text |Free Full Text
56. Monaghan KG, Lyon E, Spector EB, et al.: ACMG Standards and Guidelines for fragile X testing: a revision to the disease-specific supplements to the Standards and Guidelines for Clinical Genetics Laboratories of the American College of Medical Genetics and Genomics. Genet Med. 2013; 15(7): 575–586.
PubMed Abstract |Publisher Full Text | F1000 Recommendation
57. South ST, Lee C, Lamb AN, et al.: ACMG Standards and Guidelines for constitutional cytogenomic microarray analysis, including postnatal and prenatal applications: revision 2013. Genet Med. 2013; 15(11): 901–909.
PubMed Abstract |Publisher Full Text | F1000 Recommendation
genome and their alteration in human disease. Bioessays. 2013; 35(6): 533–543.
PubMed Abstract |Publisher Full Text
59. Ibn-Salem J, Köhler S, Love MI, et al.: Deletions of chromosomal regulatory boundaries are associated with congenital disease. Genome Biol. 2014; 15(9): 423.
PubMed Abstract |Publisher Full Text |Free Full Text
60. Lupiáñez DG, Kraft K, Heinrich V, et al.: Disruptions of topological chromatin domains cause pathogenic rewiring of gene-enhancer interactions. Cell. 2015; 161(5): 1012–1025.
PubMed Abstract |Publisher Full Text |Free Full Text | F1000 Recommendation
61. Huang L, Jolly LA, Willis-Owen S, et al.: A noncoding, regulatory mutation implicates HCFC1 in nonsyndromic intellectual disability. Am J Hum Genet. 2012; 91(4): 694–702.
PubMed Abstract |Publisher Full Text |Free Full Text | F1000 Recommendation
62. Zhang L, Jie C, Obie C, et al.: X chromosome cDNA microarray screening identifies a functional PLP2 promoter polymorphism enriched in patients with
X-linked mental retardation. Genome Res. 2007; 17(5): 641–648.
PubMed Abstract |Publisher Full Text |Free Full Text | F1000 Recommendation
63. Castellana S, Mazza T: Congruency in the prediction of pathogenic missense mutations: state-of-the-art web-based tools. Brief Bioinform. 2013; 14(4):
448–459.
PubMed Abstract |Publisher Full Text
64. Kou Y, Betancur C, Xu H, et al.: Network- and attribute-based classifiers can prioritize genes and pathways for autism spectrum disorders and intellectual disability. Am J Med Genet C Semin Med Genet. 2012; 160C(2): 130–142.
PubMed Abstract |Publisher Full Text |Free Full Text
65. Moreau Y, Tranchevent LC: Computational tools for prioritizing candidate genes: boosting disease gene discovery. Nat Rev Genet. 2012; 13(8):
523–536.
PubMed Abstract |Publisher Full Text | F1000 Recommendation
66. Zhu C, Wu C, Aronow BJ, et al.: Computational approaches for human disease gene prediction and ranking. Adv Exp Med Biol. 2014; 799: 69–84.
PubMed Abstract |Publisher Full Text | F1000 Recommendation
67. Parikshak NN, Gandal MJ, Geschwind DH: Systems biology and gene networks in neurodevelopmental and neurodegenerative disorders. Nat Rev Genet. 2015; 16(8): 441–458.
PubMed Abstract |Publisher Full Text |Free Full Text
68. Robinson PN, Köhler S, Oellrich A, et al.: Improved exome prioritization of disease genes through cross-species phenotype comparison. Genome Res.
2014; 24(2): 340–348.
PubMed Abstract |Publisher Full Text |Free Full Text | F1000 Recommendation
69. Zemojtel T, Köhler S, Mackenroth L, et al.: Effective diagnosis of genetic disease by computational phenotype analysis of the disease-associated genome. Sci Transl Med. 2014; 6(252): 252ra123.
PubMed Abstract |Publisher Full Text |Free Full Text | F1000 Recommendation
70. Antanaviciute A, Watson CM, Harrison SM, et al.: OVA: integrating molecular and physical phenotype data from multiple biomedical domain ontologies with variant filtering for enhanced variant prioritization. Bioinformatics. 2015; 31(23):
3822–3829.
PubMed Abstract |Publisher Full Text |Free Full Text | F1000 Recommendation
71. Smedley D, Robinson PN: Phenotype-driven strategies for exome prioritization of human Mendelian disease genes. Genome Med. 2015; 7(1): 81.
PubMed Abstract |Publisher Full Text |Free Full Text
72. Kagami H, Akutsu T, Maegawa S, et al.: Determining Associations between Human Diseases and non-coding RNAs with Critical Roles in Network Control.
Sci Rep. 2015; 5: 14577.
PubMed Abstract |Publisher Full Text |Free Full Text
73. Gudenas BL, Wang L: Gene Coexpression Networks in Human Brain Developmental Transcriptomes Implicate the Association of Long Noncoding RNAs with Intellectual Disability. Bioinform Biol Insights. 2015; 9(Suppl 1): 21–27.
PubMed Abstract |Publisher Full Text |Free Full Text | F1000 Recommendation
74. Wu C, Orozco C, Boyer J, et al.: BioGPS: an extensible and customizable portal for querying and organizing gene annotation resources. Genome Biol. 2009; 10(11): R130.
PubMed Abstract |Publisher Full Text |Free Full Text
75. Wu C, Macleod I, Su AI: BioGPS and MyGene.info: organizing online, gene-centric information. Nucleic Acids Res. 2013; 41(Database issue): D561–5.
PubMed Abstract |Publisher Full Text |Free Full Text
76. Su AI, Wiltshire T, Batalov S, et al.: A gene atlas of the mouse and human protein-encoding transcriptomes. Proc Natl Acad Sci U S A. 2004; 101(16):
6062–6067.
PubMed Abstract |Publisher Full Text |Free Full Text | F1000 Recommendation
77. Roth RB, Hevezi P, Lee J, et al.: Gene expression analyses reveal molecular relationships among 20 regions of the human CNS. Neurogenetics. 2006; 7(2):
67–80.
PubMed Abstract |Publisher Full Text
78. Chiurazzi P, Moscato U, van der Spek PJ, et al.: Transcriptional profiling, brain ratio and the search of human genes involved in mental retardation.
[Manuscript submitted]. 2016.
79. Tau GZ, Peterson BS: Normal development of brain circuits.
Neuropsychopharmacology. 2010; 35(1): 147–168.