R E S E A R C H
Open Access
Innate immune responses induced by
lipopolysaccharide and lipoteichoic acid in
primary goat mammary epithelial cells
Omar Bulgari
1,2, Xianwen Dong
1,3, Alfred L. Roca
1, Anna M. Caroli
2and Juan J. Loor
1,4*Abstract
Background: Innate immune responses induced by in vitro stimulation of primary mammary epithelial cells (MEC) using Gram-negative lipopolysaccharide (LPS) and Gram-positive lipoteichoic acid (LTA) bacterial cell wall components are well- characterized in bovine species. The objective of the current study was to characterize the downstream regulation of the inflammatory response induced by Toll-like receptors in primary goat MEC (pgMEC). We performed quantitative real-time RT-PCR (qPCR) to measure mRNA levels of 9 genes involved in transcriptional regulation or antibacterial activity: Toll-like receptor 2 (TLR2), Toll-like receptor 4 (TLR4), prostaglandin-endoperoxide synthase 2 (PTGS2), interferon induced protein with tetratricopeptide repeats 3 (IFIT3), interferon regulatory factor 3 (IRF3), myeloid differentiation primary response 88 (MYD88), nuclear factor of kappa light polypeptide gene enhancer in B-cells 1 (NFKB1), Toll interacting protein (TOLLIP), and lactoferrin (LTF). Furthermore, we analyzed 7 cytokines involved in Toll-like receptor signaling pathways: C-C motif chemokine ligand 2 (CCL2), C-C motif chemokine ligand 5 (CCL5), C-X-C motif chemokine ligand 6 (CXCL6), interleukin 8 (CXCL8), interleukin 1 beta
(IL1B), interleukin 6 (IL6), and tumor necrosis factor alpha (TNF).
Results: Stimulation of pgMEC with LPS for 3 h led to an increase in expression of CCL2, CXCL6, IL6, CXCL8, PTGS2, IFIT3, MYD88, NFKB1, and TLR4 (P < 0.05). Except for IL6, and PTGS2, the same genes had greater expression than controls at 6 h post-LPS (P < 0.05). Expression of CCL5, PTGS2, IFIT3, NFKB1, TLR4, and TOLLIP was greater than controls after 3 h of incubation with LTA (P < 0.05). Compared to controls, stimulation with LTA for 6 h led to greater expression of PTGS2, IFIT3, NFKB1, and TOLLIP (P < 0.05) whereas the expression of CXCL6, CXCL8, and TLR4 was lower (P < 0.05). At 3 h incubation with both toxins compared to controls a greater expression (P < 0.05) of CCL2, CCL5, CXCL6, CXCL8, IL6, PTGS2, IFIT3, IRF3, MYD88, and NFKB1 was detected. After 6 h of incubation with both toxins, the expression of CCL2, CXCL6, IFIT3, MYD88, NFKB1, and TLR4 was higher than the controls (P < 0.05).
Conclusions: Data indicate that in the goat MEC, LTA induces a weaker inflammatory response than LPS. This may be related to the observation that gram-positive bacteria cause chronic mastitis more often than gram-negative infections.
Keywords: Gene expression, Inflammation, Lactation, Mastitis
* Correspondence:[email protected]
1
Department of Animal Sciences and Division of Nutritional Sciences, University of Illinois at Urbana-Champaign, Urbana, IL 61801, USA 4Division of Nutritional Sciences, University of Illinois at Urbana-Champaign, Urbana, IL 61801, USA
Full list of author information is available at the end of the article
© The Author(s). 2017 Open Access This article is distributed under the terms of the Creative Commons Attribution 4.0 International License (http://creativecommons.org/licenses/by/4.0/), which permits unrestricted use, distribution, and reproduction in any medium, provided you give appropriate credit to the original author(s) and the source, provide a link to the Creative Commons license, and indicate if changes were made. The Creative Commons Public Domain Dedication waiver (http://creativecommons.org/publicdomain/zero/1.0/) applies to the data made available in this article, unless otherwise stated.
Background
Mastitis is the most prevalent disease in dairy cattle, causing the largest economic losses to the industry. The economic impact of mastitis on the U.S. dairy industry was estimated at $2 billion in 2009 [1]. The transmission of microorganisms into the mammary gland may involve the transfer of pathogens from other animals directly, from the environment or from the milking process [2]. The most common causal agent of mastitis in goats is
Staphylococcus aureusfollowed by Pasteurella
haemoly-tica, Escherichia coli, Clostridium perfrigens,
Streptococ-cussp., Pseudomonas sp., and Nocardia sp. [3].
Severe clinical mastitis with systemic signs produced by
S. aureusand E. coli may be due to the action of various
cytotoxins and endotoxins leading to extensive tissue damage and systemic reactions in the animal [2, 3]. It is well established that mastitis modifies gene expres-sion [4, 5] and decreases animal performance [6, 7]. Toll-like receptors (TLR) play a central role in the innate immune system, and form a first line of defense against in-fections by recognizing pathogen associated molecular pat-terns [8]. In the goat, 10 TLRs have been identified, designated TLR1-TLR10 [9]. In particular, TLR2 recognizes lipoteichoic acid (LTA), a major constituent of Gram-positive bacteria, and TLR4 recognizes lipopolysaccharide (LPS) that is common to Gram-negative bacteria [8].
Innate immune responses induced by in vitro stimula-tion of primary mammary epithelial cells (pMEC) using LPS and LTA bacterial cell wall components are well characterized in bovine species. Numerous studies have demonstrated a potential role for TLR2 and TLR4 in the development of mastitis in dairy cattle [10], resistance to bacteria [11], and ability to affect the level of bacteria in milk [12]. Both LPS and LTA are able to cause an in-flammatory response via TLR signaling [13, 14]. Acti-vated TLR2 and TLR4 induce a common signaling pathway known as myeloid differentiation primary response 88 (MYD88)-dependent [15], and leads to the activation of kappa light polypeptide gene enhancer in B-cells 1 (NFKB1) and transcription of several pro-inflammatory genes [16].
Our hypothesis was that primary goat mammary epi-thelial cells (pgMEC) incubated with LPS or LTA have the capacity to mount innate immune responses that can be evaluated through changes in gene transcription. The objective of the present study was to characterize the downstream regulation of the inflammatory response induced by Toll-like receptors in pgMEC stimulated by LPS or LTA.
Methods
Cell culture and treatments
The pgMEC were isolated according to the method of Ogorevc and Dovč [17]. A cell culture protocol was
followed involving the use of growth medium and a lactogenic medium reported in previous studies per-formed in bovine mammary gland cells [18]. Goat pMEC stored in liquid nitrogen were thawed and cul-tured in growth medium composed of MEM/EBSS (GE Healthcare, Little Chalfont, United Kingdom) supplemented with 5 mg/L insulin (Thermo Fisher Scientific, Waltham, Massachusetts), 1 mg/L
hydro-cortisone (Sigma-Aldrich, St. Louis, Missouri), 5 μg/mL
transferrin (Sigma-Aldrich), 5 μmol/L ascorbic acid
(Sigma-Aldrich), 5 mmol/L sodium acetate (Thermo
Fisher Scientific), 10 mL/L penicillin/streptomycin
(Sigma-Aldrich), 10% fetal bovine serum (GE Healthcare), 1 mg/L progesterone (Sigma-Aldrich), 0.05% lactalbumin
(Sigma-Aldrich), 0.05% α-lactose (Sigma-Aldrich). Media
were prepared daily and filtered before use with 0.22 μm
Filter Unity Millex MP (EMD Millipore, Billerica,
Massa-chusetts). Thawed cells were seeded in 25 cm2flasks (106
cells/flask) and cultured until confluence in 5 mL growth medium. At approximately 90% confluence, the cells were washed 3 times with 6 mL PBS (Thermo Fisher Scientific), split following the application of 3 mL 0.25% trypsin (GE Healthcare) and reseeded in new 75 mL flasks at a density
of 2.5 × 10⁶ cells/flask (GE Healthcare) in 12 mL fresh
growth medium. During growth and treatments the cells
were incubated at 37 °C with 5% CO2 in Incubator
KMCC17T0 (Panasonic Healthcare, Tokyo, Japan). After
three passages, six 6-well plates were reseeded, 3 × 10⁵
cells/well, in 2.5 mL growth medium.
On the basis of similar studies in bovine pMEC, due to the scarcity of studies on goat cells, agonists inducing an appreciable change in TLR-related genes were selected: LPS from Escherichia coli O55:B5 (Sigma-Al-drich) as TLR4 agonist [19, 20] and LTA from S.
aur-eus (InvivoGen, San Diego, California) as TLR2
agonist [21, 22]. The use of LPS from E. coli 055:B5 strain was also justified by the large number of publi-cations demonstrating its agonist effect on TLR4 re-ceptor in various cell types including mammary cells [20, 23, 24]. The commercial LTA preparation was pared by the n-butanol extraction method, which pre-serves its activity while avoiding contamination [25].
After conducting a preliminary study, described in Additional file 1, aimed to select the incubation times and the most suitable concentrations for our purposes, the experiments were performed in 2.5 mL
lactogenic medium using 1 μg/mL LPS, 20 μg/mL
LTA, and the combination of both (L + L). Lactogenic
C medium was composed of Dulbecco’s High
Glucose Modified Eagle’s Medium (GE Healthcare)
supplemented with 5 mg/L insulin (Thermo Fisher Scientific), 1 mg/L hydrocortisone (Sigma-Aldrich),
5 μg/mL transferrin (Sigma-Aldrich), 5 μmol/L
(Thermo Fisher Scientific), 10 mL/L penicillin/ streptomycin (Sigma-Aldrich), 1 g/L bovine serum al-bumin Aldrich), 2.5 mg/L prolactin
(Sigma-Aldrich). Triplicate cultures (1 μg/mL LPS; 20 μg/mL
LTA; 1 μg/mL LPS + 20 μg/mL LTA) were performed
at two incubation times (3 h, 6 h). After incubation, the cell culture supernatant was removed, cells were washed 3 times with PBS 1× and total RNA was ex-tracted from the pgMEC layer. To check cell growth and confluence, a Light Inverted Microscope Primo-vert (Zeiss, Oberkochen, Germany) integrated with a high definition camera AxioCam ERc 5 s (Zeiss) was used.
RNA extraction, purification, and quality assessment
All these procedures are described in detail in Additional file 1.
Selection of genes, primer design, and quantitative RT-PCR
All these procedures are described in detail in Additional file 1.
Statistical analysis
After normalization with the geometric mean of the internal control genes (ACTB, GAPDH, and UXT),
the quantitative PCR data were log2-transformed
be-fore statistical analysis to obtain a normal distribu-tion. Statistical analyses were conducted using SAS (v 9.3; SAS Institute Inc., Cary, NC). Data were analyzed using the repeated statement ANOVA with PROC MIXED. The statistical model included time (T; 3 h and 6 h incubation), treatment (TRT; LPS, LTA, LPS + LTA and control), and their interactions (T × TRT) as fixed effects. The Kenward-Roger statement was used for computing the denominator degrees of free-dom, whereas spatial power was used as the covari-ance structure. Data were considered significant at a
P≤ 0.05 level using the PDIFF statement in SAS. For
ease of interpretation, the expression data reported as
least squares means were log2 back-transformed.
Results
Microscopy
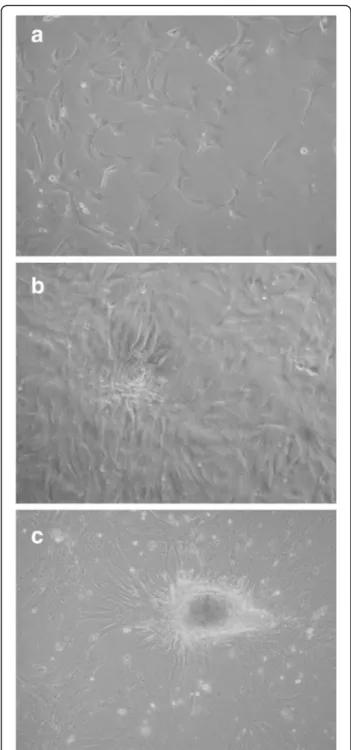
To verify the aptitude of the cells to develop typical mammary epithelial structure in culture, we carried an overgrowth experiment without harvesting the cells. During cell growth, pgMEC formed a cobblestone-like monolayer (Fig. 1a) that developed into an epithelial is-land within 3 d (Fig. 1b). By d 8, a central cell cluster within the epithelial islands developed into dense cellu-lar masses (Fig. 1c). Microscopic analysis did not reveal widespread cell death or presence of cellular debris. Our
observations are consistent with previous studies of cellular morphology of pMEC [19, 26, 27].
Gene expression
The quantitative PCR performance results are reported in Table 1. Results of the statistical analyses performed on the expression profiles are in Tables 2 and 3. The ex-pression levels of IL1B, TNF and LTF were deemed un-detectable (>30 Ct).
Fig. 1 Establishment of pgMEC in culture on a collagen matrix. a Cobblestone-like monolayer. b Epithelial island. c Dense cellular masses
Chemokines and interleukins
We observed a treatment effect for CCL2 (P < 0.0001),
CCL5 (P < 0.003), CXCL6 (P < 0.0001), CXCL8 (P <
0.0001), and IL6 (P < 0.001) (Table 2). Incubation time affected CCL5 (P < 0.004), CXCL6 (P < 0.01) and CXCL8 genes (P < 0.0001) (Table 2). Several significant differ-ences (P < 0.05) were found for the interactions between treatment and time (Table 3). Details on these differ-ences are illustrated as follows.
There was an overall increase in most transcript levels in the presence of LPS (P < 0.0001), and both toxins (P < 0.001) with respects to controls. CCL2 transcription was higher in response to both toxins vs. LTA alone (P < 0.01). The combination of both toxins decreased (P < 0.001) CCL2 transcription compared to incubation with LPS alone. The highest transcript expression occurred in samples incubated for 3 h in the presence of LPS (P < 0.0001). Compared to 3 h, at 6 h incubation the CCL2 transcription was relatively higher in response to LTA (P < 0.05) and both toxins (P < 0.01), but was lower in the presence of LPS alone (P < 0.03).
After 3 h, CCL5 transcript levels increased in samples incubated with both toxins compared to LPS alone (P < 0.0001), LTA alone (P < 0.005) and control samples (P < 0.0001). Incubation for 3 h with LTA alone increased
CCL5 transcription with respect to controls (P < 0.05).
Although no time effect was detected at 3 h for CCL5
Table 1 Quantitative PCR performance of the measured genes
Gene Median Cta MedianΔCtb Slopec (R2)d Efficiencye
CCL2 28.62 9.66 −3.29 0.997 2.011 CCL5 28.95 10.05 −3.28 0.991 2.019 CXCL6 24.29 5.23 −3.19 0.999 2.060 CXCL8 29.26 10.34 −3.11 0.994 2.097 IFIT3 24.96 6.04 −3.07 0.993 2.117 IL6 29.11 10.12 −3.34 0.993 1.992 IRF3 24.16 5.27 −3.09 0.991 2.108 MYD88 24.62 5.71 −3.02 0.991 2.143 NFKB1 26.58 7.62 −2.91 0.996 2.204 PTGS2 27.47 8.49 −3.06 0.986 2.120 TLR2 28.51 9.64 −3.31 0.999 2.006 TLR4 30.20 11.28 −2.94 0.999 2.189 TOLLIP 23.59 4.75 −3.35 0.995 1.989 a
The median is calculated considering all time points and treatments
b
The median ofΔCt is calculated as [Ct gene - geometrical mean of Ct internal controls] for each time point and treatment
c
Slope of the standard curve
d
R2
stands for the coefficient of determination of the standard curve
e
Efficiency is calculated as [10(−1/Slope)]
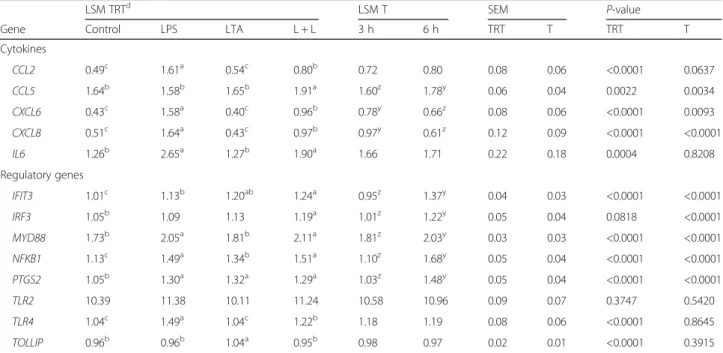
Table 2 Log2back-transformed LSM of gene transcription for treatment (TRT) and incubation time (T), SEM and P values
for TRT and T
LSM TRTd LSM T SEM P-value
Gene Control LPS LTA L + L 3 h 6 h TRT T TRT T
Cytokines CCL2 0.49c 1.61a 0.54c 0.80b 0.72 0.80 0.08 0.06 <0.0001 0.0637 CCL5 1.64b 1.58b 1.65b 1.91a 1.60z 1.78y 0.06 0.04 0.0022 0.0034 CXCL6 0.43c 1.58a 0.40c 0.96b 0.78y 0.66z 0.08 0.06 <0.0001 0.0093 CXCL8 0.51c 1.64a 0.43c 0.97b 0.97y 0.61z 0.12 0.09 <0.0001 <0.0001 IL6 1.26b 2.65a 1.27b 1.90a 1.66 1.71 0.22 0.18 0.0004 0.8208 Regulatory genes IFIT3 1.01c 1.13b 1.20ab 1.24a 0.95z 1.37y 0.04 0.03 <0.0001 <0.0001 IRF3 1.05b 1.09 1.13 1.19a 1.01z 1.22y 0.05 0.04 0.0818 <0.0001 MYD88 1.73b 2.05a 1.81b 2.11a 1.81z 2.03y 0.03 0.03 <0.0001 <0.0001 NFKB1 1.13c 1.49a 1.34b 1.51a 1.10z 1.68y 0.05 0.04 <0.0001 <0.0001 PTGS2 1.05b 1.30a 1.32a 1.29a 1.03z 1.48y 0.05 0.04 <0.0001 <0.0001 TLR2 10.39 11.38 10.11 11.24 10.58 10.96 0.09 0.07 0.3747 0.5420 TLR4 1.04c 1.49a 1.04c 1.22b 1.18 1.19 0.08 0.06 <0.0001 0.8645 TOLLIP 0.96b 0.96b 1.04a 0.95b 0.98 0.97 0.02 0.01 <0.0001 0.3915 a-c
Different letters represent significant differences between treatments (P < 0.05)
The letter a indicates higher transcript levels than b and c. The letter b indicates higher transcript levels than c
d
Treatments: Control = incubation without toxins; LPS = incubation with 1μg/mL lipopolysaccharide; LTA = incubation with 20 μg/mL lipoteichoic acid; L + L = incubation with the combination of both toxins
y-z
regardless of treatment, after 6 h the expression of CCL5 increased with LPS alone (P < 0.02) and in the controls (P < 0.0001).
After 3 and 6 h, treatments with LPS alone or in com-bination with LTA increased CXCL6 transcription (P < 0.0001) when compared to controls and LTA alone. At 3 h (P < 0.0001) and 6 h (P < 0.001) of incubation, LPS alone increased CXCL6 transcription compared to the incubation with both toxins. A time dependent effect
was detected only in samples incubated with LTA, with a decrease of expression in samples incubated for 6 vs. 3 h (P < 0.001). After 3 h, the CXCL8 transcription was higher in LPS samples vs. controls (P < 0.0001), LTA alone (P < 0.0001) and both toxins (P < 0.01). After 6 h, transcription was higher in con-trols vs. LTA alone (P < 0.01) but lower in concon-trols vs. LPS alone (P < 0.0001). Furthermore, after 6 h CXCL8 transcription was higher for LPS alone compared to LTA alone (P < 0.0001), both toxins vs. LTA alone (P < 0.0001), or LPS alone vs. both toxins (P < 0.002). Al-though no time effect was detected at 3 h for CXCL8 regardless of treatment, after 6 h, the expression of
CXCL8 decreased with LPS alone (P < 0.002), LTA
alone (P < 0.0001) and both toxins (P < 0.001).
Incubation for 3 h with both toxins increased IL6 transcription vs. controls (P < 0.005) and LTA alone (P < 0.02). After 3 h incubation, LPS alone increased
IL6 transcript levels compared to controls and LTA
alone (P < 0.001).
Other regulatory genes
A treatment effect (P < 0.0001) was detected for tran-scription of IFIT3, MYD88, NFKB1, PTGS2, TLR4 and
TOLLIP whereas incubation time affected IFIT3, IRF3,
MYD88, NFKB1 and PTGS2 transcription (P < 0.0001) (Table 2). Several significant differences (P < 0.05) oc-curred for the interactions between treatment and incu-bation time (Table 3). Details on these differences are illustrated below.
After 3 h, IFIT3 transcript levels were lower in con-trols vs. LPS (P < 0.04), LTA (P < 0.03) and both (P < 0.001). The same trend occurred after 6 h when IFIT3 transcription was lower in controls vs. LPS (P < 0.04), LTA (P < 0.001) and both (P < 0.001). Incubation (6 h vs. 3 h) always increased (P < 0.0001) IFIT3 transcript levels. We found higher IRF3 transcript levels in samples incu-bated with both toxins vs. controls (P < 0.01) after 3 h incubation. A time dependent increase occurred for LPS (P < 0.03), LTA (P < 0.001) and controls (P < 0.002).
After 3 h, MYD88 transcript levels were lower in con-trols than LPS (P < 0.001) or both toxins (P < 0.0001), whereas LTA generated lower transcript levels than LPS alone (P < 0.003) or in combination with LTA (P < 0.001). After 6 h, MYD88 transcript levels were lower in controls than LPS (P < 0.001) or both toxins (P < 0.001), whereas LTA generated lower MYD88 transcript levels than LPS alone (P < 0.05) or in combination with LTA (P < 0.02). Incubation increased MYD88 transcription in samples with LPS (P < 0.04), LTA (P < 0.003) and con-trols (P < 0.04).
Incubation increased NFKB1 transcription in all samples (P < 0.0001). After 3 h, NFKB1 transcript levels were lower in controls than LPS (P < 0.001), LTA (P <
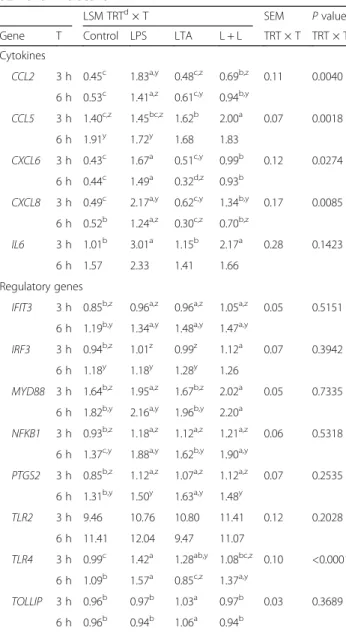
Table 3 Log2back-transformed LSM of interactions between
treatment (TRT) and incubation time (T) on gene transcription, SEM and P values for TRT × T
LSM TRTd× T SEM P value
Gene T Control LPS LTA L + L TRT × T TRT × T
Cytokines
CCL2 3 h 0.45c 1.83a,y 0.48c,z 0.69b,z 0.11 0.0040 6 h 0.53c 1.41a,z 0.61c,y 0.94b,y
CCL5 3 h 1.40c,z 1.45bc,z 1.62b 2.00a 0.07 0.0018
6 h 1.91y 1.72y 1.68 1.83
CXCL6 3 h 0.43c 1.67a 0.51c,y 0.99b 0.12 0.0274
6 h 0.44c 1.49a 0.32d,z 0.93b
CXCL8 3 h 0.49c 2.17a,y 0.62c,y 1.34b,y 0.17 0.0085 6 h 0.52b 1.24a,z 0.30c,z 0.70b,z
IL6 3 h 1.01b 3.01a 1.15b 2.17a 0.28 0.1423
6 h 1.57 2.33 1.41 1.66
Regulatory genes
IFIT3 3 h 0.85b,z 0.96a,z 0.96a,z 1.05a,z 0.05 0.5151 6 h 1.19b,y 1.34a,y 1.48a,y 1.47a,y
IRF3 3 h 0.94b,z 1.01z 0.99z 1.12a 0.07 0.3942
6 h 1.18y 1.18y 1.28y 1.26
MYD88 3 h 1.64b,z 1.95a,z 1.67b,z 2.02a 0.05 0.7335 6 h 1.82b,y 2.16a,y 1.96b,y 2.20a
NFKB1 3 h 0.93b,z 1.18a,z 1.12a,z 1.21a,z 0.06 0.5318 6 h 1.37c,y 1.88a,y 1.62b,y 1.90a,y
PTGS2 3 h 0.85b,z 1.12a,z 1.07a,z 1.12a,z 0.07 0.2535 6 h 1.31b,y 1.50y 1.63a,y 1.48y TLR2 3 h 9.46 10.76 10.80 11.41 0.12 0.2028 6 h 11.41 12.04 9.47 11.07 TLR4 3 h 0.99c 1.42a 1.28ab,y 1.08bc,z 0.10 <0.0001 6 h 1.09b 1.57a 0.85c,z 1.37a,y TOLLIP 3 h 0.96b 0.97b 1.03a 0.97b 0.03 0.3689 6 h 0.96b 0.94b 1.06a 0.94b a-c
Different letters represent significant differences between treatments within the same incubation time (P < 0.05). The letter a indicates higher transcript levels than b and c. The letter b indicates higher transcript levels than c
d
Treatments: LPS = incubation with 1μg/mL lipopolysaccharide; LTA = incubation with 20μg/mL lipoteichoic acid; L + L = incubation with the combination of both toxins; Control = incubation without toxins
y-z
Different letters represent significant differences between time points within the same treatment (P < 0.05). The letter y indicates higher transcript levels than z
0.002) and both (P < 0.0001). After 6 h, NFKB1 tran-scription was lower in controls than LPS (P < 0.0001), LTA (P < 0.01) and both (P < 0.0001). Furthermore, at 6 h incubation, transcription was lower in LTA vs. LPS (P < 0.01) and both toxins (P < 0.01).
After 3 h PTGS2 transcript levels were lower in con-trols vs. LPS (P < 0.001), LTA (P < 0.002) and both toxins (P < 0.001). After 6 h only LTA increased PTGS2 transcript levels vs. controls (P < 0.004). Incubation always increased PTGS2 transcription, i.e. LPS (P < 0.0001), LTA (P < 0.0001), both toxins (P < 0.001) and controls (P < 0.0001).
After 3 h, TLR4 transcript levels were lower in con-trols than in the presence of LTA (P < 0.01) and LPS (P < 0.001). Moreover, TLR4 transcription was higher in samples incubated with LPS vs. both toxins (P < 0.005). After 6 h, TLR4 transcript levels were lower in LTA samples vs. controls (P < 0.01), LPS (P < 0.0001) and both toxins (P < 0.0001), in controls vs. LPS (P < 0.001) and both toxins (P < 0.02). A time dependent increase was found in samples incubated with both toxins (P < 0.02) whereas a time dependent decrease occurred for LTA (P < 0.0001).
After 3 h, TOLLIP transcript levels were signifi-cantly higher in samples incubated with LTA vs. con-trols (P < 0.02), LPS (P < 0.03) and both toxins (P < 0.03). After 6 h TOLLIP transcription was also higher for LTA vs. controls (P < 0.001), LPS (P < 0.001) and both toxins (P < 0.0001). No significant difference was found among treatments and time points in TLR2 transcription levels.
Discussion
Chemokines and interleukins
Chemokines regulate migration and adhesion of infil-trating cells to an inflamed lesion [28], and inhibition of chemokine expression or secretion significantly re-duces cell infiltration [29]. Resident tissue cells such as mesangial cells and inflammatory cells such as monocytes/macrophages stimulate expression and se-cretion of chemokines [30]. The chemokines CCL2
and CCL5, which belong to the “type I IFN
chemo-kine signature”, attract mainly monocytes, natural killer cells and activated lymphocytes [31, 32]. Thus, interferon (IFN) signaling is considered a critical point for host resistance against different pathogens [33], although the end result may be beneficial or det-rimental to the host depending on the circumstances [34]. As reported previously in non-ruminants [35], the differential expression of these IFN-regulated che-mokines with LPS or LTA could indicate a stronger recruitment of monocytes and lymphocytes in the mammary tissue and milk.
The greater expression of CCL2 with LPS than LTA was consistent with data from a study with bovine pMEC incubated with LPS purified from E. coli strain O55:B5 [19, 20] or heat-inactivated E. coli [36], and the lack of effect of LTA isolated from Streptococcus
pyogenes [19], S. aureus [20] or heat-inactivated S.
aureus [36]. The down-regulation of CCL2 with L + L
than LPS might have been due to an interaction be-tween LPS and LTA. Recent work has led to the speculation that bifidobacteria could induce cross-tolerance in bovine intestinal epithelial cells through their interaction with TLR2 [37]. In addition, it has been speculated that pre-exposure to LTA and lipo-peptides which trigger TLR2-mediated signaling led to tolerance to LPS [38]. The lack of LPS effect on
CCL5 is in contradiction to a similar study with
bo-vine MEC using 20 μg/mL LPS from E. coli O55:B5
[20]. This discrepancy might be explained by the dif-ferent concentrations used in the studies.
The chemokines CCL2 and CXCL6 have strong chemo-attractant activities [39]. The up-regulation of
CXCL6 with LPS is similar to a previous study where
CCL2 and CXCL6 increased markedly upon LPS
chal-lenge of MEC [19]. Mastitis is strongly associated with increased somatic cell counts in milk, the major-ity of which is attributable to neutrophils and lym-phocytes [40]. Local production of pro-inflammatory cytokines in mammary tissue may have a strong influ-ence on the activation state of the infiltrating neutro-phils [41].
The temporal response in CXCL8 after 3 and 6 h in the presence of LPS is similar to results reported in a
previous study incubating bovine MEC with 50 μg/mL
LPS or 20 μg/mL LTA, where an initial increase of
CXCL8 transcript levels after 2 h was followed by a
de-crease after 4 h in the presence of LTA and LPS [19]. In addition, a similar trend has been detected in a study performed with endometrial epithelial cells incubated with LPS where CXCL8 levels were higher after 3 h incubation vs. 6 h [23].
The cytokine IL6 is a pleiotropic protein with a strong influence on inflammatory responses, and is a major effector of the acute-phase reaction [42]. Thus, the observation that LPS alone or in combination with LTA up-regulated IL6 only after 3 h could be explained by its quick mechanism of action, which was also reported previously in bovine MEC [20].
Other regulatory genes
The up-regulation of IFIT3 with LPS alone compared to controls at 3 and 6 h is consistent with a previous
study with bovine MEC using 20 μg/mL LPS from E.
coli O55:B5 [20]. Activation of TLR4 by LPS induces
internalization of the antigen-receptor LPS-TLR4 complex and activates interferon regulatory factor 3 (IRF3) [43]. The observed up-regulation of IFIT3 with LTA might have been due to the responsiveness of this gene to a large variety of exogenous molecules [44]. The induction of the interferon induced protein with tetratricopeptide repeats (IFIT gene family) by different stimuli is based on the activation of inter-feron regulatory factors, which recognize the IFN-stimulated response elements (ISRE) in the IFIT promoters and initiate transcription [45].
IRF3 is involved in the MyD88-independent signaling pathway activated by TLR4, which may explain the lack of effect detected in IRF3 between LTA alone and con-trols. However, the lack of an increase in IRF3 transcrip-tion with LPS alone was unexpected because IRF3 should be activated by TLR4 [43]. In a previous study with bovine mammary epithelial cells (MAC-T) [46], no significant IRF3 increase was detected until 6 h
incuba-tion with 1 μg/mL LPS from E. coli J5 Rc mutant. The
increase in IRF3 transcription at 3 h incubation with both toxins could be explained by an interaction effect between LPS and LTA on pgMEC.
The published data regarding MYD88 regulation in-duced by LPS or LTA are seemingly discordant. For example, a non-significant down-regulation of MYD88
has been observed after 24 h with 50 μg/mL LPS
treatment in immortalized bovine MEC, with no dif-ferences detected in primary bovine MEC [19]. In a study performed with immortalized bovine MEC [46], LPS induced the up-regulation of adaptor MYD88 transcript that increased gradually compared to un-treated cells and peaked significantly at 72 h after
in-duction. In endometrial epithelial cells, MYD88
expression peaks at 6 h after LPS-treatment [23]. Our data were more consistent with a study performed in endometrial stromal cells and whole endometrial cells incubated with LPS and LTA [47]. In that study, LPS stimulation up-regulated MYD88 expression after 8 h in both cell types, whereas LTA stimulation of whole
endometrial cells was associated with a
non-significant increase of MyD88. Thus, it appears that a positive feedback loop with TLR4-dependent
molecu-lar self-regulation of the downstream signaling
MyD88 [48] could partly explain our data.
The up-regulation of NFKB1 with all challenges was consistent with previous studies where bacterial infections up-regulated NFKB1 transcription in bo-vine mammary cells, confirming the ability of the mammary gland to mount a robust innate immune response [41, 46, 49]. Furthermore, our data agree with a previous study reporting up-regulation of
NFKB1 in bovine endometrial epithelial cells
chal-lenged with LPS [23].
Prostaglandins are one of several inflammatory media-tors in the bovine mammary gland with chemotactic ac-tivity [50], hence, explaining the up-regulation of PTGS2 with all challenges after 3 h. The PTGS2 protein is one of the enzymes involved in prostaglandin synthesis that is transiently up-regulated during inflammation [51].
PTGS2 expression is increased by LTA [52]. The
induc-tion of PTGS2 could have been associated with the
action of MyD88 and activation of NFκB as reported
previously [53].
The lack of effect on TLR2 expression in the present study is consistent with a previous study of
bovine MEC after 6 h incubation with
inactivated E. coli or after 30 h incubation with heat-inactivated S. aureus [36]. However, both datasets contrast the significant up-regulation of TLR2 induced by LPS or heat-killed E. coli treatment of bovine endometrial cells for 3 and 6 h [23]. It could be pos-sible that LTA inhibited TLR signaling as reported previously in human monocyte-like cells [54].
The greater TLR4 expression due to LPS when com-pared to controls is consistent with previous data from a study performed with bovine MEC where TLR4 was greater than controls in cells incubated for 6 h with
1 μg/mL LPS from E. coli [46]. Similar to the decrease
that we detected over time for TLR4 upon LTA chal-lenge, the expression of TLR4 had decreased in endo-metrial epithelial cells incubated for 3 and 6 h with
100 μg/mL LPS from E. coli after a significant increase
at 1 h incubation [23].
The lower CXCL6 and CXCL8 expression after 3 and 6 h incubation induced only by LTA coincided with the higher expression of TOLLIP (Table 3), which is consist-ent with its anti-inflammatory role [55–57]. A time-dependent increase in TOLLIP has been reported in
bovine MEC incubated with 1.0μg/mL LPS from E. coli
mutant J5 for 24 h; whereas a time-dependent decrease had occurred between 48 and 72 h of incubation [46]. These data indicate that an up-regulation of TOLLIP is necessary to counteract the harmful effects associated with over production of cytokines. In fact, using short hairpin RNA knockdown of TOLLIP in peripheral blood human monocytes, TOLLIP suppresses TNF and IL-6 production after stimulation with TLR2 and TLR4 ago-nists, and induces secretion of the anti-inflammatory cytokine IL-10 [58].
Conclusions
Consistent with numerous experiments in bovine mam-mary epithelial cells, our study confirms the capacity of LPS to stimulate inflammatory genes acting as TLR4 ago-nists in pgMEC. The differences in gene expression responses of goat mammary epithelial cells to LPS and LTA revealed different activation pathways for
these components of Gram-negative and Gram-positive bacterial cell walls. Further studies focused on protein ex-pression changes should be carried out to confirm gene transcription variation at the translation level. Further-more, genes and corresponding proteins involved in cellu-lar apoptosis should be studied in order to investigate potential mechanisms damaging goat mammary tissue in response to inflammatory stimuli. The challenge with LPS compared to LTA generated much stronger and sustained responses that seem to reflect an adaptation to the more acute nature of mastitis caused by coliform bacteria. The lack of response for some pro-inflammatory cytokines during incubation with LTA indicates some degree of tol-erance to this agent, consistent with chronic infections of the mammary tissue caused by Staphylococcal species.
Additional file
Additional file 1: Additional materials. RNA extraction, purification, and quality assessment; selection of genes, primer design, quantitative RT-PCR, Table S1. Genes analyzed by quantitative PCR, and Table S2. Oligonucleotide primer sequences. (DOCX 31 kb)
Abbreviations
ACTB:Actin beta; CCL2: C-C motif chemokine ligand 2; CCL5: C-C motif chemokine ligand 5; CXCL6: C-X-C motif chemokine ligand 6; CXCL8: Interleukin 8; GAPDH: Glyceraldehyde-3-phosphate dehydrogenase; IFIT: Interferon induced protein with tetratricopeptide repeats;
IFIT3: Interferon induced protein with tetratricopeptide repeats 3; IFN: Interferon; IL1B: Interleukin 1 beta; IL6: Interleukin 6; IRF3: Interferon regulatory factor 3; ISRE: IFN-stimulated response elements; LPS: Gram-negative lipopolysaccharide; LTA: Gram-positive lipoteichoic acid; LTF: Lactoferrin; MEC: Mammary epithelial cells; MYD88: Myeloid differentiation primary response 88; NFKB1: Nuclear factor of kappa light polypeptide gene enhancer in B-cells 1; pgMEC: Primary goat mammary epithelial cells; pMEC: Primary mammary epithelial cells; PTGS2: Prostaglandin-endoperoxide synthase 2; qPCR: Quantitative real-time PCR; T: Time; TLR: Toll-like receptors; TLR1-TLR10: Toll-like receptors 1–10; TLR2: Toll-like receptor 2; TLR4: Toll-like receptor 4; TNF: Tumor necrosis factor alpha; TOLLIP: Toll interacting protein; TRT: Treatment;
UXT: Ubiquitously expressed prefoldin like chaperone
Acknowledgments
We greatly appreciate the support of Prof. Peter Dovč, Department of Animal Science, University of Ljubljana, Slovenia, for providing access to the mammary epithelial cells.
Funding
Funding for this study was provided by the Future Interdisciplinary Research Explorations grant program of the Office of Research, College of ACES, University of Illinois at Urbana-Champaign, through the USDA National Institute of Food and Agriculture Hatch project ILLU-538-395 (Accession Number 0232734) and ILLU-538-914.
Availability of data and materials
The datasets during and/or analyzed during the current study available from the corresponding authors on reasonable request.
Authors’ contributions
OB and XD performed the experiments, performed analyses, and analyzed data. ALR, AMC and JJL drafted the manuscript. JJL conceived the experiment and proofread the manuscript. All authors participated in data interpretation. All authors approved the final version of the manuscript.
Authors’ information
O. Bulgari is PhD degree candidate at Department of Molecular and Translational Medicine, University of Brescia, Brescia 25123, Italy. X. Dong is PhD degree candidate at Institute of Animal Nutrition, Sichuan Agricultural University, Chengdu, 611130, China.
A. L. Roca is Associate Professor in the Department of Animal Sciences, University of Illinois at Urbana-Champaign, Urbana, IL, 61801, USA.A. M. Caroli is Professor at Department of Molecular and Translational Medicine, University of Brescia, Brescia 25123, Italy.
J. J. Loor is Associate Professor in the Department of Animal Sciences, University of Illinois at Urbana-Champaign, Urbana, IL, 61801, USA.
Competing interests
The authors declare that they have no competing interests.
Consent for publication Not applicable.
Ethics approval and consent to participate Not applicable.
Author details
1Department of Animal Sciences and Division of Nutritional Sciences, University of Illinois at Urbana-Champaign, Urbana, IL 61801, USA. 2Department of Molecular and Translational Medicine, University of Brescia, Brescia 25123, Italy.3Institute of Animal Nutrition, Sichuan Agricultural University, Chengdu 611130, China.4Division of Nutritional Sciences, University of Illinois at Urbana-Champaign, Urbana, IL 61801, USA.
Received: 6 September 2016 Accepted: 21 March 2017
References
1. Viguier C, Arora S, Gilmartin N, Welbeck K, O’Kennedy R. Mastitis detection: current trends and future perspectives. Trends Biotechnol. 2009;27:486–93. 2. Ribeiro MG, Lara GHB, Bicudo SD, Souza AVG, Salerno T, Siqueira AK, et al. An unusual gangrenous goat mastitis caused by Staphylococcus aureus, Clostridium perfringens and Escherichia coli co-infection. Arq Bras Med Vet Zootec. 2007;59:810–2.
3. Radostits OM, Gay C, Hinchcliff K, Constable P. Veterinary medicine - a textbook of the diseases of cattle, horses, sheep, pigs and goats. 10th ed. Edinburgh: Elsevier Saunders; 2007.
4. Moyes KM, Drackley JK, Salak-Johnson JL, Morin DE, Hope JC, Loor JJ. Dietary-induced negative energy balance has minimal effects on innate immunity during a Streptococcus uberis mastitis challenge in dairy cows during midlactation. J Dairy Sci. 2009;92:4301–16.
5. Moyes KM, Drackley JK, Morin DE, Loor JJ. Greater expression of TLR2, TLR4, and IL6 due to negative energy balance is associated with lower expression of HLA-DRA and HLA-A in bovine blood neutrophils after intramammary mastitis challenge with Streptococcus uberis. Funct Integr Genom. 2010;10: 53–61.
6. Loor JJ, Moyes KM, Bionaz M. Functional adaptations of the transcriptome to mastitis-causing pathogens: the mammary gland and beyond. J Mamm Gland Biol Neoplasia. 2011;16:305–22.
7. Huang J, Luo G, Zhang Z, Wang X, Ju Z, Qi C, et al. iTRAQ-proteomics and bioinformatics analyses of mammary tissue from cows with clinical mastitis due to natural infection with Staphylococci aureus. BMC Genomics. 2014;15:839. 8. Qian C, Cao X. Regulation of Toll-like receptor signaling pathways in innate
immune responses. Ann N Y Acad Sci. 2013;1283:67–74.
9. Tirumurugaan KG, Dhanasekaran S, Dhinakar Raj G, Raja A, Kumanan K, Ramaswamy V. Differential expression of toll-like receptor mRNA in selected tissues of goat (Capra hircus). Vet Immunol Immunopathol. 2010;133:296–301.
10. Ma JL, Zhu YH, Zhang L, Zhuge ZY, Liu PQ, Yan XD, et al. Serum concentration and mRNA expression in milk somatic cells of toll-like receptor 2, toll-like receptor 4, and cytokines in dairy cows following intramammary inoculation with Escherichia coli. J Dairy Sci. 2011;94:5903–12. 11. Carvajal AM, Huircan P, Lepori A. Single nucleotide polymorphisms in
immunity-related genes and their association with mastitis in Chilean dairy cattle. Genet Mol Res. 2013;12:2702–11.
12. Beecher C, Daly M, Ross RP, Flynn J, McCarthy TV, Giblin L. Characterization of the bovine innate immune response in milk somatic cells following intramammary infection with Streptococcus dysgalactiae subspecies dysgalactiae. J Dairy Sci. 2012;95:5720–9.
13. Poltorak A, He X, Smirnova I, Liu MY, Van Huffel C, Du X, et al. Defective LPS signaling in C3H/HeJ and C57BL/10ScCr mice: mutations in TLR4 gene. Science. 1998;282:2085–8.
14. Schwandner R, Dziarski R, Wesche H, Rothe M, Kirschning CJ. Peptidoglycan and lipoteichoic acid-induced cell activation is mediated by toll-like receptor 2. J Biol Chem. 1999;274:17406–9.
15. Takeda K, Akira S. Toll-like receptors in innate immunity. Int Immunol. 2005; 17:1–14.
16. Akira S. Pathogen recognition by innate immunity and its signaling. Proc Jpn Acad Ser B Phys Biol Sci. 2009;85:143–56.
17. Ogorevc J, Dovč P. Relative quantification of beta-casein expression in primary goat mammary epithelial cell lines. Genet Mol Res. 2015;14:3481–90. 18. Kadegowda AKG, Bionaz B, Piperova LS, Erdman RA, Loor JJ. Peroxisome
proliferator-activated receptor-γ activation and long chain fatty acids alter lipogenic gene networks in bovine mammary epithelial cells to various extents. J Dairy Sci. 2009;92:4276–89.
19. Strandberg Y, Gray C, Vuocolo T, Donaldson L, Broadway M, Tellam R. Lipopolysaccharide and lipoteichoic acid induce different innate immune responses in bovine mammary epithelial cells. Cytokine. 2005; 31:72–86.
20. Gilbert FB, Cunha P, Jensen K, Glass EJ, Foucras G, Robert-Granie C, et al. Differential response of bovine mammary epithelial cells to Staphylococcus aureus or Escherichia coli agonists of the innate immune system. Vet Res. 2013;44:40.
21. Schröder NW, Morath S, Alexander C, Hamann L, Hartung T, Zahringer V, et al. Lipoteichoic acid (LTA) of Streptococcus pneumoniae and Staphylococcus aureus activates immune cells via toll-like receptor (TLR)-2,
lipopolysaccharide-binding protein (LBP), and CD14, whereas TLR-4 and MD-2 are not involved. J Biol Chem. 2003;278:15587–94.
22. Bougarn S, Cunha P, Harmache A, Fromageau A, Gilbert FB, Rainard P. Muramyl dipeptide synergizes with Staphylococcus aureus lipoteichoic acid to recruit neutrophils in the mammary gland and to stimulate mammary epithelial cells. Clin Vaccine Immunol. 2010;17:1797–809.
23. Fu Y, Liu B, Feng X, Liu Z, Liang D, Li F, et al. Lipopolysaccharide increases toll-like receptor 4 and downstream toll-like receptor signaling molecules expression in bovine endometrial epithelial cells. Vet Immunol Immunopathol. 2013;151:20–7.
24. Mancek-Keber M, Jerala R. Postulates for validating TLR4 agonists. Eur J Immunol. 2015;45:356–70.
25. Morath S, Geyer A, Hartung T. Structure-function relationship of cytokine induction by lipoteichoic acid from Staphylococcus aureus. J Exp Med. 2001; 193:393–7.
26. Hu H, Wang JQ, Bu DP, Wei HY, Zhou LY, Li F, et al. In vitro culture and characterization of a mammary epithelial cell line from Chinese Holstein dairy cow. PLoS ONE. 2009;4:e7636.
27. Prpar Mihevc S, Ogorevc J, Dovc P. Lineage-specific markers of goat mammary cells in primary culture. In Vitro Cell Dev Biol Anim. 2014;50: 926–36.
28. Nedoszytko B, Sokołowska-Wojdyło M, Ruckemann-Dziurdzińska K, Roszkiewicz J, Nowickiù RJ. Chemokines and cytokines network in the pathogenesis of the inflammatory skin diseases: atopic dermatitis, psoriasis and skin mastocytosis. Postepy Dermatol Alergol. 2014;31:84–91. 29. Haberstroh U, Pocock J, Gómez-Guerrero C, Helmchen U, Hamann A,
Gutierrez-Ramos JC, et al. Expression of the chemokines MCP-1/CCL2 and RANTES/CCL5 is differentially regulated by infiltrating inflammatory cells. Kidney Int. 2002;62:1264–76.
30. Rossi D, Zlotnik A. The biology of chemokines and their receptors. Annu Rev Immunol. 2000;18:217–42.
31. Jia T, Leiner I, Dorothee G, Brandl K, Pamer EG. MyD88 and type I interferon receptor-mediated chemokine induction and monocyte recruitment during Listeria monocytogenes infection. J Immunol. 2009;183:1271–8.
32. Lee PY, Li Y, Kumagai Y, Xu Y, Weinstein JS, Kellner ES, et al. Type I interferon modulates monocyte recruitment and maturation in chronic inflammation. Am J Pathol. 2009;175:2023–33.
33. Mancuso G, Midiri A, Biondo C, Beninati C, Zummo S, Galbo R, et al. Type I IFN signaling is crucial for host resistance against different species of pathogenic bacteria. J Immunol. 2007;178:3126–33.
34. Decker T, Muller M, Stockinger S. The yin and yang of type I interferon activity in bacterial infection. Nat Rev Immunol. 2005;5:675–87. 35. Weyrich AS, McIntyre TM, McEver RP, Prescott SM, Zimmerman GA.
Monocyte tethering by P-selectin regulates monocyte chemotactic protein-1 and tumor necrosis factor-alpha secretion. Signal integration and NF-kappa B translocation. J Clin Invest. 1995;95:2297–303. 36. Sorg D, Danowski K, Korenkova V, Rusnakova V, Küffner R, Zimmer R, et al.
Microfluidic high-throughput RT-qPCR measurements of the immune response of primary bovine mammary epithelial cells cultured from milk to mastitis pathogens. Animal. 2013;7:799–805.
37. Villena J, Aso H, Kitazawa H. Regulation of toll-like receptors-mediated inflammation by immunobiotics in bovine intestinal epitheliocytes: role of signaling pathways and negative regulators. Front Immunol. 2014;5:421. 38. Sato S, Takeuchi O, Fujita T, Tomizawa H, Takeda K, Akira S. A variety of
microbial components induce tolerance to lipopolysaccharide by differentially affecting MyD88-dependent and independent pathways. Int Immunol. 2002;14:783–91.
39. Moser B, Wolf M, Walz A, Loetscher P. Chemokines: multiple levels of leukocyte migration control. Trends Immunol. 2004;25:75e84. 40. Schukken YH, Wilson DJ, Welcome F, Garrison-Tikofsky L, Gonzalez RN.
Monitoring udder health and milk quality using somatic cell counts. Vet Res. 2003;34:579e96.
41. Bannerman DD, Chockalingam A, Paape MJ, Hope JC. The bovine innate immune response during experimentally-induced Pseudomonas aeruginosa mastitis. Vet Immunol Immunop. 2005;107:201–5.
42. Le JM, Vilcek J. Interleukin 6: a multifunctional cytokine regulating immune reactions and the acute phase protein response. Lab Invest. 1989;61: 588e602.
43. Cao D, Luo J, Chen D, Xu H, Shi H, Jing X, et al. CD36 regulates lipopolysaccharide-induced signaling pathways and mediates the internalization of Escherichia coli in cooperation with TLR4 in goat mammary gland epithelial cells. Sci Rep. 2016;6:23132.
44. Fensterl V, Sen GC. The ISG56/IFIT1 gene family. J Interf Cytok Res. 2011;31: 71–7.
45. Ogawa S, Lozach J, Benner C, Pascual G, Tangirala RK, Westin S, et al. Molecular determinants of crosstalk between nuclear receptors and toll-like receptors. Cell. 2005;122:707–21.
46. Ibeagha-Awemu EM, Lee JW, Ibeagha AE, Bannerman DD, Paape MJ, Zhao X. Bacterial lipopolysaccharide induces increased expression of toll-like receptor (TLR) 4 and downstream TLR signaling molecules in bovine mammary epithelial cells. Vet Res. 2008;39:11.
47. Rashidi N, Mirahmadian M, Jeddi-Tehrani M, Rezania S, Ghasemi J, Kazemnejad S, et al. Lipopolysaccharide and lipoteichoic acid-mediated pro-inflammatory cytokine production and modulation of TLR2, TLR4 and MyD88 expression in human endometrial cells. J Reprod Infertil. 2015;16:72–81.
48. Buchholz BM, Billiar TR, Bauer AJ. Dominant role of the MyD88-dependent signaling pathway in mediating early endotoxin-induced murine ileus. Am J Physiol Gastrointest Liver Physiol. 2010;299:G531–8.
49. Lee JW, Bannerman DD, Paape MJ, Huang MK, Zhao X. Characterization of cytokine expression in milk somatic cells during intramammary infections with Eschericha coli or Staphylococcus aureus by real-time PCR. Vet Res. 2006;37:219–29.
50. Craven N. Chemotactic factors for bovine neutrophils in relation to mastitis. Comp Immunol Microbiol Infect Dis. 1986;9:29–36.
51. Zbinden C, Stephan R, Johler S, Borel N, Bunter J, Bruckmaier RM, et al. The inflammatory response of primary bovine mammary epithelial cells to Staphylococcus aureus strains is linked to the bacterial phenotype. PLoS One. 2014;9:e87374.
52. Lin CH, Kuan IH, Lee HM, Lee WS, Sheu JR, Ho YS, et al. Induction of cyclooxygenase-2 protein by lipoteichoic acid from Staphylococcus aureus in human pulmonary epithelial cells: involvement of a nuclear factor-kB-dependent pathway. Br J Pharmacol. 2001;134:543–52.
53. Carpenter S, Atianand M, Aiello D, Ricci EP, Gandhi P, Hall LL, et al. A long noncoding RNA induced by TLRs mediates both activation and repression of immune response genes. Science. 2013;341:789–92.
54. Kim H, Jung BJ, Jeong J, Chun H, Chung DK. Lipoteichoic acid from Lactobacillus plantarum inhibits the expression of platelet-activating factor receptor induced by Staphylococcus aureus lipoteichoic acid or Escherichia coli lipopolysaccharide in human monocyte-like cells. J Microbiol Biotechnol. 2014;24:1051–8.
55. Zhang G, Ghosh S. Negative regulation of toll-like receptor-mediated signaling by Tollip. J Biol Chem. 2002;277:7059–65.
56. Capelluto DGS. Tollip: a multitasking protein in innate immunity and protein trafficking. Microbes Infect. 2012;14:140–7.
57. Moncayo-Nieto OL, Wilkinson TS, Brittan M, McHugh BJ, Jones RO, Morris AC, et al. Differential response to bacteria, and TOLLIP expression, in the human respiratory tract. BMJ Open Respir Res. 2014;1:e000046.
58. Shah JA, Vary JC, Chau TT, Bang ND, Yen NT, Farrar JJ, et al. Human TOLLIP regulates TLR2 and TLR4 signaling and its polymorphisms are associated with susceptibility to tuberculosis. J Immunol. 2012;189: 1737–46.
• We accept pre-submission inquiries
• Our selector tool helps you to find the most relevant journal • We provide round the clock customer support
• Convenient online submission • Thorough peer review
• Inclusion in PubMed and all major indexing services • Maximum visibility for your research
Submit your manuscript at www.biomedcentral.com/submit