UNIVERSITY
OF TRENTO
DIPARTIMENTO DI INGEGNERIA E SCIENZA DELL’INFORMAZIONE
38123 Povo – Trento (Italy), Via Sommarive 14
http://www.disi.unitn.it
A NUMERICAL ASSESSMENT OF THE RECONSTRUCTION
EFFECTIVENESS OF THE INTEGRATED GA-BASED
MULTICRACK STRATEGY
M. Benedetti, G. Franceschini, R. Azaro, and A. Massa
January 2011
1
A Numerical Assessment of the Reconstruction
Effectiveness of the Integrated GA-Based
Multicrack Strategy
Manuel Benedetti, Gabriele Franceschini, Renzo Azaro, and Andrea Massa1
Abstract—This paper is aimed at presenting a numerical study on the reconstruction accuracy (quantitative imaging) of the integrated genetic algorithm (GA)-based multicrack strategy, thus completing the assessment previously carried out and limited to verify the accuracy of the qualitative imaging (i.e., crack detection, location, and size estimation). The obtained results prove an acceptable reliability and accuracy of the GA-based integrated strategy also in reconstructing multiple defective regions even though the resulting performances degrade in comparison with those achieved by the same approach when used for qualitative imaging purposes.
Index Terms—Non-destructive Testing and Evaluation, Microwave Imaging, Multicrack Detection.
I. INTRODUCTION
ANY industrial processes require the non-invasive inspection of manufactured articles to assess their quality. For such a reason, the development of effective non-destructive evaluation and testing (NDE/NDT) techniques is currently of great interest. Therefore, different approaches have been proposed mainly based on the use of interrogating microwaves [1], primarily because of the material properties (i.e., their sensitivity) at those frequencies and of the advantages offered in terms of costs with respect to other probing sources (i.e., X-rays).
M
In particular, let us consider the area of near field active microwave imaging [2][3]. In such a framework, suitable inverse scattering approaches [4][5] have been developed in order to reconstruct a complete image of the region under test. Unfortunately, the underlying mathematical model is characterized by ill-posedness and non-linearity, that up-till now have limited the diffusion of these methodologies on a large scale.
In order to address more effectively the problem at hand, recent advances have proposed the introduction into the mathematical description as well as a more effective exploitation of the a-priori information in order to reduce the number of problem unknowns and consequently of typical inverse problems drawbacks [6][7]. According to these guidelines, two GA-based optimization techniques able to deal with multiple defects in dielectric host media have been proposed in [8]. The first technique, characterized by parallel optimization sub-processes, is called Hierarchical Strategy (HS). The other, called Integrated Strategy (IS), consists of a single GA-based optimization process. Both techniques have been evaluated in facing with quantitative imaging problems [8], but not when the reconstruction of the defects is needed, as well.
This paper completes the assessment since it is aimed at pointing out potentialities and limitations of the IS when the dielectric parameters of the defects are unknown, as well.
II. MATHEMATICAL FORMULATION
Let us consider the cross section Ω of a host object located in a background with permittivity and conductivity of the free space (ε0,σ0). The region Ω is described by an object function
0 2 ) , ( 1 ) , ( ) , ( ε σπε τ f y x j y x y x = − − Ω Ω
Ω , εΩ and σΩ being the relative
permittivity and conductivity, respectively. A set of C defects Di,
(
i=1,K,C)
characterized by unknown geometric andelectromagnetic properties belongs to Ω. Such a scenario is illuminated by V electromagnetic TM-polarized plane waves
( )
x y E( )
x yzE v
inc v
inc , = , ˆ and the resulting electromagnetic field distribution is mathematically described by the following relationship
( )
x,y E( )
x,y(
x',y')
E ()(
x',y') (
G0 x',y'/x,y)
dx'dy' E v c tot v inc v tot = +∫∫
Ωτ (1)where G0 is the free-space Green’s function and f is the working frequency. By considering that each region Di can be modeled
in terms of a differential equivalent current density that radiates in an inhomogeneous medium [8] [9], Equation (1) can be
The authors are with the Department of Information and Communication Technology, University of Trento, Via Sommarive 14, 38050 Trento, ITALY (phone: +39 0461 882057; fax: +39 0461 882093; e-mail: [email protected], {manuel.benedetti, renzo.azaro, gabriele.franceschini}@dit.unitn.it; web-site: http://www.eledia.ing.unitn.it)
rewritten as follows ( ) ( ) ( ) ( ) ( )
∑∫∫
= + + = C i D v i c tot D v cf inc v tot i i dy dx y x y x G y x E y x y x E y x E 1 1 ), ( ) ( ' ' , / ' , ' ' , ' ' , ' , , τ (2)where Eincv(cf)
(
x,y)
is the electric field in the unperturbed scenario, G1 is the inhomogeneous Green’s function, and( ) ( )
x y x y( )
x yi
D , =τ , −τΩ ,
τ ,
( )
x,y ∈Di is the ith (i=1,…,C) differential object function.In order to allow a more effective representation of the defects thus reducing the arising number of unknowns, a suitable set of geometric features is defined: the center of each defective shape
(
~x ~i,yi)
, its length L~i, side W~i, and orientation θ~i, and finally the corresponding dielectric parameters(
ε~i,σ~i)
. Accordingly, the i-th differential object function can be expressed as follows:( )
[
]
[ ][
]
[
]
= ⎪⎩ ⎪ ⎨ ⎧ − − ∈− ∈− = Ω Ω− otherwise Y and X if j y x i i i i i i W W L L f i D 0 , , ~ , 2 ~ 2 ~ 2 ~ 2 ~ 2 ~ 0 ε πσ σ ε ε τ (3) where(
)
(
)
(
i)
i(
i)
i i i i i y y x x Y y y x x X θ θ θ θ ~ cos ~ ~ sin ~ ~ sin ~ ~ cos ~ − + − = − + − = (4)Consequently, the problem unknowns reduce to the descriptive parameters of each defect and to the electric field distribution inside the C defective regions, coded in the following array χ:
[
]
{
C;Ψi,i=1,K,C;Etotv(c),i,i=1,K,C}
=
χ (5)
where
• C represent the number of cracks in the trial solution χ;
• i
[
(
xi yi)
(
Li Wi θi)
;(
ε~i,σ~i)
]
~ ; ~ ; ~are the set of parameters describing the i-th
(
i=1,K,C defective shape;)
~ ~, ; = Ψ •
[
v]
i c totE (), is the array containing the values of the estimated total field related to the i-th
(
i=1,K,C)
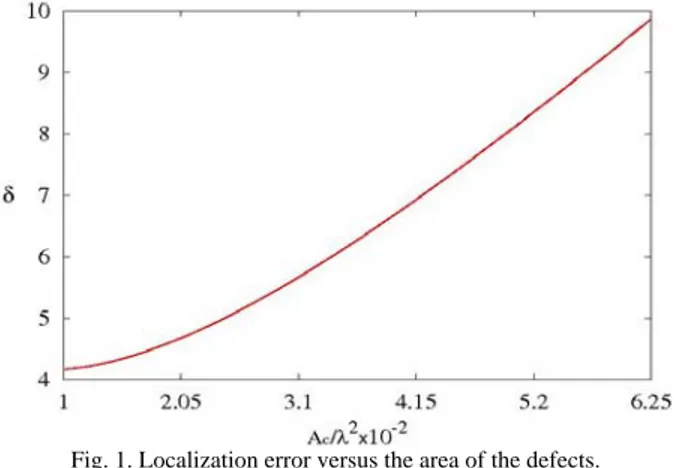
defective shape.Fig. 1. Localization error versus the area of the defects.
In order to determine the “unknown” array by solving the scattering equation (2), a numerical solution is needed. Therefore, the region Ω is partitioned into N sub-domains and the discretized forms of the Green’s operators G0 and G1 is obtained through
the numerical procedure detailed in [7][9]. Then, starting from the field samples collected at M locations of the observation domain O [i.e., v
(
m m and , m=1,…,M] and at N positions inside the investigation domain Ω [i.e.,tot x y E ,
)
v(
m m)
cf tot x y E ( ) ,(
n n)
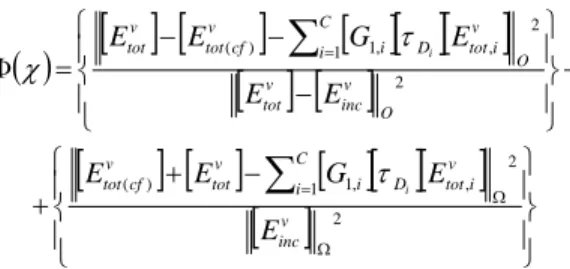
v inc x yE , , n=1,…,N], the optimal solution χopt of the problem is determined by minimizing the following cost function
3
( )
[ ] [
[ ] [ ]
]
[ ]
[ ][ ]
[
] [ ]
[ ]
[ ][ ]
[ ]
⎪⎭ ⎪ ⎬ ⎫ ⎪ ⎩ ⎪ ⎨ ⎧ + − + + ⎪ ⎭ ⎪ ⎬ ⎫ ⎪ ⎩ ⎪ ⎨ ⎧ − − − = Φ Ω Ω = =∑
∑
2 2 , 1 1, ) ( 2 2 , 1 1, ) ( v inc v i tot D C i i v tot v cf tot O v inc v tot O v i tot D C i i v cf tot v tot E E G E E E E E G E E i i τ τ χ (6)which is the sum of two normalized least-square terms providing a measure of the matching with the scattering data in the observation domain [i.e., first term of (6)] and in the investigation domain [i.e., second term of (6)] according to the inhomogeneous space formulation [9].
1.0 εr 2.0
(a)
1.0 εr 2.0
(b)
Fig. 2. Representative samples of the results obtained for different sizes of the defects. (a) Ac/λ2=1×10−2 and (b) Ac/λ2=6.25×10−2.
As far as the minimization technique is concerned, the Integrated Strategy (IS) proposed in [8] has been considered. Such a GA-based approach is characterized by a population
χ
of Q trial solutions coding a different number of defects, from 1 up to Cmax{
}
[
]
(
)
[
]
{
q q max}
v i c tot i q q C C C i E j i C Q q , , 1 ; , , 1 , ; , , 1 , ; , , 1 ; ), ( K K K K ∈ = = Ψ = = = = χ χ (7)At the first iteration (k=0, k being the iteration index) a random initialization generates the starting set of trial solutions, χ . 0
Then, the following operations are iteratively carried out until a stopping criterion holds true (k<Kmax or Φ
( )
χopt <Φth,( )
[
]
{
}
{
k}
q q k opt χχ =argmin min Φ ):
• the iteration index is updated (k=k+1); • a set of Q/2 individuals, k
b
χ , coding the same number k−1 opt C of defects of k−1 opt χ is randomly generated; • a Q/2-sized population ( k o
χ ) partitioned into Cmax-1 equally-sized subsets whose individuals code the same number of cracks
Cl (Cl=1,…,Cmax, Cl ≠Coptk−1), is computed from χoptk−1 by applying random operators [7] [8];
• standard selection, mutation, and elitism are applied to the set of trial solutions
{
k}
o kb χ
χ ∪ in order to get χ , thus defining k the best solution obtained so far
{
( )
k}
q Q q
k χ
χmin =argmin =1,K, Φ .
III. NUMERICAL ANALYSIS
This section is aimed at presenting the results of the numerical assessment of the IS when used for reconstruction purposes under the condition that the dielectric characteristics of the crack are unknown, as well.
The first test case deals with a square non-dissipative (σΩ =0) host medium of size LΩ =0.8λ characterized by a dielectric
permittivity εΩ =2.0 where C = 3 void defects are located at (x1/λ=0.2;y1/λ=0.16), (x2/λ=−0.2;y2/λ=0.16),
(x3/λ=0;y3/λ=−0.16). Such a scenario has been illuminated by V=4 different directions and the scattered field samples have
experiment the area of the defects has been varied in the range AC/λ2∈
[
0.01;0.0625]
by looking for an unknown array lying inthe solution space defined by the following constraints: σi=0, ε~ ∈i [1.0;2.0], and Cmax = 3.
Fig. 3. Localization error in correspondence with multiple-defects configurations.
As far as the GA-based optimization is concerned, the following set-up has been used: Kmax =600 and .
5
10− = Ωth
Figure 1 shows the behaviour of the localization error δ [8] versus the sizes of the defects. Such a result comes from the average on 10 independent simulations and by considering a random Gaussian noise (SNR=20 dB) blurring the scattered data.
As it can be noticed, when the size of the defect increases, the location of the crack is determined with a lower precision, since the value of δ increases. In particular, it turns out that δ>5% for , while δ<10% in correspondence with
. As a proof on the accuracy of the quantitative imaging, representative samples of the reconstructions are shown in Fig. 2. The result reported in Fig. 2(a) (Ac/λ2=0.01) is characterized by an error δ=3%, while the area error Δ [8] is lower than
50%. Concerning the value of the permittivity, it has been overestimated since the retrieved values ranges from 1.46 up to 1.57. On the other hand, in correspondence with Ac/λ2=0.0625 [Fig. 2(b)], the localization error turns out to be δ=5% and the
permittivity of the cracks has been faithfully estimated even though all the cracks are rotated of 45° degrees with respect to the actual orientation and the area error Δ is equal to 43%. Concerning the dimensioning of the defects, Δ is always lower than 50% whatever the value of Ac and it decreases as the size of the defects increases.
024 . 0 /λ2> C A 0625 . 0 /λ2= C A
The second experiment is devoted at evaluating the dependence of the performance of the IS on the number of defects. In such a case, C equally-sized defects (Ac/λ2=0.01) have been located at the following positions in Ω
( )
[
]
( )
[
]
i C i y i x r C i r C i ,..., 1 1 sin 1 cos = ⎩ ⎨ ⎧ + − = + − = γ ρ γ ρ π π (8)where ρ=0.25λ and γr is a random number uniformly distributed in [0;π/C].
Concerning the reconstruction process, the search space has been constrained by setting Cmax=5.
Figure 3 gives the values assumed by the localization error versus C. As expected, the method get worse as the number of defects increases. More in detail, δ is lower than 6% when C<4 and it is equal to 7.8% for C=5. Furthermore, the area error is on average equal to 46%, with a minimum equal to 43% when C=5 and a maximum equal to 50% when C=2.
For completeness, two samples of reconstruction are also reported. The one of Fig. 4(a) shows the dielectric distribution
1.0 εr 2.0
(a)
1.0 εr 2.0
(b) Fig. 4. Representative samples of the reconstructions when (a) C=3 and (b) C=4.
5
retrieved when C=3, pointing out that the defects are carefully localized and sizes with a satisfactory degree of accuracy. However, the permittivity values are generally overestimated and the homogeneity of the defect on the bottom is lost. Such a behaviour does not occur in the second example [Fig. 4(b)], where the defects are located with an error equal to 3%. Furthermore, the dielectric parameters are quite faithfully estimated (1.11<εˆi <1.34).
IV. CONCLUSIONS
In this letter, the reliability and accuracy of the IS is assessed dealing with defects unknown both in location and size as well as in the dielectric parameters. A set of representative test cases have been analyzed in order to evaluate the dependence of the IS performance on the descriptive parameters of the defects. The obtained results point out both potentialities and limitations of the GA-based technique by confirming the positive features of the approach especially in terms of the localization of defective regions approximable with rectangular shapes within dielectric host mediums. On the other hand, some deficiencies in retrieving the homogeneities of the defects under test suggest future improvements as the use of a suitable filtering or context-based operators and aggregation rules.
REFERENCES
[1] R. Zoughi, Microwave Nondestructive Testing and Evaluation, Kluwer Academic Publishers, The Netherlands, 2000. [2] S. J. Lockwood and H. Lee, “Pulse-echo microwave imaging for NDE of civil structures: Image reconstruction,
enhancement, and object recognition,” Int. J. Imaging System Technol., vol. 8, pp. 407-412, 1997.
[3] J. C. Bolomey, “Recent European developments in active microwave imaging for industrial, scientific and medical applications,” IEEE Trans. Microwave Theory Tech., vol. 37, pp. 2109–2117, June 1989.
[4] W. C. Chew and Y. M. Wang, “Reconstruction of two-dimensional permittivity distribution using the distorted Born iterative method,” IEEE Trans. Medical Imaging, vol. 9, pp. 218-225, 1990.
[5] C. C. Chiu and P. T. Liu, “Image reconstruction of perfectly conducting cylinder by the genetic algorithm,” IEE Proc. Microw. Antennas Propag., vol. 3, p. 143, 1996.
[6] S. Caorsi, A. Massa, and M. Pastorino, “A crack identification microwave procedure based on a genetic algorithm for nondestructive testing,” IEEE Trans. Antennas Propagat., vol. 49, pp. 1812-1820, 2001.
[7] S. Caorsi, A. Massa, M. Pastorino, and M. Donelli, “Improved microwave imaging procedure for nondestructive evaluations of two-dimensional structures,” IEEE Trans. Antennas Propagat., vol. 52, pp. 1386-1397, 2004.
[8] M. Benedetti, M. Donelli, and A. Massa, “Multicrack detection in two-dimensional structures by means of GA-based strategies”, IEEE Trans. Antennas Propagat., vol. 55, pp. 205-215, 2007.
[9] S. Caorsi, G. L. Gragnani, M. Pastorino, and M. Rebagliati, “A model-driven approach to microwave diagnostics in biomedical applications,” IEEE Trans. Microwave Theory Tech., vol. 44, pp. 1910-1920, 1996.
![Figure 1 shows the behaviour of the localization error δ [8] versus the sizes of the defects](https://thumb-eu.123doks.com/thumbv2/123dokorg/2944786.22631/6.918.171.753.876.1091/figure-shows-behaviour-localization-error-versus-sizes-defects.webp)
