! " ! # $ ! % & ' ( ) * & + " ,- #( . " /01
From Planning to Mature: on the Determinants of Open
Source Take Off
Stefano Comino
∗Fabio M. Manenti
†Maria Laura Parisi
‡September 2005
Abstract
Thanks to a recent and vast empirical literature, we know in details how the most popular open source projects are organized and why they succeed. Open source is not only Linux: in this paper we use a large data-set obtained from SourceForge.net to esti-mate the main determinants of the progress in the development of a stable and mature code of an open source software. We show that projects geared towards sophisticated users (i.e. system administrators) or projects aimed at developing tools for the Inter-net, multimedia and software have greater chances to reach an advanced development stage. On the contrary, projects devoted to the production of applications for games and telecommunication as well as projects distributed under highly restrictive licens-ing terms (GPL) have a significantly smaller probability to advance. Interestlicens-ingly, we find that the size of the “community of developers” increases the chances of progress but this effect decreases as the community gets larger, a signal of possible coordina-tion problems. Finally, we show that the determinants of projects’ development stage change with the age of the project in many dimensions thus supporting the common perception of open source as an extremely dynamic phenomenon.
Keywords: software market, open source software, development status,
intended audience, license
JEL classification: O38, L51, L63.
∗Dipartimento di Scienze Economiche, Universit`a di Trento, Via Inama 5, 38100 TRENTO (Italy), Tel.
(39) 0461 882221, email: [email protected]
†Corresponding author: Dipartimento di Scienze Economiche “M. Fanno”, Universit`a di Padova,
Via del Santo 33, 35123 PADOVA (Italy), Tel. (39) 049 8274238, Fax. (39) 049 8274211, email: [email protected]
‡Dipartimento di Scienze Economiche, Universit`a di Brescia, Via San Faustino 74/b, 25122 BRESCIA
1
Introduction
Open Source Software (OSS) represents one of the most interesting and debated phenomena in the software industry. Several aspects have been scrutinized in the most recent literature on OSS both from a theoretical and empirical perspective; various authors have tried to explain how a community of developers works and coordinates, to identify the motivations for unpaid programmers to contribute to an OSS project or, more recently, to explain why and how an even larger number of for-profit firms are deciding to embrace OSS strategies. In a nutshell, the large set of issues raised by the existence and the functioning of open source can be reassumed with only one basic and simple question: what determines the existence and the success of an open source project?
According to Crowston et al. (2003), there are three main interrelated proxies that can be used to measure the extent to which an open source software succeeds: i) software creation, ii) software quality, and iii) software use. The first category includes several indicators of software success: from the size and level of activity of the members of a community of an OSS project, to the ability of the community to develop a stable and mature software. According to the second category, a software is successful when its source code is of high quality, e.g. it is highly modular, correct and maintainable. Finally, the supporters of the third category consider a software as successful when it has been widely adopted by final users.1
Recently, various “case studies” contributed to a better understanding of the OSS phe-nomenon. Hertel et al. (2003) have tried to identify what determines the level of engagement of 141 developers into the large Linux project. Krogh et al. (2003) analyzed the strategic process by which new individuals join the community of developers of FreeNet, a peer-to-peer network of information distribution. In Lakhani and von Hippel (2003) the focus has been put on the nature and the functioning of the community of developers of the well known OSS Apache.
These studies shed new light on how large communities of developers arise, work and coordinate to obtain a successful software; the main limitation is that they focus on large and popular projects. While a closer look on such projects is crucial to understand better how communities work effectively, it may not be enough to explain the very basic nature of open source: large projects are only the “top of the iceberg” of the OSS world which
1It is often difficult to measure OSS adoption; Krishnamurthy (2002) proxies it with total number of
is made of thousands of small, often individually run projects, which are almost unknown outside the small circle of purist OSS developers. In this paper we look at the part of the OSS iceberg that is below the water line. We use data from SourceForge.net, the largest open source projects repository, to estimate the main determinants of the progress in the development of a stable and mature code of a software. As discussed in Crowston et al. (2003), the development stage of a project can be considered as a possible representation of the level of success of a software.
This measure of project’s success moves our paper apart from the most recent literature: Fershtman and Gandal (2004) consider an alternative definition of software success, based on output per contributor; they examine how the type of license, the programming language, the audience to which the software is intended to and other factors affect the number of source code lines written on average by each contributor of an OSS project. The empirical analysis is based on 71 projects observed during a period of eighteen months; their main result is that output per contributor of open source programs is significantly much higher when the scope of the license of the software is narrower, that is, when the terms for using, modifying and re-distributing the software are less restrictive.
The complex set of motivations that drives the choice of OSS license is at the center of Lerner and Tirole (2005); these authors point out that when choosing the terms under which her/his software is licensed, a project administrator has to balance opposing effects. On the one hand, by choosing a restrictive license that poses severe limitation to the possibilities of use and modification of the software the project administrator reduces the opportunity of commercial exploitation of the software, yet she/he is more likely to attract the contri-bution of the open source community, especially those programmers who are motivated by more idealistic, non-monetary rewards. On the other hand a less restrictive license (i.e. a license which is narrow in scope) potentially enlarges the monetary rewards that the ad-ministrator can obtain but, at the same time, it renders less likely the contribution to the software by the community (except for those who are motivated by the possible monetary benefits). These theoretical predictions are then tested by the two authors. The empirical analysis is performed using a compilation of nearly 40,000 open source projects hosted on SourceForge.net. According to their investigation, restrictive licenses are more likely to be chosen when software is geared toward end-users and/or for software developed in corporate settings.
Our analysis adds to these papers in many respects. Contrary to Fershtman and Gandal (2004), who restrict their study to the most active projects and, strictu sensu, also to the most successful ones, we want to explore the determinants of the development status of open source projects focusing on the largest possible sample. Furthermore, we actually reverse the Lerner and Tirole’s causal relationship; usually, the type of license according to which the software is developed and distributed is determined by the project leader at the time of launching the project: for this reason, we believe that it is more reasonable to measure how the choice of the license of a project affects its probability of reaching a stable and mature version, i.e. of being successful, rather than the opposite.
Another interesting characteristic of the open source movement that has been frequently pointed out refers to its evolving nature. For instance, Raymond (1998) observes that the historic evolution of OSS has come in different waves. During the seventies, most of the time and effort of programmers were devoted to develop games and demos; in the eighties it has been the turn of Internet tools while in the nineties the interest shifted toward operating systems. The prediction for the future is that effort will be concentrated on “the last virgin territory” i.e. the development of programs/applications for non-techies.
The ever changing nature of OSS is also recognizable when looking at the “actors” of the community. While in the early days of the movement the community was based on a limited number of software experts devoting their spare time to program new artifacts, nowadays the for-profit, commercial world is heavily involved in the open source arena.
There are different ways for a commercial actor to enter the OSS world. One way is through the main entrance; as discussed in West (2003), many of the largest software and hardware producers have already launched or are under the process of launching open source projects. Another way for profit oriented firms to enter the OSS world is to specialize into the supply of complement goods such as the creation of documentation, the provision of support services or the development of more user-friendly interfaces of open source packages.
It seems therefore apparent that since its origin open source has experienced a drastic change in its nature and characteristics; we devote part of the paper to look for an empirical evidence of this evolution by analyzing if and how the impact of licensing terms, of software audience and content on projects’ success has changed through time.
The paper is organized as follows: Section 2 presents the dataset used for the estima-tions; Section 3 discusses more in detail some conjectures about the main drivers of OSS
development stage; these conjectures are then tested in Section 4. In Section 5 we check the robustness of our results while in Section 6 we conclude.
2
Dataset description
The aim of the paper is to estimate the main determinants of the progress of OSS projects. The dataset we employ in our analysis consists of all the open source projects that were hosted on SourceForge.net in December 2004.2 SourceForge.net (SF hereafter) is the largest online
platform which provides OS developers with useful tools to control and manage software development.3 Project administrators register their software project on SF and provide most of the information which is then available on-line. Registration is for free and administrators are encouraged to register their projects as well as to maintain up-to-date all the relevant information.
For each registered project, SF provides the following information:
- development status: information regarding the current development stage reached by the project. Each project can be classified into one (or more) of six different levels, from the earliest stage of production to a fully developed software: planning, pre-alpha, alpha, beta, production stable and mature. Even though the meaning of some levels is self-evident, no formal definition of these six stages is available on SF;
- registration date: date at which the project has been registered on SF;
- number of developers that are currently contributing to the development of the project; - number of bugs, patches and feature requests: developers and users may submit bug reports, feature requests and source code patches; for each project on SF, a dedicated tracker system automatically updates these data so that information about the total number of bugs, patches and feature requests submitted since the inception of the project is available;4
2We employ the dataset crawled by Dawid Weiss; data are available at public URL
www.cs.put.poznan.pl/dweiss/ and full documentation of the crawling system is in Weiss (2005).
3Freshmeat.net is the second largest repository with a number of hosted projects which is less than half
of those on SF. Other minor repositories are GNU Savannah, CodeHaus, GridForge and CPAN.
4The feature request tracker allows user to suggest or to require enhancements of the software. The
- license: the licensing terms under which the code is released, distributed and modified; projects listed on SF use more than 40 different licensing schemes.
- intended audience: information about software audience. SF has adopted the following categories: end-users, developers, system administrators, information technology, cus-tomers, finance, education, manufacturing, research, telecommunications, and others. Many projects fall in more than one category, meaning that they may be of interest to more than one type of audience;
- topic: information about software content. A project may be dedicated to: commu-nications, database, desktop environment, education, games-entertainment, Internet, multimedia, office-business, science-engineering, security, software development, sys-tem, terminals and text editors;
- programming language used to write the program and the operating system that sup-ports it.
Since its beginning in 1999, SF requests each project administrator to provide all these information about her/his software; nevertheless, unlike for development status and topic which classification appears to be stable through time, SF has slightly modified the clas-sification adopted to describe projects’ intended audience. Up to 2002, SF has grouped projects into only three categories (a part from the residual one, called “others”): end users, developers and system administrators. Since 2002, 7 new categories have been added to the list: information technology, customers, finance, education, manufacturing, research and telecommunications. In Section 4 we will discuss how we have dealt with this change in the classification of intended audience.
2.1
Sample statistics
The sample has been crawled from the SF web-site in December 2004 and it is made of 88192 observations.
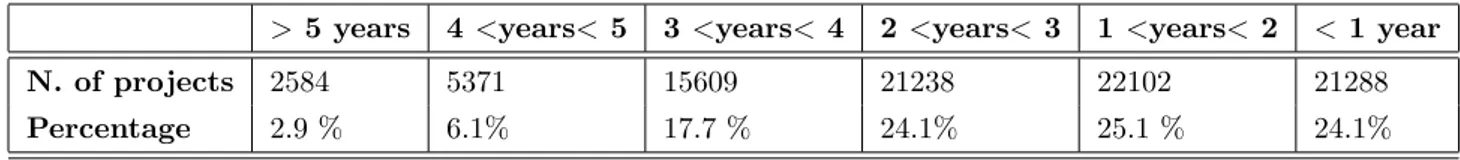
Table 1 groups projects according to their age (measured as the difference between the data collection date and project’s registration date). The oldest project was registered 5.12 years before the data collection date, that is in November 1999. The average projects’ age is 2.05 years. The table highlights a dramatic increase in the number of registrations since the
third year of activity of SF, with 15609 projects with an age between 3 and 4 years, and with more than 21000 projects that are steadily registered during each of the following years.
Table 1: Age of the projects
(difference between data collection date and registration date)
> 5 years 4 <years< 5 3 <years< 4 2 <years< 3 1 <years< 2 < 1 year
N. of projects 2584 5371 15609 21238 22102 21288
Percentage 2.9 % 6.1% 17.7 % 24.1% 25.1 % 24.1%
Table 2 provides the distribution of projects in terms of the number of active developers that have joined a certain project. Quite surprisingly, the development of the large majority of projects rests on just one developer and projects with at most two developers account for more than the 80% of the whole sample. This figures are strongly in contrast with the com-mon perception of open source as a phenomenon involving large and complex communities and confirm the observation in Krishnamurthy (2002) who first noticed that the vast ma-jority of open source software are projected, written and distributed within very restricted circles of developers. In the sample, projects with large communities, for instance more than 16 developers, account for less than 1% of the entire population. The largest community is made of 274 developers.
Table 2: Number of developers per project
One Two Three Five Between seven More than
or four or six and fifteen sixteen
Number of projects 57406 13451 8583 3046 2728 586
Percentage 66.9% 15.7% 10.0 % 3.5% 3.2 % 0.7%
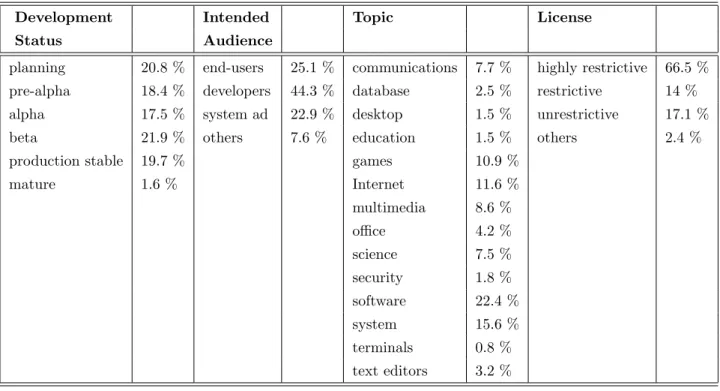
Table 3 provides some statistics on projects distribution according to development status, intended audience, topic and the terms of licensing. The table largely confirms the main characteristics of the open source movement found in previous studies:5
1. a part from mature ones which account of only 1.6% of the entire sample, projects are quite uniformly distributed across the various development stages;
2. more than 40% of the projects are geared towards developers;
3. the most popular OSS topics are games, projects related to the Internet, projects aimed at software and systems development (kernels, hardware, networking), software for communications and multimedia;
4. highly restrictive licenses (mainly GPL) represents by and large the most popular licensing scheme among projects leaders.6
Table 3: Percentage distribution of some characteristics
Development Intended Topic License
Status Audience
planning 20.8 % end-users 25.1 % communications 7.7 % highly restrictive 66.5 %
pre-alpha 18.4 % developers 44.3 % database 2.5 % restrictive 14 %
alpha 17.5 % system ad 22.9 % desktop 1.5 % unrestrictive 17.1 %
beta 21.9 % others 7.6 % education 1.5 % others 2.4 %
production stable 19.7 % games 10.9 %
mature 1.6 % Internet 11.6 % multimedia 8.6 % office 4.2 % science 7.5 % security 1.8 % software 22.4 % system 15.6 % terminals 0.8 % text editors 3.2 %
The aim of our econometric exercise is to determine the empirical regularities between the development progress of each project and its various characteristics. Clearly, one may be concerned by the presence of correlation between projects’ characteristics: for example,
6In table 3 licenses have been aggregated according to the restrictions that they impose to the use of the
software. We follow the scheme suggested in Lerner and Tirole (2005) and V¨alim¨aki (2005) where licenses are classified into three categories: highly restrictive licenses (with copyleft and viral restrictions, e.g. GPL), restrictive (only copyleft, e.g. LGPL) and unrestrictive licenses (e.g. BSD).
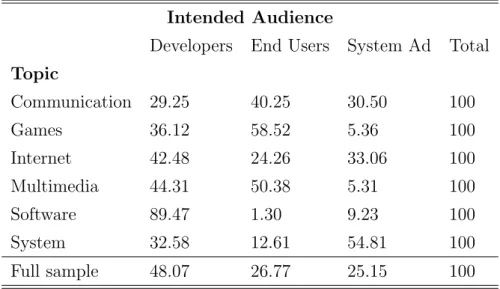
it is likely that most of the projects geared towards system administrators may be system or security tools. In this case, intended audience and topic would be colinear thus biasing the estimations.
Table 4 shows the cross-correlation between topic and intended audience. A part from software tools that, as expected, are mainly intended for developers (89.47 %), it does not emerge a clear correlation between intended audience and project’s topic. In particular, communication, system and Internet tools projects are at various extent distributed all across the three categories of intended audiences; games and multimedia tools are generally more geared towards end users and developers.
Table 4: Cross-tabulation between Topic and Intended Audience Intended Audience
Developers End Users System Ad Total
Topic Communication 29.25 40.25 30.50 100 Games 36.12 58.52 5.36 100 Internet 42.48 24.26 33.06 100 Multimedia 44.31 50.38 5.31 100 Software 89.47 1.30 9.23 100 System 32.58 12.61 54.81 100 Full sample 48.07 26.77 25.15 100
2.2
Caveat: the quality of the data
The dataset we employ is extremely large and it contains detailed information; nevertheless it presents some potential shortcomings that must be discussed before proceeding with the estimation.7
First of all, we need to observe that most of the available information is based on declara-tions of the project administrators rather than on objective measures. In some instances, in
7For a detailed discussion of the limitations of data obtained by crawling OSS repositories, see Crowston
particular in the case of the development status of the project, these declarations depend on the subjective evaluation/perception of the project leader. Even though we are not able to verify the quality of these information, we believe that projects leaders do not have incentives to misrepresent them or not to keep them up-to-date. One of the aims of project leaders is to attract other members of the community and to persuade them to join the project and this inherently induces them to provide correct information about their activity; SF itself in various documentation encourages leaders and administrators to keep a correct behavior. As reported in Lerner and Tirole (2005) “undertaking a ’bait-and-switch’ strategy at the time of recruiting new users - e.g., by making the project appear to be something other than what it really is - is unlikely to be a positive signal to prospective developers.”
A frequently claimed limitation of SF data relates to the alleged large number of projects that have been registered but that are actually abandoned (and for which the project leaders do not care about cancellation from SF). A closer look to our dataset seems to confirm this observation: around 80% of the projects does not show any interaction within the community of developers, having recorded no bugs, patches nor feature requests since its registration. According to our view, the absence of any activity may accrue to two different explanations. First, it might be the case that there is no activity simply because the project is not able to attract the interest of other developers. Therefore, the project is either completely abandoned or it is carried on by the original developer (or developers, if more than one) with no contribution from nor interaction with the rest of the community. In both instances, such a project is meaningful for our scopes: an abandoned project is a failure in the sense that it does not make any progress in the development stage; as such, it is crucial to include this project in our estimations that are aimed at evaluating the determinants of the progress (resp. the failure) of OS projects.
The second possible explanation for the absence of any activity recorded on SF is that the project has its own web page; that is, the project is listed on SF but it is actually hosted somewhere else.8 For this type of projects the information that we possess on the stage of
8Just to have an idea of the magnitude of the “listed but not hosted” phenomenon, we have randomly
extracted 100 projects from SF; we found that only 8% of these projects has its own homepage outside SF that provides files downloading and bugs reporting facilities. However, in most of the cases considered there is a clear link between SF and the outside homepage, thus suggesting that the information available on SF is maintained up-to-date.
development may not be the actual one.9 Unfortunately there is no way of disentangling between unattractive/abandoned projects and those that are hosted elsewhere; nevertheless, including in our regressions the projects that have their own web sites should not distort the results unless the vector of characteristics of these projects is biased in some way.10
In section 5, just to reassure the reader that that these pitfalls do not constitute a serious problem for our analysis, we discuss a series of control estimations that we have performed to check for the robustness of our main results.
3
Conjectures about the determinants of projects’
de-velopment stage
OSS is an extremely complex phenomenon which cannot be easily explained; nevertheless, by looking at the most recent debate we can figure out some possible conjectures about what might induce an advancement in the development stage of a project, that is, in our meaning, what might induce an open source project to succeed.
First, there is a general consensus on the fact that the licensing terms under which the software is released and distributed are of crucial importance to determine its success; therefore the first conjecture that we pose is the following:
Conjecture 1. The licensing terms have a significant impact on the development stage of the project.
Nevertheless, there is no consensus on the “expected sign” of this variable. As discussed by Lerner and Tirole (2005) and West (2003), a more restrictive license, namely a license that narrowly circumscribes the use of the product and its future developments (typically, the GPL which imposes both viral and copyleft provisions), is more likely to attract the OSS community, especially the more “purist” programmers. According to this observation the following conjecture follows:
9On the contrary, there are no reasons to believe that the remaining information is not correct since it
refers to declarations made at the time of the registration and this should not change over time.
10For example, we may have a problem if the projects with their own external web site are concentrated in
the category of, let’s say, end-users. In this case the estimations about the impact of intended audience on projects’ development stage would be uncorrect. Nevertheless there are no a-priori reasons to believe that this indeed occurs for any specific characteristic.
Conjecture 2. Projects distributed under highly restrictive terms are more likely to reach an advanced stage of development.
On the other hand, less restrictive licenses, namely those that to various extent allow for mingling of the source code with other software (i.e. LGPL) or that do not impose copyleft (typically, the BSD license), are more likely to attract programmers that prefer to be free to use the software as they wish without too many restrictions, including those that consider a possible commercial exploitation. From these arguments an alternative conjecture derives: Conjecture 3. Projects distributed under highly restrictive terms are less likely to reach an advanced stage of development.
Various studies have pointed out that the vast majority of successful open source software is geared towards sophisticated/high-end users while it is hard to find successful OSS for the
mass market segments where adopters are mainly unsophisticated users.11 According to this
observation, we might expect that:
Conjecture 4. Projects geared towards sophisticated users are more likely to reach an ad-vanced stage of development.
Since Raymond’s seminal paper12 vast part of the literature has focused on the role of
the community in the production process of OSS; the underlying idea is that the larger the community of developers (the “Bazaar”, in Raymond’s terminology), the greater the likelihood of reaching a mature and stable product.13 A closer look at the data, shows that the presence of a large community does not seem to be a necessary condition for projects’ development. We have already mentioned the paper by Krishnamurthy (2002), where the author, using a sample of 100 projects hosted on SF, has shown that projects developed within a small community have greater chances to succeed. Our sample statistics seem to support Krishnamurthy’s observation: more than a half of stable and mature projects have
11See Raymond (1999), Berlecon (2002) and Comino and Manenti (2005). According to Lerner and Tirole
(2002) this is one of the main challenges faced by the open source community: a broader adoption of OS packages within the unsophisticated clientele may result only from the collaboration of the OS community with for-profit firms aimed at the provision of more user-friendly packages as well as of support services, documentation and other user interfaces.
12See Raymond (1999).
13This idea is neatly summarized by the so-called “Linus’ Law” according to which “given enough eyeballs,
been developed by a unique individual. It seems therefore of interest to test the following conjecture:
Conjecture 5. The larger the community of developers the more likely that a project reaches an advanced stage of development.
As briefly discussed in the introduction, one of the characteristics of the OSS movement is that it is continuously changing its nature in many respects. On the one hand, as West (2003) and Bonaccorsi and Rossi (2003) among others have pointed out, the very basic nature of the OSS phenomenon based on altruistic or non-for-profit motivations to contribute, seems to be under pressure due to an ever more substantial presence of commercial actors on the open source stage. On a different theme, Raymond (1998) observes that both the content and the audiences of software projects are changing over time. Therefore, we might expect that:
Conjecture 6. The determinants of development stage of older projects differ significantly from those of newer projects.
4
Econometric framework
The latent dependent variable we use in the econometric analysis is the development status reached by each project at the data collection date. SF projects are classified into six discrete and successive categories: 1-planning, 2-pre-alpha, 3-alpha, 4-beta, 5-production stable and
6-mature.14 Let us indicate with S
i the unobserved development status of project i, such
that:
Si = β1AGEi+β2DEVi+β3DEVi2+β4HIRESTi+β5HIRESTi∗N EWi+γ0Di+δ 0
Di∗N EWi+εi
(1) εi ∼ iid N (0, σ2)
where:
14Note that in few cases administrators have classified their projects into more than one development status
category. As a rule of thumb, in the estimations we have used only those projects that have been classified into at most three consecutive categories. Moreover, for project classified into two or three consecutive development stages we have considered the most advanced category as the actual stage of development reached by the project.
- AGEi is the age of the project measured as the difference between the data collection
date and the project registration date;
- DEVi is the number of developers contributing to project i;
- HIRESTi is a dummy variable which takes the value 1 when project i is distributed
under highly restrictive licensing terms. Following Lerner and Tirole (2005) and in V¨alim¨aki (2005) licenses are classified as highly restrictive when they impose both copyleft and viral restrictions.
and where Di is a set of qualitative variables associated to project i to control for the
following characteristics: intended audience, topic, programming language and operating system. What we observe is an ordered variable representing the six categories as follows:
Yi = 1 if Si ≤ α0
Yi = j if αj−1< Si ≤ αj for j = 1, . . . , 4
Yi = 6 if Si > α4
where α0 to α4 are unobserved thresholds.
In order to account for the possible evolving nature of open source and to test for
Con-jecture 6 we have included among the regressors interactions of HIRESTi and Di with a
dummy indicating whether the project is less than 2 years old, called N EWi. This allows to
perform Wald tests for the stability of β4 and γ.15
As we have already pointed out above, in 2002, SF has added seven new categories to the list of Intended Audience. This change in the classification system may pose a problem when estimating the impact of intended audience on projects’ development status; these problems may be particularly severe with respect to the interaction terms for newer projects.
In order to reconcile the new with the old classification, we should be able to assign projects that now fall in one of the new categories to one of the old categories.16 This is easy
for those projects belonging to one of the new as well as to one of the original categories:
15We have chosen 2 years as the closest integer number to the average project’s age which is 2.05. Note
that qualitatively identical results are obtained by setting this threshold level at values in the neighborhood of 2. Results available upon request from the authors.
16Note that old categories of Intended Audience, that are End Users, Developers and System
in this case we have simply assigned these projects to the latter (old) category. On the contrary, those projects falling only into new categories have been dropped from the sample since there is no clear way to associate these observations to any of the old categories of Intended Audience.17
Given the nature of the dependent variable, we estimate the parameters through a (maximum-likelihood) ordered probit analysis. This is by now a standard maximization problem, for which Maddala (1983) derived the first order conditions. We calculate a set of diagnostic tests including goodness of fit pseudo-R2, “Link” specification test, and Wald
test for parameters stability.18
4.1
Estimation results
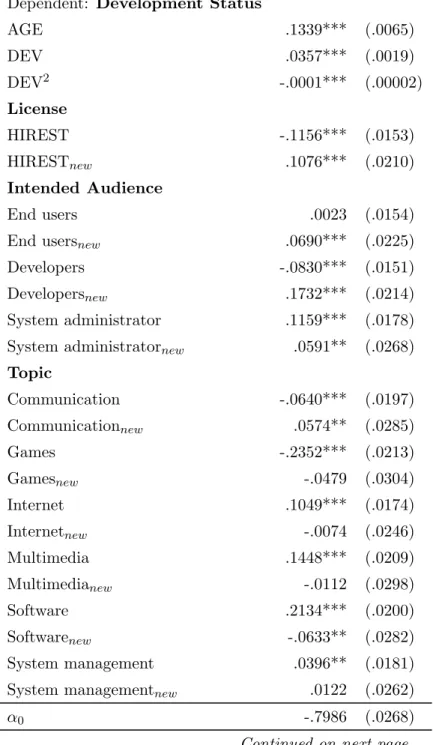
Table 5 presents the results of our regression. From this table a series of interesting obser-vations follows:
1. We performed Wald tests for parameters stability across time. Quite interestingly the set of dummies for intended audience, the license regressor and the control dummy for software topic show significant differences between old and new projects in their impact on development status. These tests substantially confirm Conjecture 6 and show that there has been a change in the nature of open source in the period
1999-2004.19 Nonetheless, there is no a clear pattern in the evolution of OSS; according
17This decision has been taken after a detailed look at the data: by focusing on those projects falling both
into one of the three original categories and in one of the new categories, we have tried to figure out any possible meaningful pattern. For instance, one might expect that projects directed to, let’s say, Customers may also fall into the category of End Users. This would suggest a “rule” to classify all projects intended for Customers as projects intended indirectly for End Users, thus reconciling new and old classification. Unfortunately, the data do not seem to support any clear association between the new and the original categories. For this reason we have preferred to drop the observations relative to the projects that were classified only into the new categories rather then arbitrarily assigning them to one of the original categories of Intended Audience.
18“Link” is a test for correct specification of the model which tests for the significance of the squared
prediction coefficient. If the estimate is non-significant the model is substantially correctly specified, in the sense that we are not able to find any additional independent variable if not by chance. See Pregibon (2003).
19Some caution is needed when interpreting the result for the intended audience: the way that we have
employed to neutralize the effect of the change in the SF classification system occurred in 2002, might not be sophisticated enough so that part of the change through time in the impact of these variables on the
Table 5: The Determinants of Development Status
Dependent: Development Status
AGE .1339*** (.0065) DEV .0357*** (.0019) DEV2 -.0001*** (.00002) License HIREST -.1156*** (.0153) HIRESTnew .1076*** (.0210) Intended Audience End users .0023 (.0154) End usersnew .0690*** (.0225)
Developers -.0830*** (.0151) Developersnew .1732*** (.0214)
System administrator .1159*** (.0178) System administratornew .0591** (.0268)
Topic Communication -.0640*** (.0197) Communicationnew .0574** (.0285) Games -.2352*** (.0213) Gamesnew -.0479 (.0304) Internet .1049*** (.0174) Internetnew -.0074 (.0246) Multimedia .1448*** (.0209) Multimedianew -.0112 (.0298) Software .2134*** (.0200) Softwarenew -.0633** (.0282) System management .0396** (.0181) System managementnew .0122 (.0262)
α0 -.7986 (.0268)
Continued on next page...
progress of the projects might be driven by the modification in the classification system. In order to check whether this is the case we have re-run the regression changing the threshold that classifies projects as “new”. Specifically, by using 1.5 years as threshold we have obtained the same results as those shown in table 5 in terms of sign and significance of all the regressors.
... Table 5 continued α1 -.2176 (.0265) α2 .2517 (.0265) α3 .9101 (.0267) α4 2.3243 (.0300) pseudo-R2 0.0241 link-test -.0055 [0.843] Wald test (Licence) 26.22 [0.000] Wald test (Intended Audience) 70.93 [0.000] Wald test (Topic) 31.05 [0.005]
Num of obs. 45100
Regressions are conditioned also on programming language and operating system. Robust standard errors in parentheses;
∗∗∗ 1%,∗∗ 5% and∗ 10% refer to the significance levels for
parameters’ estimates. α0, α1, α2, α3and α4 are cutoff points.
Wald tests are for the stability of the parameters between NEW and OLD projects; p-values in brackets.
to the already mentioned Raymond’s prediction, the positive and significant sign of the variable End usersnew, seems to confirm that open source developers are moving their
efforts also towards the production of software for non-techies, a software category that received little attention during the early days of the open source movement. This may be interpreted also as a signal of a possible commercial evolution of open source soft-ware. On the other hand, the positive and significant sign of the variable HIRESTnew,
the interaction term controlling for the impact of highly restrictive licenses for newer projects, suggests an opposite direction in the dynamics of OSS: highly restrictive li-censes, characterized by copyleft and viral restrictions, are clearly the least appropriate licensing schemes to adopt for a commercial exploitation of a software package. This is a puzzling evidence that deserves further investigation.
2. The dummy variable controlling for highly restrictive licenses (mainly GPL), HIREST, has a negative and significant coefficient; this fact confirms that the licensing terms are a key driver for the progress of a software project (Conjecture 1). Moreover, the
negative sign of the coefficient provides a support to Conjecture 3 while it rejects Conjecture 2: highly restrictive licenses reduce the likelihood of reaching an advanced development status. Noteworthy, as already mentioned above, for newer project this negative effect is significantly lower than for older projects even though it is still present: the coefficient of the interaction term HIRESTnew is positive and significant but of a
smaller magnitude than that of HIREST. A similar result has been obtained also by Fershtman and Gandal (2004) in an econometric analysis based on a restricted sample of OSS projects; the authors find that on average the per-developer contribution to the project in terms of lines source code is significantly higher under less restrictive licenses. Lerner and Tirole (2005) also find a negative correlation between the level of projects’ activity and the restrictiveness of the licensing terms. We obtain our result considering the whole sample of projets hosted on SF thus reinforcing similar findings of previous authors.
3. Projects geared towards system administrators appear to be the more successful ones. This category of intended audience is usually made of highly sophisticated users, there-fore this result seems to provide empirical support to Conjecture 4. Being geared to-wards end users and developers does not seem to have similar positive impact on the progress of a project; nevertheless, as it has been already noticed above, things change when considering newer projects: in this case software directed to these two categories of final users have a larger likelihood of reaching stability of production.
4. Conjecture 5 is supported by the data: the size of the community, here proxied with the number of developers, has a positive impact on project’s development status. It is interesting to note that the size of the community affects in a non linear way the likelihood of reaching an advanced stage of development, being negative the coefficient
of DEV2. This suggests that the contribution of an additional developer to the
pro-ductivity of the community of developers working on a certain project decreases with the size of the community; a possible interpretation of this result relies on coordination issues: the larger the community of developers, the more complex its organization and governance.
5. Consider now the topic category: while Internet, multimedia (e.g. audio/video soft-ware and graphics) and softsoft-ware (e.g. interpreters and compilers) tools have positive
and significant parameters, projects aimed at developing games and, quite surpris-ingly, communication systems (e.g. chat and file sharing) have negative and significant coefficients. It is interesting to note that for the two categories of software and commu-nication systems, the magnitude of the coefficients for newer projects is significantly reduced.
6. Finally, as expected, the coefficient of the variable AGE is positive and significant: the older the project the more advanced its development stage.
5
Robustness
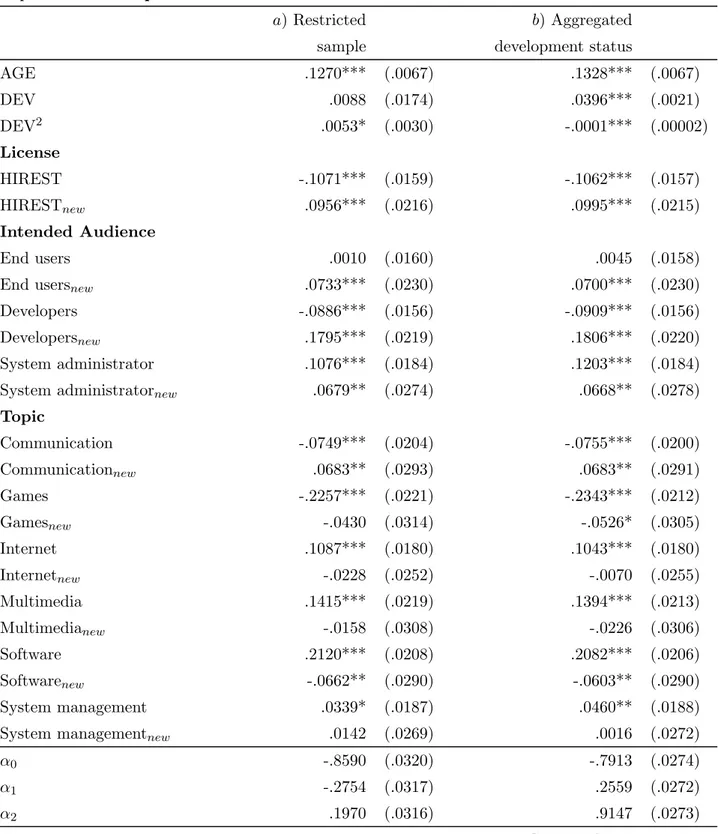
In order to control for the robustness of our results and to deal with the various concerns related to the quality of the data provided on SF, we have run two complementary estima-tions; equation 1 has been estimated a) by dropping from the sample the 5%-largest projects measured in terms of the number of developers, and b) by aggregating the development sta-tus of the projects into four broader categories: 1 if the project is classified as planning, 2 if the project is classified as pre-alpha or alpha, 3 in case it is classified as beta and 4 when the project falls into either the production stable or the mature category.
The reasons for having chosen these two additional regressions to control for the robust-ness of our full-sample estimation are manyfold.
As discussed in Section 2, one of the main concerns about the use of the data collected on SF is the so called “listed-but-not-hosted” phenomenon: projects may decide to create their own web-sites, omitting to keep up-date the information on their development stage reported on SF. Although there is no clear relation between the project’s characteristics and the fact that it has its own web-page, two patterns seem reasonable: projects that have reached an advanced development stage or projects that have a large community of developers may need more sophisticated and specific on-line facilities than those provided by SF. Therefore, the “listed-but-not-hosted” concern may be a real issue, if any, in relation to projects that have reached an advanced development stage or that are characterized by a large community of developers.
In regression a) of table 6 we have dropped from the sample the top 5% of projects in terms of the number of developers; namely, we have replicated the estimation of equation 1 focusing on projects with a “small community of developers”, that is, those projects for
which the “listed-but-not-hosted” should be a less relevant issue.
Regression b) has been included in order to deal with the second reasonable pattern according to which a project creates its own web-page. Consider a “production stable” project that creates its own web-page and that, at the same time, it omits to up-date the information on SF, i.e. it is “listed-but-not-hosted”. In this case, if the project goes forward to the next stage, i.e. it becomes mature, than the information on SF would not be correct: the project is observed as “production stable” while in the reality it is “mature”. By aggregating the more advanced stages of development we reduce these possible shortcomings of the database, even though we base our estimation on a rougher classification of the development stage.
Employing broader categories of development status is also helpful to control for another potential pitfall of the database. As discussed above, it is not easy to disentangle what makes a project to belong to a, lets say, “pre-alpha” stage of development rather than to “alpha”: by aggregating successive categories we also control for this possible source of distortion.
The results reported in table 6 are in line with those obtained in our full-sample regression of table 5: the signs and the statistical significance of all the regressors do not show relevant differences in the three estimations.20 The stability of results in the three sets of regressions
strongly supports our full-sample estimation and it is a confirmation of the quality of the dataset; therefore we can claim that the “listed-but-not-hosted” phenomenon either it is not an issue (i.e. even those projects that have their own web-page continue to keep the information on SF up-to-date) or, it does not distort the results of our analysis.
20The main difference is in the impact of the number of developers on development status: in regression a),
DEV2affects positively the likelihood of reaching an advanced development status, rather than negatively as
in table 5, thus suggesting an increasing marginal impact of an additional developer. This is not surprising: when the community is not big enough, coordination is not a problem and having one more developer working on a project may have a more than proportional impact on the probability of its success.
Table 6: Robustness
Dependent: Development Status
a) Restricted b) Aggregated sample development status
AGE .1270*** (.0067) .1328*** (.0067) DEV .0088 (.0174) .0396*** (.0021) DEV2 .0053* (.0030) -.0001*** (.00002) License HIREST -.1071*** (.0159) -.1062*** (.0157) HIRESTnew .0956*** (.0216) .0995*** (.0215) Intended Audience End users .0010 (.0160) .0045 (.0158)
End usersnew .0733*** (.0230) .0700*** (.0230)
Developers -.0886*** (.0156) -.0909*** (.0156) Developersnew .1795*** (.0219) .1806*** (.0220)
System administrator .1076*** (.0184) .1203*** (.0184) System administratornew .0679** (.0274) .0668** (.0278)
Topic Communication -.0749*** (.0204) -.0755*** (.0200) Communicationnew .0683** (.0293) .0683** (.0291) Games -.2257*** (.0221) -.2343*** (.0212) Gamesnew -.0430 (.0314) -.0526* (.0305) Internet .1087*** (.0180) .1043*** (.0180) Internetnew -.0228 (.0252) -.0070 (.0255) Multimedia .1415*** (.0219) .1394*** (.0213) Multimedianew -.0158 (.0308) -.0226 (.0306) Software .2120*** (.0208) .2082*** (.0206) Softwarenew -.0662** (.0290) -.0603** (.0290) System management .0339* (.0187) .0460** (.0188) System managementnew .0142 (.0269) .0016 (.0272)
α0 -.8590 (.0320) -.7913 (.0274)
α1 -.2754 (.0317) .2559 (.0272)
α2 .1970 (.0316) .9147 (.0273)
... Table 6 continued
α3 .8590 (.0318)
α4 2.2555 (.0346)
pseudo-R2 0.0208 0.0281
link-test 0.0556 [0.188] -.0149 [0.617] Wald test (Licence) 19.61 [0.000] 21.38 [0.000] Wald test (Intended Audience) 73.83 [0.000] 73.39 [0.000] Wald test (Topic) 34.80 [0.002] 29.93 [0.008]
Num of obs. 42814 45100
Regressions are conditioned also on programming language and operating system. Robust standard er-rors are in parentheses;∗∗∗ 1%,∗∗ 5% and∗ 10% refer to the significance levels for parameters’ estimates.
α0, α1, α2, α3and α4 are cutoff points. Wald tests are for the stability of the parameters between NEW
and OLD projects; p-values in brackets.
6
Conclusions
The existing empirical literature on open source software has focused almost exclusively on the analysis of “case studies”. This kind of research allows for a very in-depth understanding of a certain project but it is very limited when trying to derive more general conclusions. This seems to be particularly relevant in the case of open source: the interest in studying how individuals interact and coordinate in distributed teams of programmers has biased previous works conducted in this field towards the analysis of very large and successful projects such as Linux, Apache and Freenet. However, even though these projects certainly represent challenging and interesting cases to be studied, they constitute only a minor part of the vast and complex open source world which, on the contrary, flourishes mainly within very small circles of few developers: the data shows that two projects out of three are run by only one developer.
This paper is a first attempt to fill this gap: by employing a very large dataset crawled from SourceForge.net, we have investigated the main determinants of the progress in the development stage of open source projects; the question that we have tried to address is: “what characteristics/variables are more likely to affect the ability of an open source project to reach a stable and mature development stage of production?” In trying to answer this question we have tested some of the theoretical predictions that have been put forward in
the literature on OSS.
A series of interesting conclusions can be drawn from our analysis. We have shown that projects geared towards sophisticated users (i.e. system administrators) or projects aimed at developing tools and applications for the Internet, multimedia and software have greater chances to succeed in terms of reaching a more advanced development stage. On the contrary, projects devoted to the production of tools for games and telecommunication as well as projects distributed under highly restrictive licensing terms have a significantly smaller chance to advance in their development status. Interestingly, we have found that the size of the “community of developers” has a non-linear impact on the chances of a project to advance in its stage of development; the negative and significant sign of coefficient of
DEV2 might signal possible problems of coordination when the community of developers
gets larger. Finally, we have also found that the determinants of projects’ developments stage change with the age of the project in many dimensions, i.e. licensing terms, intended audience and content thus supporting the common perception of open source as an extremely dynamic phenomenon.
Acknowledgements: We wish to thank Nicolas Garrido for the extremely helpful discus-sions and Riccardo Marcon for research assistance.
References
Berlecon (2002). Free/Libre and Open Source Software (FLOSS): Survey and Study. Inter-national Institute of Infonomics, University of Maastricht and Berlecon Research.
Bonaccorsi, A. and Rossi, C. (2003). Contributing to the common pool in open source software. a comparison between individuals and firms. Sant’Anna School of Advanced Studies, IIT Working Paper.
Comino, S. and Manenti, F. M. (2005). Government policies supporting open source software for the mass market. Review of Industrial Organization, 26(2):217–240.
Crowston, K., Annabi, H., and Howison, J. (2003). Defining Open Source Software Project Success. Proceeding of International Conference on Information Systems.
Crowston, K. and Howison, J. (2004). The Perils and Pitfalls of Mining SourceForge. Proc. of Workshop on Mining Software Repositories at the International Conference on Software Engineering ICSE.
Fershtman, C. and Gandal, N. (2004). The Determinants of Output per Contributor in Open Source Projects: An Empirical Examination. CEPR Discussion Paper, 4329.
Hertel, G., Niedner, S., and Herrmann, S. (2003). Motivation of software developers in open source projects: and internet-based survey of contributors to the linux kernel. Reserch Policy, 32:1159–1177.
Krishnamurthy, S. (2002). Cave or Community? An Empirical Examination of 100 Mature Open Source Projects. First Monday, 7.
Krogh, G. V., Spaeth, S., and Lakhani, K. R. (2003). Community, joining, and specialization in open source software innovation: a case study. Reserch Policy, 32:1217–1241.
Lakhani, K. R. and von Hippel, E. (2003). How open source software works: ”free” user-to-user assistance. Research Policy, 32:923–943.
Lerner, J. and Tirole, J. (2002). Some Simple Economics of Open Source. Journal of
Lerner, J. and Tirole, J. (2005). The Scope of Open Source Licensing. Journal of Law, Economics & Organization, 21(1).
Pregibon, D. (2003). Goodness of link tests for generalized linear models. Applied Statistics, 29:15–24.
Raymond, E. (1998). Homesteading the Noosphere. First Monday, 3.
Raymond, E. (1999). The Cathedral and the Bazaar: Musings on Linux and Open Source from an Accidental Revolutionary. Sebastapol, CA: O’Reilly and Associates.
V¨alim¨aki, M. (2005). The Rise of Open Source Licensing. A Challenge to the Use of Intel-lectual Property in the Software Industry. Turre Publishing, Helsinki.
Weiss, D. (2005). A large crawl and quantitative analysis of open source projects hosted on sourceforge. Research report ra-001/05, Institute of Computing Science, Pozna´n University of Technology, Poland.
West, J. (2003). How open is open enough? melding proprietary and open source platform strategies. Reserch Policy, 32:1259–1285.
! " # $ % " ! & ! ! ' ( ! ) * + , * - -. / " - . ! 0 - ) # ! ! # $ $ 1 / 1 % & + 0 ' # ! . / " ! $( ) * % & $ 2 ) ! 1 % . % 1 $ " ! / / ' ! * ' ! % ( ! ) $ ) # $ $ 3 4 5 4 5 . ! % & 1 6 ( ( ( 7899 789: # %
' ($ 0 ( ; < $ $ = $ + 1 . % 1 . + , # $ - . 1 0 ! ! = # $ $ + . / $ 0* # $ $ + . / $ 1 1 ( - . % +2 3 - 4/ # # % & 1 # 3 - . - ( 5 6$ # ' 1 ! ) . ' + 2 + $ $ ! * . ' . ! * - 7 $8 ) 9 . ' 0 + ' * . 7 $8 ) : ' $ ! ) $ / " % ) = ! 0 ! 1 > ! " &" " 6 $ " ' %-* & $ ' * # - "- $ -# + 2 /
& * 1 ' ' . 7 ) ) ' 1 % / ! . ) 7 ) * 2 ) + + ?, ( @ 1 ' 1 ) 7 ) 9 1 > 1 # 44 . : ) " 1 ) * " - ' '- .0 ! ' & ?* /@ 6 A . - ' '- .0 ! ' & ?* //@ ' . ( # ! - , .> - & % ' . . 4 1 ' , * 3 ' ! # # . & 1 0 0 ! & . 6 - - . 4 . - / & 3 ! 0 ( ) . 3 ( # & ( " + $ ! ! & & # $ $ # / 4 & ' * # ! ) ;$ % < % "- $ - #
& * 2 1 ! ' 1 - ( (/ . 1-. 7BB ' "- $ - # , + 3= & 9 ' ( ) ' # - ' * "- $ - # + 2 / & : 3 &#* 0 + 2 / & % $ # $ $ & / # ! $$ & ' 4.0 & 5 .0 / . % & 1 ' & .> 1 7 ) ) & 1 / . 1 * ' 0 . 7 ) ) & & ! $ , ! ' -& 7 ) ) & ' >$ ! / " $ # 8 - 7 ) ) & * * ! # 3 -1 ) 3 . 4 " % ! $