Academic Year
2017/2018
PhD Course
International Doctoral Program in Economics
Breakthrough innovations
and appropriability strategies:
three essays based on
The Queen’s Award for Innovation
Author
Giovanna Capponi
Supervisor
Abstract
Drawing on a sample of 1383 innovations which won a Queen’s Award for Innovation between 1976 and 2017, we aim to examine innovation level appropriability strategies both within and outside of the patent system. This study is motivated by the general lack of empirical research on the identification, validation and analysis of breakthrough innovations beyond the use of patents and patent data.
The first essay introduces a method to identify commercially successful breakthroughs within a broad sample of patents. After performing a patent matching, we define a binary measure of patent value based on the Queen’s Award for Innovation and we test the ability of five popular patent-based indicators to correctly classify patents against our measure. We select the best model following a Decision Curve Analysis, a method for the evaluation and comparison of prediction models which enables us to assign different weights to the consequences of a mis-classification. Once identified the most suitable specification, we estimate an out-of-sample prediction to find breakthrough innovations within a comprehensive set of patents filed by GB applicants over the past forty years. Results show that breakthrough innovations tend to be clustered in time and sectors. Our analysis highlights that in the UK over the past 20 years, breakthrough innovations emerged predominantly from the field of electrical engineering. Rel-evant robustness checks support the validity of our method.
The second essay provides new evidence on the way firms design appropriability strategies at the product innovation level. We design an ad-hoc survey to investigate the use and the perceived effectiveness of different appropriability mechanisms in the specific case of radical innovations. We observe that firms consistently combine formal and informal IP to prevent imitation and their strategy may vary depending on the innovations’ development phase. Our results also support the broad stream of literature finding informal appropriability mechanisms to be more effective than patents in several economic contexts.
Finally, the third essay explores the relative importance of patents and secrecy at the product innovation level. There is a growing tendency in the literature towards considering these mech-anisms as complements rather than substitutes. We are interested in testing how the relative importance of patents and secrecy changes depending on a set of product-related factors. To achieve a more realistic and detailed understanding, we analyse this relationship separately depending on the phase of the product development process. Our findings show that the tem-poral dimension affects the design and effectiveness of different mechanisms, with secrecy being consistently more effective in the early development phases. Patents tend to be considered more important during commercialisation and in general when a product requires external funding. Product complexity emerges as a substitute for patents and it increases the probability that firms adopt secrecy. Internal and external sources of knowledge have contrasting effects.
Acknowledgements
This thesis is meant to be a starting point. I largely owe this result to my supervisors, who could not have been more supportive. First and foremost, I wish to thank Prof. Alessandro Nuvolari for his suggestions, advice and for providing personal and professional guidance at every step. Special thanks are also due to Dr Arianna Martinelli, for always helping me in many different ways. Finally, I wish to thank Dr Paola Criscuolo, who gave me the chance to advance my thesis at Imperial College London. Her expertise and dedication have made an incredible difference.
I am extremely grateful to all winners of the Queen’s Award for Innovation who participated in this study as their contribution was crucial to this piece of research. Further, I wish to thank staff members of the Queen’s Award Office for the important feedback and clarifications on the working of this scheme.
I would also like to thank Professors Andrea Mina, Bruce Tether and Andrea Vezzulli for reading this manuscript and providing useful suggestions and observations.
Needless to say, my gratitude extends to everyone who provided support, advice, consolation and drinks along the way.
Above all, thanks to my boyfriend Taco, for understanding this choice from the beginning, becoming the most frequent flyer between Charleroi and Pisa. More importantly, thanks for not running away during this last year as I am positive I reached the emotional stability of a psychopath.
Thanks to my friends and colleagues in Pisa for sharing the ups and downs that a PhD brings. I am looking forward to meeting you around and sharing more, whatever path we choose. Thanks to my London dear colleagues, old friends, unlucky flatmates - Taco, again, and Franci - who stood strong in front of my recurrent dramas and made this time in the UK something I will never forget.
Thanks to all my friends for their constant support and curiosity towards my career choice. Some of you think I am doing rocket science, others wonder whether I have been working at all over the past four years. Hopefully, the truth is in the middle.
Last but not least, thanks to my family for unconditionally believing in me at all times no matter what.
Contents
Abstract ii
Acknowledgements iii
1 Introduction 1
2 Breakthrough innovations and how to find them 6
2.1 Introduction . . . 6
2.2 Innovations’ impact and patent value . . . 8
2.2.1 Patent value: what is it? . . . 8
2.2.2 Measuring patent value . . . 10
2.3 The Queen’s Award for Enterprise: background . . . 13
2.3.1 Eligibility, selection and relevance of the QAI . . . 14
2.4 Dataset construction . . . 18
2.4.1 Patent matching . . . 18
2.4.2 In-sample and out-of-sample composition . . . 20
2.5 Methods and variables . . . 21
2.5.1 How to find breakthrough innovations . . . 22
2.6 Results . . . 24
2.6.1 Descriptive evidence . . . 24
2.6.2 ROC curve approach . . . 25
2.6.3 DCA approach . . . 26
2.7.1 Internal robustness check: test a full model . . . 29
2.7.2 External robustness checks: test against the top 1% criterion . . . 30
2.7.3 Cross check with R&D100 patents . . . 30
2.8 Incremental and radical innovations: a reappraisal of the UK case, 1976-2013 . . 32
2.9 Conclusion . . . 35
3 Radical innovations and appropriability strategies: evidence from the Queen’s Awards for Innovation 38 3.1 Introduction . . . 38
3.2 The Queen’s Award for Innovation Competition . . . 41
3.3 The Queen’s Award for Innovation’s survey . . . 44
3.4 Survey results . . . 47
3.4.1 The Queen’s Award for Innovation competition . . . 47
3.4.2 Overview of the respondents . . . 48
3.4.3 Characteristics of the innovations . . . 50
3.4.4 Appropriability strategies . . . 54
3.5 Conclusion . . . 63
4 Patents and secrecy: combining and comparing their effectiveness for inno-vation protection 65 4.1 Introduction . . . 65
4.2 Literature . . . 68
4.2.1 Comparing secrecy and patents . . . 68
4.2.2 Determinants of the relative effectiveness of secrecy and patents . . . 69
4.3 Data collection . . . 72
4.4 Variables . . . 74
4.5 Descriptive statistics . . . 76
4.6 Empirical results . . . 78
4.7 Discussion and conclusion . . . 80
Appendices 86
A Appendix to Chapter 2 . . . 87
A.1 Patent matching . . . 87
B Appendix to Chapter 3 . . . 90
B.1 Preliminary steps on the data collection . . . 90
B.2 Factor analysis on appropriability strategies . . . 91
B.3 Survey transcript . . . 94
C Appendix to Chapter 4 . . . 109
C.1 Question format . . . 109
C.2 Ordinal logit models marginal effects . . . 110
C.3 Robustness check: Seemingly Unrelated Regression . . . 112
List of Tables
2.1 Overview of the patents matched with QAI winning innovations in terms of filing authority . 19
2.2 The structure of the dataset . . . 21
2.3 Overview of the variables . . . 22
2.4 Descriptive statistics . . . 24
2.5 Empirical estimates, coefficients are odds ratios . . . 25
2.6 Prevalence of false positives and false negatives at selected probability thresholds . . . 28
2.7 P ALL descriptive statistics . . . 28
2.8 Testing a full model . . . 29
2.9 Share of top 1% cited patents we capture over time . . . 30
2.10 Share of R&D100 patents we capture . . . 32
2.11 Patents’ concentration in technology fields . . . 35
3.1 Queen’s Award for Innovation survey response rate . . . 46
3.2 Reasons for submitting the innovation to the QAI, average score on a scale from 1 (Not at all important) to 5 (Extremely important) . . . 48
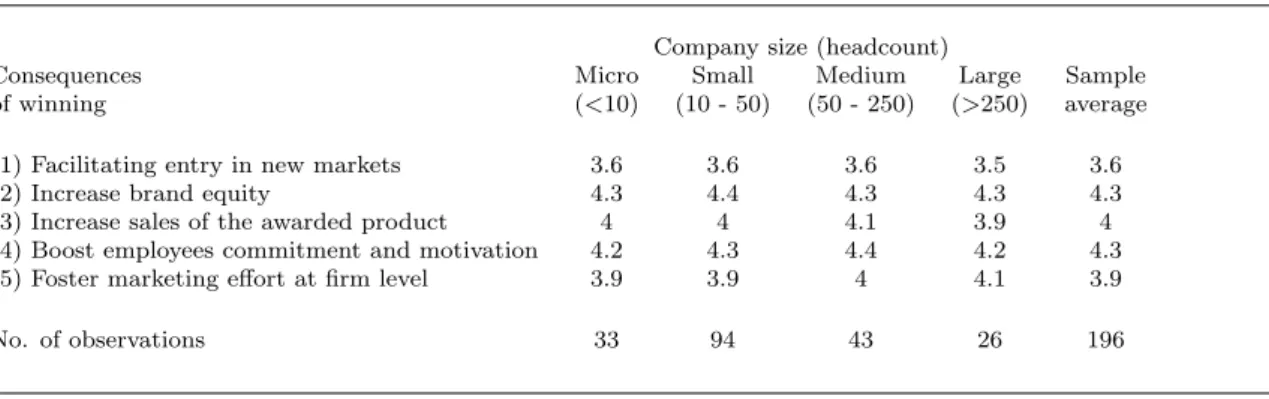
3.3 Main consequences of winning a QAI, average score on a scale from 1 (Not at all important) to 5 (Extremely important) . . . 49
3.4 Innovations classified by technology field and company . . . 50
3.5 Importance of 10 sources of knowledge per technology field, average score on a scale from 1 (Not at all important) to 5 (Extremely important) . . . 51
3.6 Average importance of external sources of knowledge for the development of innovations, by collaboration status . . . 52
3.7 Types of innovation and use of external sources of knowledge, number of observations: 196 . . 53 3.8 Frequency of top ranking of different appropriability mechanisms at each development phase . 55
3.9 Frequency of adoption and perceived importance of different appropriability mechanisms per
technology field, no. of observations: 196 . . . 57
3.10 Frequency of adoption and perceived importance of different appropriability mechanisms per company size, no. of observations: 196 . . . 57
3.11 Complementarities between different appropriability mechanisms, no. of observations: 196 . . 57
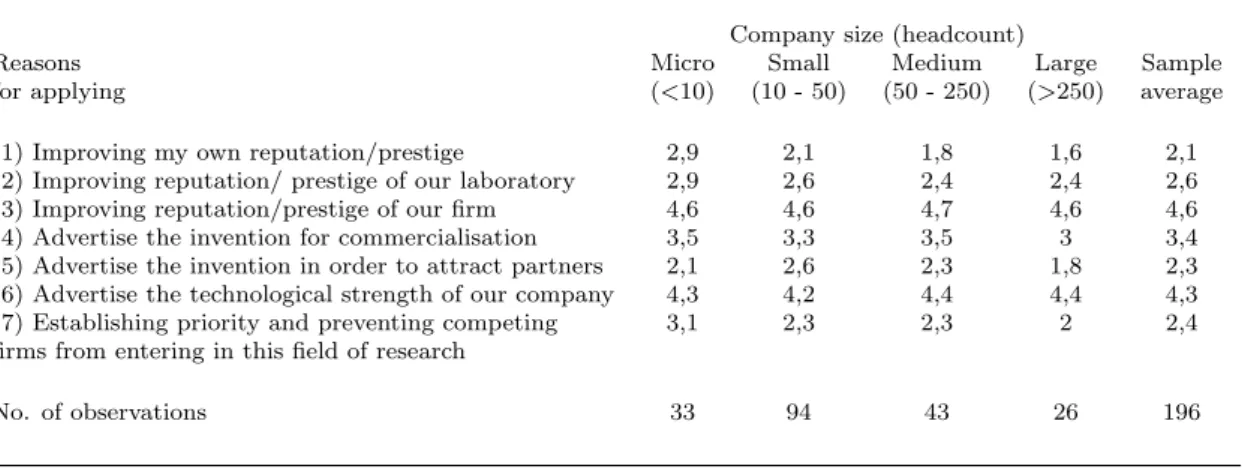
3.12 Importance of 5 reasons to patent per company size, average score on a scale from 1 (Not at all important) to 5 (Extremely important) . . . 58
3.13 Importance of 5 reasons for patenting per technology field, average score on a scale from 1 (Not at all important) to 5 (Extremely important) . . . 59
3.14 Reasons not to patent by company size, no. of observations: 91 . . . 60
3.15 Reasons not to patent by technology field, no. of observations: 91. . . 61
4.1 Overview of the variables . . . 76
4.2 Summary statistics . . . 76
4.3 Adoption of secrecy and patents . . . 77
4.4 Ordered logit regression results (p-values in brackets) . . . 81
4.5 Testing the coefficients across the different dependent variables (p-values in brackets) . . . . 82
4.6 Combining patents and secrecy . . . 83
B.1 First-stage factor loadings, no. of observations: 192 . . . 92
B.2 Second-stage factor loadings, no. of observations: 196 . . . 93
C.1 Marginal effects M1 . . . 110
C.2 Marginal effects M2 . . . 110
C.3 Marginal effects M3 . . . 111
List of Figures
1.1 Relationship among patents, inventions and innovations (Basberg, 1987) . . . 3
2.1 Decision curves . . . 26
2.2 Decision curves on the probability threshold interval [0.1-0.2] . . . 28
2.3 Share of top 1% cited patents we capture over time . . . 31
2.4 Filing year comparison . . . 33
2.5 Comparing trends in sectors . . . 34
2.6 Technological opportunities by technology field . . . 36
3.1 Joint frequency distribution of deemed patent value and person/month working on the innova-tions, based on 74 innovations (70% of the patented innovainnova-tions, the remaining 30% answered ‘Do not know’ about the patent monetary value). The marker size indicates a number of innovations that ranges from 1 (small circles) to 4 (large circles). . . 53
3.2 Sectoral patterns in appropriability strategies . . . 62
4.1 Importance of secrecy and patents, no. of observations: 196 . . . 78
4.2 Importance of secrecy and patents depending on innovation-related factors . . . 79
A.1 Patent matching flowchart . . . 89
Chapter 1
Introduction
Despite the general awareness of patents’ shortcomings both as indicators of innovative activity and appropriability mechanisms, there is a fundamental problem of observability which limits the scope of empirical research. The heavy reliance on patent data somehow reflects the so-called streetlight effect, a form of observational bias whereby people search where it is easier to look. On the one hand, it is hard to identify and qualify innovations which are not patented, on the other hand, informal appropriability mechanisms are simply difficult to observe. In this respect, existing survey-based studies provide useful evidence on firm-level practices but fail to address more specific dynamics emerging at the innovation level.
This thesis attempts to analyse innovation level appropriability strategies within and outside of the patent system. The main source of data is the Queen’s Award for Innovation (hereafter QAI), a prestigious prize awarded by a panel of experts who select winning innovations on the basis of novelty and commercial success. The scheme of the Queen’s Awards was initially announced on February the 4th 1965 by Prime Minister Harold Wilson with the purpose to re-ward and stimulate the advance of technical change in the British industry. To give a couple of examples of winning innovations, in 1978 the Committee in charge awarded the Imperial Chem-ical Industry, PharmaceutChem-ical Division, for the introduction of ‘Tamoxifen’, a drug for breast cancer treatment. In electronics, Quantel ltd won in 1988 for the Development of ‘Harry’, a digital video recording, editing, processing and compositing system. Since the Award is granted
upon demonstration of commercial success, there is a few years lag between the launch of the innovation on the market and its recognition. In terms of the research method, the QAI is a quality indicator which is exogenous to patents. Therefore, it enables us to observe break-through innovations developed outside of the patent system and evaluate the adoption and the effectiveness of patents as an appropriability mechanism.
Over the past three decades, patenting activity experienced a remarkable boom worldwide. In the US, the number of applications filed nearly doubled between the mid-80s and the mid-90s (Kortum and Lerner, 1999); more in general, between 1992 and 2002 patent applications in-creased by 40% in Europe, Japan and in the US (OECD, 2004). At the same time, patent regimes have been strengthened along several dimensions. To start with, a concerted effort towards harmonisation lead to the creation of centralised examination systems to reinforce the rights of the patent holders, ensure a broader coverage and make the enforcement process easier (Kortum and Lerner, 1999). Moreover, the scope of patents has been extended to fields which were not patentable before and the extent of patent protection has been broadened. This ac-commodating legal environment together with the progressive shift towards a knowledge-based economy and the emergence of new technological fields are the main factors explaining the rising of what is considered the ‘Pro-patent’ era (Arundel, 2001).
The use of patents and patent statistics as economic indicators have been growing exponen-tially within academic research. The first contributions date back to Scherer (1965), Schmookler (1966) and Griliches (1984) who proposed patent counts as indicator of innovative output. Since then, patents have been used to address a number of relevant issues within the Economics of Technical change and Innovation Studies literature (ETIS) such as the sources of economic growth (Beggs (1984), Graue (1943)), the speed of technical change (Evenson (1984), Bosworth (1980)), the competitive position of firms and countries or the structural dynamism of indus-tries (Griliches, 1990). More recently, researchers have used patent characteristics to produce value-weighted indicators of innovative output and explicitly capture inventions’ radicalness (Dahlin and Behrens, 2005). Yet, it is well known that patents as indicators of inventive activ-ity suffer from important limitations, best summarised by Griliches (1990) (p. 296) as ‘Not all inventions are patentable, not all inventions are patented, and the inventions that are patented
differ greatly in quality, in the magnitude of inventive output associated with them’. Also, while patent data do contain some innovations, they also contain inventions with no commer-cial value (Basberg, 1987). Figure 1.1 provides a generalised picture of the relationship among patents, inventions and innovations as proposed by Basberg (1987).
Figure 1.1: Relationship among patents, inventions and innovations (Basberg, 1987)
Several shreds of empirical evidence suggest that the majority of innovations have been devel-oped outside of the patent system. To mention a few, Moser (2005), using data from world technology fairs, found that more than 80% of exhibits at the 1851 Crystal Palace were not patented. Through a survey of 604 European innovative firms, Arundel and Kabla (1998) observed that the patenting rate was 36% for product and 25% for process innovation, with great variability across sectors. More recently, Fontana et al. (2013) assessed the propensity to patent considering a set of innovators receiving a ‘R&D100’ Award between 1977 and 2004. The results show that only 10% of the innovations were patented. The same percentage was found by Hall et al. (2013), in an assessment of the importance of patenting in the UK, using CIS data from 1998 to 2006.
alternative mechanisms. In the US, Levin et al. (1987) found that patents were mostly effec-tive in pharmaceutical and chemistry, while in other industries secrecy, lead time and learning curve advantages were ranked higher. Similarly, Cohen et al. (2000) established that alternative mechanisms had a higher score both in product and process innovation, with patents receiving a comparable rating only in drugs, branches of mechanical engineering such as special ma-chinery, medical instruments and computers. In terms of size, Lerner (1995) found that small firms tend to patent less because of the high costs related to enforcement. With European data, Arundel (2001) observed that firms in all size classes value secrecy more than patents as an appropriability mechanism. In sum, though informal protection mechanisms are difficult to observe, they provide a valuable alternative which enables firms to opt out of the patents setup. Yet, policy proposals often fail to consider why and to which extent firms choose alternative mechanisms (Moser, 2016).
To expand in this direction, we work on a sample of 1383 breakthrough innovations winning a QAI between 1976 and 2017. We first performed a patent matching, finding that 32% of the breakthroughs in our sample are patented. Then, we investigated the characteristics of the innovations and the appropriability strategies in place by means of a survey. Leveraging on these data, we intend to contribute to the existing literature in several ways. In the next chap-ter, we empirically test the relationship between patents and innovations, developing a method to identify commercially successful breakthroughs on a large scale. By linking patent-based indicators with the Award winning event, we estimate the probability of a patent to protect a breakthrough innovation out of sample. Our method allows us to characterise breakthrough innovations emerging in the UK over the past four decades in terms of years and sectors. In Chapter 3, we present the descriptive evidence emerging from the survey investigation. Ex-ploiting innovation level data, we introduce a conceptualisation of appropriability strategy that includes a time dimension. Specifically, we analyse the way firms protect their intellectual property along the different phases of the innovation development process. This perspective highlights the complementary use of formal and informal appropriability mechanisms within a strategy. Also, by comparing different appropriability strategies, we observe that firms tend to have specific preferences that go beyond sectoral differences. Building on these findings,
Chapter 4 presents an exploratory study assessing the relative importance of patents and se-crecy. Our analysis shows how this relationship changes depending on the characteristics of the innovation and its stage of development. Moreover, we find evidence that when both patents and secrecy are deployed, the former is likely to serve purposes which go beyond knowledge protection, such as licensing and signalling. In light of these results, Chapter 5 provides some final conclusions.
Chapter 2
Breakthrough innovations and how to
find them
1
2.1
Introduction
Breakthrough or radical innovations are generally regarded as discontinuities along specific tech-nological trajectories leading to a shift in the dominant paradigm (Dosi, 1982). As such, they play a crucial role within the creative destruction process that characterises the way technolo-gies and products are replaced (Ahuja and Morris Lampert, 2001). In contrast, the literature refers to continuous or incremental innovations when the result of the innovation process is an improvement of the existing technology (Garcia and Calantone, 2002). Considering the compo-sition of the technological landscape, ‘almost all inventions are useless; a few are of moderate value; and only a very very few are breakthroughs’ (Fleming, 2007). Breakthrough innovations are therefore rare events which are difficult to identify.
For these reasons, breakthrough innovations are more easily perceived by in depth qualitative study rather than large scale quantitative studies that use noisy proxy of innovation quality. Researchers typically resort to patents and patent statistics to perform this task. As part of their advantages, patent documents are standardised, widely available and rich of information,
1This Chapter is joint work with Arianna Martinelli (Sant’Anna School of Advanced Studies) and Alessandro
offering a sizeable amount of data to academics and practitioners who would hardly have any alternatives. In this context, the challenge becomes the measurement of patent value, a metric which plays a crucial role in informing policies to the extent that it makes patents a more reli-able estimate of inventive output, the value of intangibles and the private returns to the patent owners (Bessen, 2008). Specifically, the awareness of the high variability of patent value lead to the emergence of a stream of literature investigating whether the information associated with patent documents would be suitable to generate value-weighted patent count (Harhoff et al., 2003). So far, patent-based indicators have been tested for their ability to capture patent heterogeneity and reproduce the skewed distribution associated with their value, with several studies supporting indicators’ validity both from a theoretical and an empirical point of view (see for example Trajtenberg (1990); Putnam (1996); Tong and Frame (1994); Lanjouw and Schankerman (2001); Harhoff and Reitzig (2004)).
Depending on the metrics, patents allow for both the ex-ante assessment of the nature of a technology and the ex-post evaluation of its impact. To mention a few contributions, Dahlin and Behrens (2005) and Verhoeven et al. (2016) looked at the pattern of patents’ backward citations to identify radical innovations based on ex-ante characteristics. Other studies classify inventions as radical depending on forward citations, i.e. based on their ex-post technolog-ical impact (Ahuja and Morris Lampert (2001), Fleming (2001)). For example, in light of the skewed distribution of patent value and the importance of patent citations in determining patent quality, a commonly adopted criterion defined by Ahuja and Morris Lampert (2001) considers breakthrough inventions the top 1% most cited patents. Even if plausible, it is hard to tell how many genuine breakthroughs this approach would capture.
More in general, despite the extensive attempts to characterise and therefore identify break-through innovations, the actual effectiveness of the proposed metrics remains uncertain. More-over, while the technological aspects have been widely addressed, the economic dimension which in fact determine the shift from invention to innovation, received less attention.
To address this issue, we construct a direct measure of patent value based on the Queen’s Award for Innovation (hereafter QAI). The QAI is a British accolade that recognises commercially suc-cessful innovations developed in the UK since 1966. After performing a patent matching, we
define a binary value measure telling whether a patent protects a QAI winning innovation or not. It is worth underlining that the QAI indicator signals outstanding innovations, rather than inventions: economic success is a sine-qua-non condition for winning. We compare the ability of five patent-based indicators to identify QAI patents in a broader sample. Leveraging on Decision Curve Analysis, we implement a rigorous evaluation procedure to select the best performing model. In a second stage, we use the estimated parameters to predict the value of patents out-of-sample.
The main ambition of this paper is to identify commercially successful breakthroughs within a representative sample of patents filed by GB applicants over the past forty years. We find that breakthrough innovations tend to cluster in time and sectors. Our procedure is broadly supported by a number of robustness checks.
The reminder of this paper is organised as follows. Section 2.2 provides an overview of the litera-ture on patent value definition and measurement. Section 2.3 presents the Queen’s Award prize scheme. Section 2.4 describes the process behind the dataset construction. Section 2.5 goes through the methodology. Section 2.6 reports the results and section 2.7 shows some robustness checks. In the last sections we discuss the findings and we provide some final remarks.
2.2
Innovations’ impact and patent value
2.2.1
Patent value: what is it?
Patent-based indicators have been used in different ways to measure the nature and impact of technologies.2 We are interested in assessing the impact and value of patents on the basis of
the ex-post performance of the innovations. The concept of ‘patent value’ can be interpreted in different ways. Patents generate a ‘private’ form of value which is the discounted stream of revenues that the owner expects from them. Considering the society as the benefiting entity, patents also embed a ‘social’ component of value to the extent that they contribute to the total
2Comparing existing approaches, Arts et al. (2013) found that ex-post metrics capturing the impact and
value of patents (e.g. forward citations) outperform ex-ante indicators reflecting the nature and novelty of technologies (e.g. patterns of backward citations).
stock of technology (OECD, 2009).
Patent private value can emerge from the technological significance of an invention, the strate-gic factors behind the choice of patenting or the actual economic returns that patents yield. It is worth noting that there is an intrinsic level of overlapping in this specification, especially between the technological and the economic value which are likely to be positively correlated (De Rassenfosse et al., 2016). The technological value of patents is defined as the size of the inventive step, that is the distance between the pre-existing invention and the invention itself, with patentability establishing the ‘minimum’ requirement for a technology to qualify as an inventive step (De Rassenfosse et al., 2016). Other papers consider patents as technologically valuable when they contribute to the subsequent development of advanced technologies: by adding up to a firm’s knowledge basis and competences, patents enhance the internal absorp-tive capacity (Frietsch et al. (2010); Cohen and Levinthal (1990). Evidence of this relationship shows that patents are positive predictors of new product development (Hagedoorn and Cloodt, 2003), the formation of important alliances (Rothaermel and Deeds, 2004) and sales revenues from new products (Nerkar and Roberts, 2004).
A different framework arises when patents are considered ‘strategic’, i.e., they are filed for rea-sons that go beyond appropriation of returns (Arundel and Patel, 2003). Indeed, the decoupling of technology and market needs induced the diffusion of patent fences and thickets, i.e. group of property rights used to protect substitute innovations or to create a dense net of overlapping claims (Blind et al. (2006); Reitzig (2004); Reitzig et al. (2007); Ziedonis (2004)). At a more general level, drivers such as blocking competitors and preventing them from ‘inventing’ around contributed to the emergence of the so- called ‘patent paradox’, a situation in which firms and industries do not rely on patents to profit from innovations but are still patenting aggressively (Hall and Ziedonis, 2001). Given the unprecedented surge in the number of applications filed worldwide, the strategic component of patent value is becoming an increasingly important issue especially in industries characterised by complex products and patent thickets (Bessen, 2003). Patents also carry an economic value component which is possibly the broadest and the hardest to define and capture. It is related to the overall market conditions and shaped by the interplay of various factors such as the technology, the firm itself and the competitors (Frietsch et al.,
2010). Ceteris paribus, high-quality inventions are inherently valuable because their techni-cal superiority is likely to generate greater market demand and to ensure a relatively longer monopoly power compared to less relevant inventions (De Rassenfosse et al., 2016). How-ever, market size and structure matter and demand elasticity influences the market response so that a technically superior product may lead to a greater or lesser increase in market share (De Rassenfosse et al., 2016). Moreover, the financial gains accruing from a commercialised product can hardly be inferred from a single patent, as it usually results from a combination of technologies (Frietsch et al., 2010).
Finally, patents themselves have an intrinsic economic value, a ‘patent premium’, which can be defined as the difference between the value of the patented invention and the technological con-tribution of the invention to the state of the art (Arora et al., 2008). In other words, patents generate rents which are proportional to their effectiveness as an appropriation mechanism, which can be very different depending on the industry or market context (De Rassenfosse and Jaffe, 2018).
2.2.2
Measuring patent value
In the literature we find two main approaches to measure patent value: to estimate it directly or to use patent information to develop a quality-adjusted measure of inventive output (Bessen, 2008).
Early contributions in the first group investigate the value of patents by using data on the stock market valuation of firms (Griliches (1981); Pakes (1985); Hall (1993); Hall et al. (2007)). In this case, patent economic significance is directly tied to the value of intangibles within a business.
An alternative line of literature exploits the fact that each year, a patent holder should pay a maintenance fee to keep a patent in force. Therefore, renewal decisions can be used to infer the value of patents (Schankerman and Pakes (1986); Pakes (1986); Lanjouw et al. (1998)). Since agents are likely to renew a patent depending on the expected value it carries, this metric embeds potentially relevant information on patents’ value Schankerman and Pakes (1986). It
allows researchers to obtain monetary estimates of patent rents as well (Bessen, 2008). Still, this indicator alone presents some drawbacks: above all, it is a truncated measure which captures decisions taken within the limit of a patent statutory lifetime, setting a lower rather than an upper bound of patent value (Harhoff et al. (2003); Gambardella et al. (2008); Bessen (2009)). Also, this approach assumes the value of patents to decrease monotonically, while the actual distribution may be more skewed (Gambardella et al., 2008).
Other direct ways to estimate patent economic value include indicators based on patent trans-actions such as the decision to license (Gambardella et al. (2007); Sampat and Ziedonis (2004)) and the level of licensing revenues (Sampat and Ziedonis, 2004). Licensed patents are eco-nomically valuable to the extent that the licensee only bears the license costs if she expects to generate some profits from it.
Other studies exploit survey data to collect patents’ expected sales value (Gambardella et al. (2008);Harhoff et al. (1999); Harhoff et al. (2003)). An important contribution in this respect is provided by the Pat-Val EU Survey which obtains a direct measure of patent value from in-ventors’ direct ex-post evaluation of the patent. The resulting variable reproduces the skewed distribution of patent value, but it is likely to embed an upward bias due to inventors percep-tion.3
As for the indirect approach, the count of patents’ forward citations is by far the most popular metric tested, with several studies supporting its validity as an indicator of technologically valuable patents (Albert et al. (1991); Carpenter et al. (1981); Trajtenberg (1990)). Each patent document report information on the so-called prior art, i.e., either scientific papers or previous patents that can be used to evaluate the novelty of the patent. The new patent could protect an improvement of the prior technology, or an alternative way to apply it, or a dif-ferent method to produce it (Jaffe et al., 2000).4 The number of forward citations relate to
technological significance because they signals patents’ role in establishing a successful line of innovation. Moreover, a certain continuity along the same line reflects a costly research effort
3Also, this evaluation is performed on patents granted around ten years before the survey, thus it embeds a
substantial time advantage
4Note that references to prior art are either present in the application document (i.e., reported by the
assignee) or added by the examiner during the examination procedure. Distinguishing for the source of the forward citations is meaningful while using citations to trace knowledge flows (Criscuolo and Verspagen, 2008) or studying strategic patenting (Lampe, 2012); less so while using citations counts to measure patent value.
which is presumably justified by a high expected economic value (Trajtenberg, 1990). Another variable related to patent value is the number of claims, insofar as ‘An inventor’s invention is embodied in his or her claims’ (Tong and Frame, 1994).5 Each patent contains some claims
which disentangle the invention in different contributions, which represent built-in inventions themselves. Assuming that the technological effort is related to both scientific and economic activities, then the number of claims appears to be a good indicator of patent value (Tong and Frame, 1994).
Other studies consider the family size of patents which refers to the number of countries in which a patent is filed and enforced. Since the geographical extension of a patent coverage is costly, only the inventions with a sufficiently high expected value on the market will be pro-tected abroad (Lanjouw et al., 1998). Moreover, by comparing patents within a family, it is possible to single out their economic relevance as the difference in value across countries: given that they protect the same technology, most of the variation in quality is imputable to market size (Putnam, 1996).
Based on this evidence, researchers also construct composite indicators either to obtain a com-prehensive measure of value or to break down the metrics reflecting the economic significance from those carrying more technology-related information. In this paper we test the performance of an index which was first introduced by Lanjouw and Schankerman (2004), relating forward and backward citations, number of claims and family size through a confirmatory factor anal-ysis. The authors show that the use of a multiple indicators leads to substantial information gains compared to its components, as it captures the unobserved attribute of a patented in-novations which influences all of them. This attribute should reflect both the technological relevance of patented innovations and the market potential, allowing researchers to catch the value-related variation of the single indicators (Lanjouw and Schankerman, 2004). In a recent paper, De Rassenfosse and Jaffe (2018) adopted an improved version of this index which takes into account the different distributional features of the single indicators. Following this de-velopment, we build the indicator including the number of renewals instead of the number of backward citations and we specify a non-linear construct for every single measure to better
5Claims define the boundaries of the invention’s legal protection. Any element of the invention which is
capture their common variation.
Our approach combines the two streams of research by providing a direct measure of patent value and testing the effectiveness of commonly used indirect metrics in capturing the value related variation. The key challenge we face is the joint identification of the technological and the economic contributions characterising breakthrough innovations. Evidence shows that in-dicators derived from patent documents are to some extent correlated to technical, strategic and economic value and their individual ability to single out different components largely de-pends on the context and the design of the study. We introduce a binary indicator based on the QAI which we considered to be related to patents’ economic and technical significance. The Award selection procedure recognises outstanding innovations and explicitly verifies their market success. In the next section we provide a detailed description of the characteristics of the Award.
2.3
The Queen’s Award for Enterprise: background
The scheme of the Queen’s Awards was initially announced on February the 4th 1965 in the House of Commons by the Prime Minister Harold Wilson, following the recommendations of a Committee chaired by HRH The Duke of Edinburgh. In a later speech in the House of Common, Wilson specified that: ‘The purpose of this new scheme is twofold: to reward and to stimulate. I hope that the Award will encourage industry in its efforts to achieve the improvements in exports and the technological advance on which our national future so much depends.’ 6
To keep the scheme’s parameters updated, the first draft released in 1965 announced that ‘the working of the Award Scheme as presented in our Report should be reviewed after five years so that any modifications which practical experience of its operation had shown to be desirable could be introduced’ (Mountbatten-Windsor, 1965). In practice, apart from the first presenta-tion draft, they made only three other official reports: in 1970, 1975 and 1999. In each review, the Committee in charge collected some feedback from applicants to assess whether and to
6Available as a transcript of a House of Common sitting at:
which extent to amend the scheme. Over its lifetime the nature of the prize remained largely unaffected and, still today, it represents the most prestigious distinction for individuals and businesses in the UK (Groom, 2015). In fact, every year major British newspapers such as the Financial Times and The Guardian publish the list of winners along with specific articles devoted to a selection of them.
At present, what is known as ‘The Queen’s Awards for Enterprise’ recognises achievements in three separate fields: innovation, international trade and sustainability (DTI, 1999). In general, there are no restrictions regarding sectors nor predetermined pattern of regional allocation: all large, medium or small organisations which regularly operate as a ‘business unit’ in the UK, are eligible to apply. Through the years, another issue commonly discussed was whether the grant should be associated with tangible rewards, for example, special tax reliefs. However these suggestions have never been endorsed as ‘their inclusion would detract from the dignity of the Honour’ (McFadzean, 1970). Instead, ‘The Award signifies recognition by the Sovereign of striking achievement and we recommend that it should be represented by an emblem which the holder of the Award should be authorial to display in a wide variety of ways [...] it may be dis-played on flags, plaques, note-paper, packaging, and goods themselves’ (Mountbatten-Windsor, 1965). To encourage further improvement, the founding Committee limited the currency of the Award to 5 years, during which winners have the right to display the emblem together with the year of victory (Mountbatten-Windsor, 1965).
In this study, we only focus on the Queen’s Award for Innovation. In the following part, we provide some details on the past and current eligibility criteria to give a precise idea of the parameters used to classify an innovation as successful.
2.3.1
Eligibility, selection and relevance of the QAI
At the very beginning, what was known as the Queen’s Award for Technological Achievement was rewarding ‘A significant advance, leading to increased efficiency, in the application of an advanced technology to a production or development process in British industry or the pro-duction for sale of goods which incorporate new and advanced technological qualities.’ Already
in the first report in 1970, the Scheme Review Committee underlined the applied connotation of the definition by removing the word ‘advanced’ before ‘technology’, and emphasising that ‘the timely application of established technology, as against advanced technology, may well be equally important and deserving of recognition, particularly in the less sophisticated sectors of industry’ (McFadzean, 1970).
In the same spirit, in 1999 the Review Committee in charge drafted the final and most substan-tial reformulation of the criteria for the Award. Above all, the name changed from ‘Queen’s Award for Technological Achievement’ to ‘Queen’s Award for Innovation’, with the aim to broaden the eligible set of subject matters to innovation in services and, in general, innovations which are not technology-driven. There are two main groups of eligibility criteria:
- Outstanding innovation, resulting in substantial improvement in business perfor-mance and commercial success, sustained over not less than two years, to levels which are outstanding for the goods or services concerned and for the size of the applicant’s operations, and arising in the fields listed below. Or:
- Continuous innovation and development, resulting in substantial improvement in business performance and commercial success, sustained over not less than five years, to levels which are outstanding for the goods or services concerned and for the size of the applicant’s operations, and arising in the fields listed below.
Achievements under either criterion may be assessed in any of the following fields: the invention, design, production (in respect of goods), performance (in respect of services, including advice), marketing, distribution, after sale support, of goods or services (BEIS, 2013, p. 6).
The application procedure requires a detailed description of the innovation and evidence of its commercial success covering a period of two to five years before the submission. Specifically, candidates should support their application providing the patterns of growth of earnings associ-ated with the innovation, leveraging on indicator such as profitability, market share, and others. Because of the meritocratic nature of the Award, the Committee refrained from fixing a number
of prizes to be given each year (McFadzean, 1970). From 1975, following a number of claims, the Review Committee approved the disclosure of some information regarding the reasons for fail-ure of applicants to improve the industry understanding of the scheme (Mountbatten-Windsor, 1975).
Initially, the body in charge of selecting winners was a mix between members from within and outside the Government, forming an Advisory Committee which was assisting the Prime Minister by making recommendations about the winners. This group was also supported by two subordinate committees under the guidance of the Ministry of Technology (Mountbatten-Windsor, 1965). In 1999, the subordinate committees were replaced by appointed Panels of ad-hoc Judges with the relevant expertise, one for each Award category. The Panel of Judges examining the Queen’s Award for Innovation is chaired by the Permanent Secretary of the Department for Business, Innovation and Skills. Applicants are initially screened by a group of contracted technical assessors, who provide a first round of recommendations (BEIS, 2013). In September 2018, we had the chance to speak with two contracted technical assessors who provided more details on the selection process pipeline7 and the criteria adopted to estab-lish innovations’ quality 8 (personal communications with two contracted technical assessors,
28/09/2018).
7The applications are allocated to the assessors depending on their area of expertise and the number of
assessors depends on the number of applications. Assessors are qualified in science and technology, most of them are PhD graduate working in different industries, as a team they are generalists. At the moment there are 6 assessors and a leading assessor.
Assessors review the applications and produce a short list of recommended applicants for the Panel of Judges. Every application is appraised by two people blinded from each other. Their decisions have then to be discussed and approved by the lead assessor. On average, it takes one hour for an assessor to evaluate an application, including the writing up of the feedback to unsuccessful applicants. At this stage, the selection process has a yes or no outcome. After the first round of recommendations, shortlisted firms have to produce audits to confirm their figures. Afterwards, the lead assessor sits in front of the Panel of Judges and justifies the decisions of the technical assessors.
The panel of judges is currently formed by eight innovation experts. Panellists are appointed by consultations with stakeholders, both within government and externally, once the sectors and the regions which are currently represented are known. The panel is reviewed every three years, with no fixed term on membership. Candidates’ due diligence and CSR practices are the main concerns at this stage and the retention rate tends to be high. The final list has to be approved by the Prime Minister and its Advisory Committee.
8Technical assessors evaluate innovativeness by looking at competitors and current market offerings. They
use the description of the nature of the product reported in the application, the narrative content explaining the innovation process and the challenges faced in developing new solutions. Since a couple of years, assessors are allowed to use web sources to verify key claims, company data, and, if mentioned, patents’ validity. Patents are regarded as supporting evidence rather than a determining signal of novelty. Financial criteria are also important: there should be consistency between the numbers applicants claim, the statements, and the firms’ size.
Despite the rigorous procedure, the evaluation is made on a pool of self-selected applicants. To mitigate potential bias problems, we cross-validate the relevance of the Award-winning in-novations by comparing the listing of the QAI dataset and the well-know SPRU Inin-novations Database (Pavitt, 1983). The latter collects over 4000 technological breakthroughs introduced in Britain between 1945 and 1983, selected by experts’ recommendations. The two dataset overlap for a period of 18 years, in which the SPRU Innovations Database identifies 2595 tech-nical achievements, and 424 innovations receive a QAI. Exploiting the names of the company and the time references reported in both dataset, we considered a match to be successful if the innovator’s name was the same and the time difference between the introduction of the innovation in the SPRU Database and the QAI recognition was at most five years. We found 144 matching observations, suggesting that 34% of the prizes awarded between 1966 and 1983 were awarded to innovations listed in the SPRU Database. In our view, this provides a very significant corroboration to the reliability of the QAI selection process.
Given the recognised significance of this accolade, some studies dealing with breakthrough in-novations have used QAI winners as a source of data, relying mostly on information collected via questionnaires. The first book using the QAI as a source of data was Wealth from Knowl-edge, studies of Innovation in Industry, written by Langrish et al. (1972). This work contains 84 case studies based on firms winning in 1966 and 1967. In particular, the authors look at ‘success stories’ to capture the relation between technological and organisational aspects (see Langrish et al. (1972), page 4). Conway (1995) assessed the relevance of informal external linkages in the innovation process for 35 Award winning innovation, looking at both QAI and British Design Awards. Tether (1996) carried out a major piece of research based on a dataset of significant innovations to produce empirical evidence on the actual contribution of SMEs to innovation in Britain. Similarly to Conway, the sample featured QAI and British Design Award winners covering the decade between 1980 to 1990. Tether (1998) estimated the direct value of innovations based on financial information gathered from 23 firms. The results show that the direct value tends to increase with firm size, meaning that the interpretation of small firms being more innovative on the basis of innovation counts, could be misleading. Focusing on firms in Hertfordshire winning a Queen’s Awards for the Export of Technology between
1985 and 1995 - in few cases winning a Queen’s Award for Innovation as well - Simmie (1998) investigated the reasons behind the tendency of innovative firms to congregate in metropolitan regions. Romijn and Albaladejo (2002) stressed the role of SME in fostering the innovation activities of UK firms based in South East England, submitting a survey to enterprises winning a QAI between 1998 and 1999.
To the best of our knowledge, this paper represents the first attempt to systematically gather QAI data over the lifetime of the scheme, to match the winning inventions to patents and to use QAI as a method for detecting breakthrough innovations.
2.4
Dataset construction
2.4.1
Patent matching
Every year the full list of the QAI winners is published with the name of the company, the location and a brief description of the innovation, for a total of 1475 prizes awarded between 1966 and 2015. 9 For example, a typical entry taken from 1993 looks as follows:
BT Laboratories (BTL) Optical Research Division, Ipswich, Suffolk, Metal organic vapour phase epitaxy for making semiconductor devices for the optoelectronics in-dustry.
Private, public and non for profit entities are eligible for a QAI provided that the innovation contributes to industrial efficiency. In case of joint development, the Award is given to both entities. It was not before 1975 that the Review Committee in charge required sales figures in the QAI application to provide evidence of the economic value of an innovation (Mountbatten-Windsor, 1975). For this reason, for the purpose of this study we consider only prizes awarded from 1976 till 2015, for a total of 1234 innovations.
9Between 1966 and 1975, 55 combined Awards in Export and Technological achievement were assigned. From
1976 onward, combined Awards discontinued, instead, entrants started having the possibility of competing in more categories in the same year (BEIS, 2013).
Starting from this listing, we first matched the names of the winning firms to the unique code identifying them in AMADEUS Bureau van Dijk (BvD), a database containing comprehensive information on 21 million European companies. 10 We matched 983 innovators (80% of our
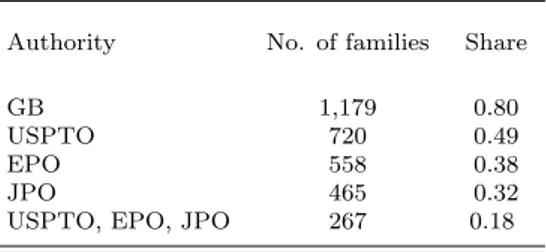
sample) for which we could collect the relevant firm-level information and the list of patents associated with each firm. We then looked for possible matches between the innovations winning a QAI and one or more patent family.11 We did not impose any restrictions on the application authorities, however, we limited the search to a certain time interval which varies depending on the rules governing the prize scheme in every period.12 Using this approach, we found that 32% of the innovations winning a QAI between 1976 and 2015 were in fact protected by at least one patent at the time of the Award. Specifically, we singled out 1468 patent families filed between 1976 and 2013 protecting 401 innovations.13 Table 2.1 reports the number of matched patent
families having at least one application filed in a major Patent Office and the corresponding share calculated on all the matched patent families. We can observe that almost half of them has a filing at the USPTO and 38% at the EPO.
Table 2.1: Overview of the patents matched with QAI winning innovations in terms of filing authority
Authority No. of families Share GB 1,179 0.80 USPTO 720 0.49
EPO 558 0.38
JPO 465 0.32
USPTO, EPO, JPO 267 0.18
10AMADEUS covers all the companies having more than ten employees over a moving window of ten years,
leaving out those which ran out of business at each update. Also, it keeps track of M&A history and it is possible to find an enterprise even after changes in structure and ownership. Furthermore, the matching between innovators and AMADEUS entries was checked using companies’ addresses and their main sector of activity.
11The OECD Patent Statistics Manual defines patent families as ‘the set of patents (or applications) filed in
several countries which are related to each other by one or several common priority filings’ (OECD, 2009). Our analysis is based on DOCDB families, which are expert-validated families. In principle, the technical content of patents protecting the same invention should be the same. The DOCDB definition builds on experts’ assessment on whether the technical content of a patent matches an existing family or not (Mart´ınez, 2010)
12A detailed explanation of the patent matching procedure is provided in Appendix A.1
13However rigorous, the method we followed looks into a specific and limited time window to find matching
2.4.2
In-sample and out-of-sample composition
To assess the performance of the selected indicators in identifying the Award-winning innova-tions, we only focus on the applications filed at the USPTO. There are two main reasons behind this choice: first, since the winning companies are all based in the UK, by selecting a foreign authority we are implicitly raising the quality level of the group of valuable patents. Typically, companies file applications in foreign patent offices for inventions that are planning to econom-ically exploit abroad. Second, we can easily retrieve the scores of the patent-based indicators from the OECD Quality database, which provides details on roughly 7 million USPTO patents, with filing dates going as back as 1976 (Squicciarini et al., 2013).
We construct a dummy variable taking value 1 for each USPTO application finding a positive match in the QAI sample. This is our indicator of commercially successful breakthroughs. The accuracy of patent-based indicators will be established on the basis of their ability to identify the QAI patents within a larger pool of patents. We build the control group using all the patent applications filed at the USPTO by companies having at least one QAI patent. This sampling choice allows us to compare inventions developed in the same context as the awarded one, i.e. leveraging on the same set of resources and capabilities. To keep the focus of the analysis on innovations developed in the UK, we only retain control patents filed by GB applicants.14
The construction of the in-sample requires access to the complete list of the patents associated with a firm, therefore we only considered the winning companies that we successfully matched on AMADEUS. An additional reduction to the sample size resulted from matching the patent applications to the OECD Quality database, which covers patent applications filed between 1976 and 2015 at the USPTO. To have consistent estimates across observations, we exclude patents having missing values on at least one of the indicators of interest. The final in-sample consists of 9,638 patents, 524 QAI patents (5,4%) and 9,114 controls.
To find commercially successful innovations on a large scale, we construct the out-of-sample as a comprehensive set of USPTO patents filed by GB applicants from 1976 to 2013. Starting from the full set of USPTO patent applications listed in OECD Quality database (around 7
14The Queen’s Award for Innovation strictly recognises innovations developed in the UK. The innovator can
be either a British firm or the UK branch of a multinational company. While the QAI patents are filed by GB applicants by definition, we need to enforce the GB origin for the control patents.
million patent applications), we single out the patent applications associated with a GB appli-cant in PATSTAT. Excluding those reporting missing values on at least one of the indicators of interest, we end up with an out-of-sample of 128,829 patents.
Table 2.2 reports the composition of the full sample.
Table 2.2: The structure of the dataset
Dataset In-sample composition No. observations % of total In-sample QAI patents (5,4%) 524 0,40%
Controls (94,6%) 9,114 6,60% Out-of-sample 128,829 93,00% Full sample 138,467 100,00%
2.5
Methods and variables
We estimate logit models specified as follows:
logit(p) = b0 + b1X + b2T ECH DU M M IES + b3Y EAR DU M M IES (2.1)
Where p=prob(QAI=1). QAI is a direct measure of patent value indicating whether a patent protects a QAI winning innovation or not, X is a vector of patent-based indicators,
TECH DUMMIES and YEAR DUMMIES are a set of dummies controlling for patents’ tech-nological classes and filing year.15
We now proceed with the estimation of the composite index developed by Lanjouw and Schanker-man (2004). As we mentioned before, we introduce a modified version by (1) including renewals instead of the number of backward citations, and (2) using a non linear latent variable model which better resembles the variables’ distribution (De Rassenfosse and Jaffe, 2018). In par-ticular, we estimate the indicator through a confirmatory factor analysis using a Generalised Structural Equation Model, specified as follows:
E[Yk|V∗] = G(αk+ V∗βk) (2.2)
15Based on Schmoch (2008) classification, which is reported in the OECD Quality database (Squicciarini
where Yk(K = 1, ..., 4) is the vector of values for the K single patent-based indicators, G(.) is
the link function which varies depending on the distributional features of the variables, α is the constant and V∗ is the vector of latent patent value with factor loading βk.16 To obtain
consistent weights across observation, we estimate the composite indicator on the full sample. Once estimated the factor loadings, we predict the latent variable VALUE, which is the adjusted version of the composite patent-based indicator developed by Lanjouw and Schankerman (2004). Table 2.3 provides the complete list of variables.
Table 2.3: Overview of the variables
Name Description
QAI Binary variable equal to 1 if the patent refers to an awarded innovation, 0 otherwise RENEWAL No. of years in which a granted patent has been kept alive
FWD CIT5 No. of citations that a patent receives over a period of five years after the publication date FAM SIZE No. of patent offices at which an invention has been protected
CLAIMS No. of claims per patent
VALUE Continuous variable obtained as a latent factor from RENEWAL, FWD CIT5, FAM SIZE and CLAIMS YEAR DUMMIES 38 dummies for the patents’ earliest filing year
TECH DUMMIES 35 dummies for the patents’ technical field
To control for exposure, we limit the forward citation count to five years after the publication date.
2.5.1
How to find breakthrough innovations
We start comparing the ability of patent-based indicators to identify QAI patents in-sample. Working with binary models, the key issue we face is the definition of a threshold probability which best classifies patents as QAI or controls. We first evaluate different specifications using a Receiver Operating Characteristic (ROC) curve, a method which selects the best model based on its accuracy, i.e. the percentage of correctly classified patents at a certain threshold.17 The
ROC curve estimates the optimal probability threshold as the one maximising sensitivity and
16Note that V∗ is a latent exogenous variable and, to allow for identification, we should anchor it to an
observed variable. For this reason we constrain the path coefficient of family size to 1.
17The ROC curve is defined on a space having sensitivity as y coordinate and 1-specificity (fall out rate) as x
coordinate. The ROC curve of a diagnostic test leading to perfect discrimination would be a vertical line from (0,0) to (0,1) joined with a line from (0,1) to (1,1), while the curve of a poor performing test would resemble the 45◦lines, which is the chance level (Hajian-Tilaki, 2013). In this study, we adopt the empirical (non-parametric) ROC estimator, which constructs the curve by connecting the (1-specificity, sensitivity) points obtained at all possible cut-off values (Park et al., 2004).
specificity with equal weight.18 While giving an estimate of the models’ accuracy, this approach does not incorporate information on the consequences of a misclassification and it fails to tell whether a specification is worth using at all. This concern is particularly prominent in epidemi-ology where a false negative result is much more harmful than a false-positive. In this cases, a model with a high level of accuracy but a level of specificity which is slightly higher than sensitivity, would be a poor choice. Similarly, in this study we aim to identify breakthroughs out-of-sample and we would prefer a model which limits the false positive rate rather than a model which maximises accuracy.
For these reasons, we select the best model adopting a decision curve analysis (DCA), a com-parative approach which incorporates information on the consequences of a misclassification (Vickers and Elkin, 2006). This method assesses the effectiveness of the prediction models by looking at the theoretical relationship between the threshold probability of being a break-through and the relative value of false-positive and false-negative. To explain the concept, suppose that a surgeon needs to intervene on a patient depending on a marker prediction on the patient probability to have cancer. On the one hand, an unnecessary intervention can have severe side effects, on the other hand, failure to intervene on a true positive case may lead to the patient’s death. Assume that the surgeon would definitely proceed if the probability to have cancer is 30%, but he would not if the probability was only 1%. However, if the risk was 10%, he would be uncertain. To fix pt at 10% means that the surgeon considers the failure to intervene on a positive case to be 9 times worse than an unnecessary surgery (Vickers and Elkin, 2006). This relationship is defined by the net benefit formula (first introduced by Peirce (1884)):
N et Benef it = (T rue P ositive Count/n) − (F alse P ositive Count/n) × (pt/(1 − pt)) (2.3)
Where pt is the threshold probability. In this equation, (pt/(1-pt)) is the ratio telling the relative importance of false negative and false positive results. The basic mechanism to follow would then be to (1) choose a meaningful range [0,1] for pt, (2) look at the net benefit associated
18To obtain the optimal threshold for each model we adopt the Youden Index, which selects the point on the
curve having the maximum vertical distance from the chance line, maximising both sensitivity and specificity (Youden, 1950).
with each point in the interval for the models we are comparing, (3) choose the optimal threshold and the best model accordingly.
Finally, using the parameters estimated in-sample with the selected model, we predict the probability of a patent to be a commercially successful breakthrough on the full sample. The threshold probability indicated by the DCA will then be use to classify the patents as relevant or not.
2.6
Results
2.6.1
Descriptive evidence
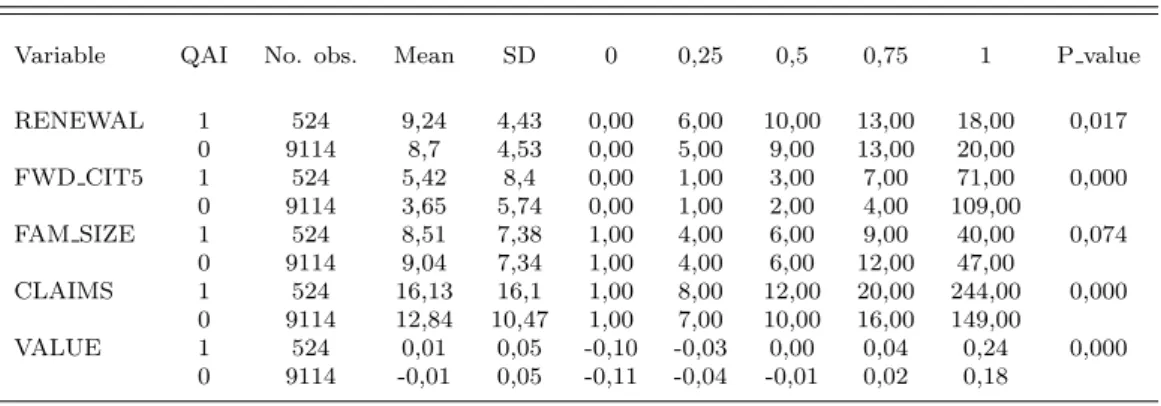
Table 2.4 provides the summary statistics of the patent value indicators separately for the control and the awarded patents. To test for significance, the last column reports the two-tails asymptotic p-value resulting from the Fligner Policello test 19.
As expected, we observe that the mean tends to be higher than the median for forward Table 2.4: Descriptive statistics
Variable QAI No. obs. Mean SD 0 0,25 0,5 0,75 1 P value RENEWAL 1 524 9,24 4,43 0,00 6,00 10,00 13,00 18,00 0,017 0 9114 8,7 4,53 0,00 5,00 9,00 13,00 20,00 FWD CIT5 1 524 5,42 8,4 0,00 1,00 3,00 7,00 71,00 0,000 0 9114 3,65 5,74 0,00 1,00 2,00 4,00 109,00 FAM SIZE 1 524 8,51 7,38 1,00 4,00 6,00 9,00 40,00 0,074 0 9114 9,04 7,34 1,00 4,00 6,00 12,00 47,00 CLAIMS 1 524 16,13 16,1 1,00 8,00 12,00 20,00 244,00 0,000 0 9114 12,84 10,47 1,00 7,00 10,00 16,00 149,00 VALUE 1 524 0,01 0,05 -0,10 -0,03 0,00 0,04 0,24 0,000 0 9114 -0,01 0,05 -0,11 -0,04 -0,01 0,02 0,18
citations, family size and claims, indicating a positively skewed distribution. The number of renewals is not affected by outliers as it only goes over the 20 years of statutory life of the patents. Also, the age patents reach is censored for applications filed less than twenty years before the data were collected (Van Zeebroeck, 2011). Comparing the groups, we notice that the
19The Fligner Policello robust rank-order test compares the medians of two independent groups which under
the null hypothesis are assumed to be sampled from the same population. It is particularly suitable for non-normal populations because it is less restrictive that the Mann-Whitney-Wilcoxon test, as it does not assume normality, equal variance or equal shape.
medians for the QAI patents are significantly higher for all indicators except for the family size. To better interpret this outcome, it should be pointed out that we set an explicit requirement on the breadth of control patents’ families by considering only USPTO filed applications. Also, jurisdictions vary in terms of market size and they should not be considered equally relevant (Van Zeebroeck, 2011).
2.6.2
ROC curve approach
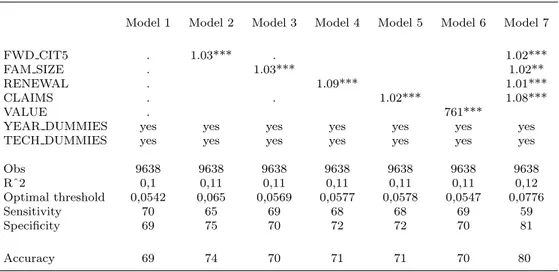
We run different logit models to test the effect of each patent based indicator on the probability of a patent to be a commercially successful breakthrough. The coefficients are positive and
Table 2.5: Empirical estimates, coefficients are odds ratios
Model 1 Model 2 Model 3 Model 4 Model 5 Model 6 Model 7 FWD CIT5 . 1.03*** . 1.02***
FAM SIZE . 1.03*** 1.02**
RENEWAL . 1.09*** 1.01***
CLAIMS . . 1.02*** 1.08***
VALUE . 761***
YEAR DUMMIES yes yes yes yes yes yes yes TECH DUMMIES yes yes yes yes yes yes yes Obs 9638 9638 9638 9638 9638 9638 9638 Rˆ2 0,1 0,11 0,11 0,11 0,11 0,11 0,12 Optimal threshold 0,0542 0,065 0,0569 0,0577 0,0578 0,0547 0,0776 Sensitivity 70 65 69 68 68 69 59 Specificity 69 75 70 72 72 70 81 Accuracy 69 74 70 71 71 70 80
a. *** (**, *) indicate a significance level of 1% (5%, 10%).
b. Sensitivity: % of true positive case which are classified as positive. c. Specificity: % of true negative cases which are classified as negative.
significant for all patent indicators in the seven specification we defined. However, the models’ discriminatory power varies: a ROC curve approach would select M7 as the most accurate model, with 80% of the patents correctly classified. Maximising specificity and sensitivity with equal weight, M7 classifies a patent as a 1 if its probability of being a QAI winning patent is above 7.7%. This cut off is rather low because of the strong presence of control patents in the sample (more than 90%). Indeed, the level of accuracy is heavily driven by the ability of the model to classify the zeros. Accordingly, M7 shows a relatively high level of specificity at the optimal threshold. For these reasons, the model may perform poorly when it comes to the
identification of breakthrough innovations out-of-sample.
2.6.3
DCA approach
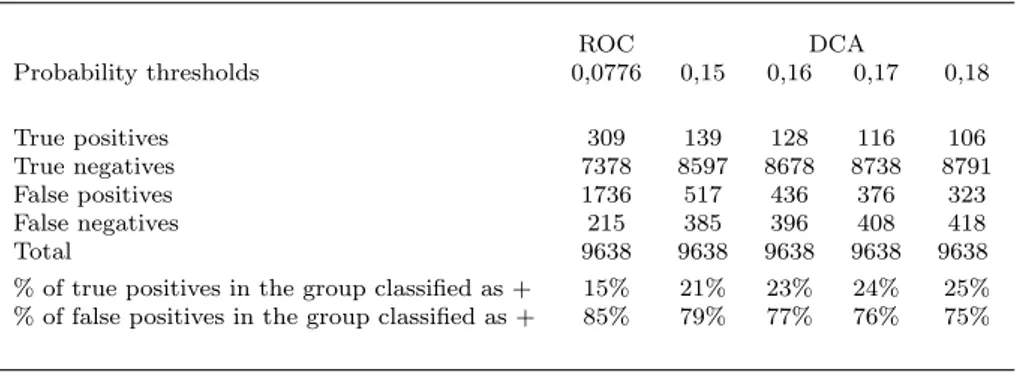
Given the very small share of QAI patents in the sample (5.5%), suppose that we would classify a patent as 1 if its probability of being a QAI patent is at least 15%. Figure 2.1 shows the decision curves for each model. The x axis is the threshold probability [0-1] while the y axis
Figure 2.1: Decision curves
is the net benefit, which indicates the percentage of true positive cases that a model captures at different probability thresholds. At each threshold probability, the model leading to the highest net benefit is the best. Looking at the y axis, we can observe that the highest possible net benefit is the true prevalence of QAI patents in the sample. For example, identifying breakthroughs using a model that at a certain probability threshold achieves a net benefit of 2% (0.02), is equivalent to a strategy which correctly picks 2,000 breakthroughs out of 100,000 patents. Note that this graph does not give any information about the number of false negatives
and false positives. 20
Considering the models we are testing, since the predicted probability is very skewed, we observe that as the threshold probability rises, we assign 1 to less and less patents, and the share of true positives that we capture tails off to zero. Instead, if we set the threshold probability to zero, the net benefit reached by the models approaches the prevalence. In general, the models we are testing achieve a higher or equal net benefit at each probability threshold, compared to the baseline strategies. At this point, we should identify a suitable range of threshold probabilities and select the best model. Figure 1 shows that beyond 20% the net benefit is very low and we risk to miss out too many breakthroughs. Instead, for values lower than 0.1, the net benefit increases but the risk of including a high number of false positive increases too. Figure 2.2 presents a closer look on this interval.
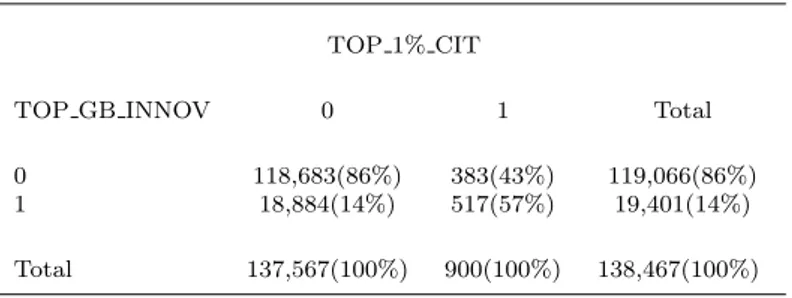
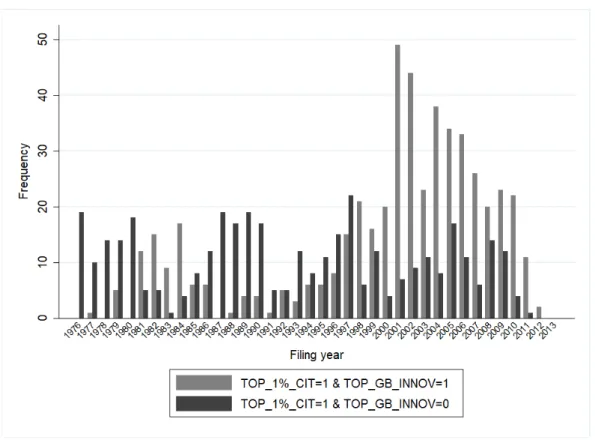
We can observe that M7 performs better than the other models for probability thresholds ranging from 12% to 18%. To have a better sense of the outcome, we calculate the prevalence of false positive and false negative for pt=.15, pt=.16, pt=17, and pt=.18. Table 2.6 shows the logit estimates for these threshold probabilities. As pt increases, the group of patents classified as breakthroughs becomes smaller and the share of false positive decreases. Opting for a conservative approach, we choose M7 setting pt=.18 to identify the commercial breakthroughs in the full sample. The summary statistic of the predicted probability P ALL is reported in Table 2.7. The distribution appears to be very skewed and a threshold of 0.18 seems to be reasonable if we want to capture the top percentiles. Accordingly, we define a new variable TOP GB INNOV which takes value 1 if P ALL>=.18, 0 otherwise. This method classifies 14% of the patents in the full sample as TOP GB INNOV. In the next section we describe the composition of this sub-sample and we provide relevant robustness checks on the effectiveness of the selection procedure.
20The decision curve analysis enables us to compare the performance of the models vis-`a-vis the two baseline
strategies of ‘pick all’, or ‘pick none’. The horizontal line (pick none) corresponds to a strategy in which we assume that there are no breakthroughs in the sample. In this case, the net benefit would be zero, regardless of the probability threshold. Conversely, a ‘pick all’ strategy assumes that all the innovation in the dataset are breakthroughs. This approach has a performance which is comparable with the models only if we set pt=0, that is if we do not attach any harm to the inclusion of false positive, while we are 100% committed to avoid false negative. In this case, the intercept point on the y axis is 5.5%, i.e. the QAI patents’ prevalence. If we assign 1 to every patent in the dataset, than 5.5% will be true 1s, hence the net benefit, with 94.5% false positive rate.