statistical physics perspectives
Scuola di dottorato Vito Volterra
Dottorato di Ricerca in Fisica – XXXII Ciclo
Candidate Mattia Miotto ID number 1454204
Thesis Advisor
Prof. Andrea De Martino
Thesis defended on 21 January 2020
in front of a Board of Examiners composed by: Prof. Andrea Crisanti (chairman)
Prof. Antonio Celani Prof. Martin Weigt
Heterogeneity and noise in living systems: statistical physics perspectives Ph.D. thesis. Sapienza – University of Rome
© 2019 Mattia Miotto. All rights reserved
This thesis has been typeset by LATEX and the Sapthesis class.
Version: 21 January 2020
Abstract
Even the most distracted observer could hardly miss noticing the extensive hetero-geneity of traits and behaviors displayed by living systems. So great a variability is commonly ascribed to differences at the level of the genome, which originated from the evolution process to adapt the organisms to the different environments they live in. However, phenotypic heterogeneity is found even in genetically identical organisms, from monoclonal cellular populations to human twins. The multitude of microscopic causes that sum up to give such variability is commonly referred to as biological noise, coming both in the form of environmental fluctuations affecting the development of individual organisms (extrinsic noise) and as the unavoidable results of stochasticity at the level of molecular reaction (intrinsic noise). The latter persisting even when genetically identical organisms are kept under nearly identical conditions.
For quite a long time, such fluctuations were considered a nuisance that makes experiments just difficult to interpret, needing to enlarge the number of observations to have reliable outcomes, and from the point of view of cells, a disturbance cells need to deal with. In the last two decades, however, experimental progresses allowed to investigate the system at single-cell scale. The emerging view is that noise under some circumstances can have a beneficial role, like promoting survival to adverse environments or enhancing differentiation. Ultimately, evolution tunes the systems so they can take advantage of natural stochastic fluctuations. We will follow noise and fluctuation from the cellular level to the higher level of organization of the cellular population where heterogeneity in the molecular reactions translate in the variability of phenotypes. Biology is very broad though, and noise affects all biological processes. Time restraint and my limited knowledge of biological systems did not allow for an exhaustive discussion of all the aspects in which noise and the subsequent heterogeneity play a role. Instead, we will focus on the regulation of noise. More in details, the first part of the thesis introduces to the impact of noise on gene expression and the regulation mechanisms cells use to control it. The action of large regulatory networks is to coordinate a huge of number molecular interactions to obtain robust system-level outcomes. This capability can emerge even when individual interactions are weak and/or strongly heterogeneous. This is the case of post-transcriptional regulation driven by microRNAs (miRNAs). microRNAs are small non-coding RNA molecules able to regulate gene expression at the post-transcriptional level by repressing target RNA molecules. It has been found that such regulation may lead the system to bimodal distributions in the expression of the target mRNA, usually fingerprint of the presence of two distinct phenotypes. Moreover, the nature of the interaction between miRNAs and their targets gives rise to a complex network of miRNAs interacting with several mRNA targets. Such targets may then cross-regulate each other in an indirect miRNA-mediated manner. This effect, called ‘competing endogenous RNA (ceRNA) effect’, despite being typically weak, has been found to possess remarkable properties in the presence of extrinsic noise, where fluctuations affect all the components of the system. We will discuss crosstalk and illustrate how crosstalk patterns are enhanced by both transcriptional and kinetic heterogeneities and achieve high intensities even for RNAs that are not co-regulated.
vi
Moreover, we will see that crosstalk patterns are significantly non-local, i.e. correlate weakly with miRNA-RNA interaction parameters. Since these features appear to be encoded in the network’s topology this suggests that such crosstalk is tunable by natural selection.
Moving at the cellular level, we focus on the outcomes of gene expression, i.e. the observable phenotypes. Depending on the degree of regulation the cell manages to exert with respect to noise, the distribution of those phenotypes will display a certain extent of heterogeneity. Such cell-to-cell variability is found to have many implications especially for the growth of the whole population. In the second part of the thesis, we discuss some properties of those heterogeneous distributions. First, we focus on the dependence on the initial conditions for the different phases of growth, i.e. the adaptive phase and exponential growth phase. Since cellular populations grow in an exponential fashion, the size and composition of the inoculum shall matter. We discuss this following a novel extensive experimental investigation recently done on cancer cell lines in a controlled environment.
Finally, we focus on the effects that a heterogeneous phenotype has on the growth in hostile environments, i.e. environments fluctuating between states in which the growth is favored and others where growth is inhibited. In such a case, if cells can only replicate (by exploiting available resources) and modify their phenotype within a given landscape (thereby exploring novel configurations), an exploration-exploitation trade-off is established, whose specifics depend on the statistics of the environment. The phenotypic distribution corresponding to maximum population fitness requires a non-zero exploration rate when the magnitude of environmental fluctuations changes randomly over time, while a purely exploitative strategy turns out to be optimal in periodic two-state environments. Most notably, the key parameter overseeing the trade-off is linked to the amount of regulation cells can exert.
Acknowledgments
I would like to thank Andrea De Martino for his help when I most needed it and for having directed my research efforts with patience and essential advice.
Thanks to Giancarlo Ruocco.
Thanks to Edoardo Milanetti, Pier Paolo Olimpieri, Lorenzo Di Rienzo, and Francesco Ambrosetti.
Thanks to Chiara Enrico Bena, Marco Del Giudice, Carla Bosia and Thomas Gueu-dre’ for having made the time I spent in Torino fruitful and enjoyable.
Thanks to Lorenzo Monacelli for having shared many hours of study and work, making them lighter.
Finally, grateful thanks to my mother and my father for their support, advice, and trust in me. Thanks to Elena for always bringing me fun, happiness, and love.
Contents
1 Introduction and thesis outline 1
2 Regulation of gene expression 5
2.1 Noise in gene expression . . . 6
2.2 The role of miRNA . . . 7
2.2.1 The ceRNA hypothesis . . . 7
2.3 Modelling post-transcriptional regulatory networks . . . 10
2.3.1 RNA regimes . . . 13
3 Molecular crosstalk 17 3.1 Measuring crosstalk . . . 18
3.2 Crosstalk at system level . . . 27
3.2.1 Probing CLASH crosstalk . . . 30
3.2.2 Crosstalk asymmetry . . . 36
3.3 Transcriptional noise processing . . . 39
3.3.1 Tradeoff between crosstalk and noise buffering . . . 41
3.4 Experimental validation of crosstalk . . . 41
4 Phenotypic diversity 45 4.0.1 Maximum entropy distributions . . . 46
4.0.2 A dynamical model of population growth . . . 48
5 Population growth and survival 53 5.1 Phases of the cellular growth . . . 54
5.2 The inoculum size influences the growth . . . 57
5.2.1 Inoculum size effects on Lag phase . . . 58
5.2.2 Inoculum effect of the population fitness . . . 61
5.2.3 Memory and cooperation . . . 63
5.3 Growth in a changing enviroment . . . 65
5.3.1 Phenotypic distributions and fitness . . . 69
5.3.2 Exploitation limit . . . 70
5.3.3 Exploration limit . . . 73
5.3.4 Fitness and regulation . . . 74
5.3.5 Exploration-exploitation trade-off . . . 76
5.3.6 Biological bet-hedging . . . 78
x Contents
A Susceptibilities calculation 85
B Degree-preserving randomization 87
C Approximated phenotypic distribution 89
List of Figures
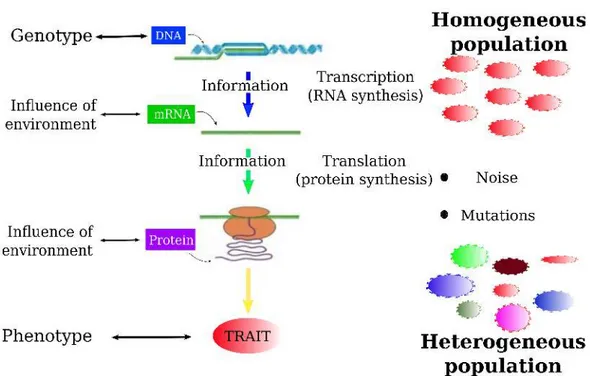
1.1 Representation of the genomic flow of information. Living systems can be regarded as information-flow systems in which the genetic information, stored in the DNA, must be passed on to the phenotype, that is the ensemble of characteristics displayed by an organism within a certain environment [1]. The genetic information is transmitted through a cascade of bio-chemical reactions. From DNA is produced mRNA, mRNAs are converted into proteins. Proteins, constituting the molecular machinery of the cell, build up all the traits that constitute the phenotype, such as the shape, dimension, the motility of a cell. If the transmission of information would be totally efficient, all cells sharing the same DNA should have identical phenotypes, i.e. we should have a homogeneous population of cells. However, at almost every step of these cascades, both the environment and the limited number of molecules involved in the reactions intro-duce noise. Consequently, the output has some noise and populations manifest a certain level of heterogeneity. . . 3 2.1 miRNA biogenesis and target binding. Adapted from [2]. . . . 9 2.2 Summary of the features of a miRNA-RNA network. (a)
Sketch of an interaction network formed by miRNAs and their targets (ceRNAs). The network is a weighted bipartite graph. Line thickness is proportional to the coupling strength (i.e. to the miRNA-ceRNA binding affinity). (b) Sketch of the individual processes lumped in each interaction represented in (a). (c) Sketch of the behavior of the level of free targets (ceRNA or miRNA) as a function of the level of free regulators (miRNA or ceRNA, respectively). Adapted from [3]. . 11 2.3 Steady-state concentrations in a system with 2 ceRNAs,
ob-tained by fixing all parameters but the transcription rate b1
of ceRNA 1. The dynamical range of the cross-talk interaction
be-tween the two ceRNAs corresponds to the window where the fraction of free and bound molecules (φ) are similar, i.e., to the S-regime. Adapted from [4]. . . 14 3.1 Sketch of the ceRNA mechanism: competition to bind a
miRNA can induce an effective positive coupling between its targets. Adapted from [3]. . . 18
xii List of Figures 3.2 Susceptibilities χij in a system of 4 ceRNAs, as a function
of miRNA transcription rate β. (All other parameters being
fixed). In this example, ceRNAs are cast in two groups: group A, formed by ceRNAs m1 and m3, and group B, formed by ceRNAs
m2 and m4. ceRNAs belonging to the same group share identical
kinetic parameters. In particular, µ0
1= µ03 << µ02= µ04. For β smaller
than ∼ 500, no cross-talk is observed; however, as β increases, a symmetric interaction between ceRNAs in group A (of magnitude comparable to the self-susceptibilities) appears. As β increases further, this interaction is switched off, and ceRNAs in group B begin to cross-talk instead. In this region, a change of transcription of a ceRNA in group A can affect the level of ceRNAs in group B, but not viceversa (asymmetric cross-talk). Finally, for sufficiently large β, no cross-talk
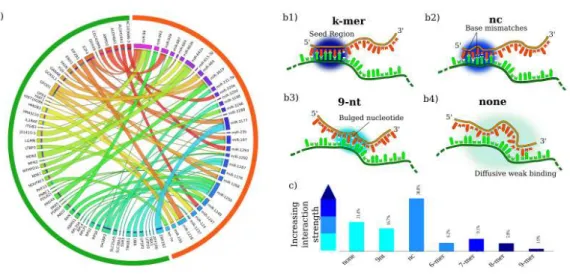
takes place. Adapted from [4]. . . 21 3.3 Real (CLASH) network features. (a) Circular representation of
a small part of the CLASH network. RNA species can crosstalk via miRNA-mediated effective interactions. Crosstalk can be established also between RNAs that do not share a miRNA regulator thanks to chains of mediated couplings. (b1-b4) Classes of miRNA-RNA interactions proposed by [5]: (b1) perfect k-base-pairing in the seed region (‘k-mer’ mode); (b2) seed base-pairing with up to one mismatched or bulged nucleotide (non-canonical mode or ‘seed-nc’); (b3) non-seed base pairing with bulged and/or mismatched nucleotides (‘noseed-9nt’ mode); (b4) non-seed binding within weak diffuse regions (‘noseed’ mode). (c) Frequency of each binding mode in the CLASH
dataset (from [5]). . . 24 3.4 Comparison between CLIP and CLASH experimental
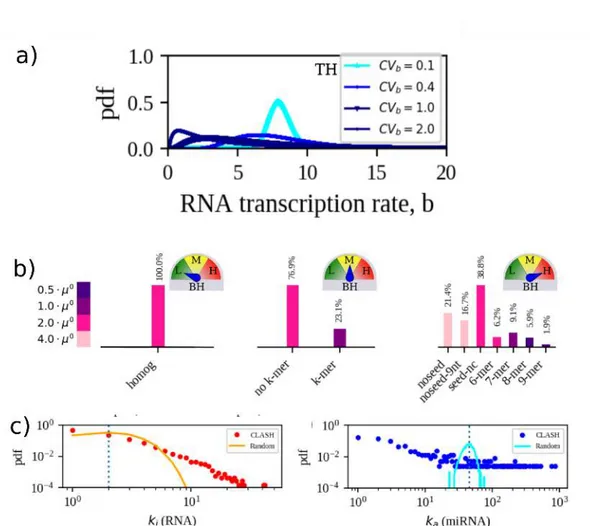
pro-tocol. . . . 28 3.5 Modeling heterogeneities.( a) Distributions of RNA transcription
rates used in this work: each rate is assumed to be drawn indepen-dently from a log normal distribution with given mean (same for each RNA species). Increased transcriptional heterogeneity (TH) corresponds to increased values of the relative fluctuations (CVb).
(b) Scenarios of miRNA-RNA binding heterogeneity (BH). From left to right: low BH, where each miRNA-RNA pair interacts with the same strength; medium BH, with k-mer interactions (stronger) dis-tinguished from the rest (weaker); high BH, where the full structure is employed. c) CLASH ceRNA and miRNA degree distributions in the CLASH network and in a randomized version having the same number of contacts and node degrees. Adapted from [6]. . . 29
3.6 Relative overall molecular abundances in CLASH (a) and
degree-preserving randomized networks (b). Note that the
susceptible regime in the latter is narrower compared to the original CLASH network. Adapted from [6]. . . 30
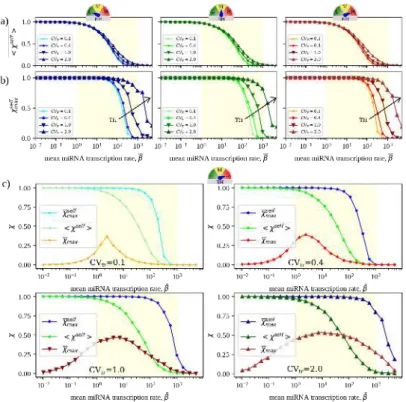
3.7 Quantitative characteristics of RNA crosstalk in the CLASH
network. (a)Representative distributions of susceptibilities obtained for the CLASH interactome for five different realizations of parameters with different values of ¯β, CVtr = 0.4 and maximal BH. (b) Mean
susceptibility as a function of the overall miRNA mean transcription rate hβi in the 3 scenarios considered for binding heterogeneity. (c) Maximal susceptibility as a function of the overall miRNA mean transcription rate hβi in the 3 scenarios considered for binding het-erogeneity. The yellow shaded area marks the region where the mean susceptibility is significantly different from zero (which coincides with the susceptible regime). Displayed curve points have a Standard Error of the Mean (SEM) comparable to the size of the markers. Adapted from [6]. . . 31
3.8 Crosstalk in CLASH and random network. (a) Mean suscep-tibility as a function of the overall miRNA mean transcription rate hβi. (b) Maximal susceptibility as a function of the overall miRNA mean transcription rate hβi. The yellow shaded area marks the re-gion where the mean susceptibility is significantly different from zero (which coincides with the susceptible regime). Displayed curve points have a Standard Error of the Mean (SEM) comparable to the size of the markers. Adapted from [6]. . . 32
3.9 Self and cross-susceptibilities. (a) Mean self-susceptibility as a function of the mean miRNA transcription rate ¯β. (b) Mean maximal
self-susceptibility as a function of the mean miRNA transcription rate ¯β. Results are shown for the 3 BH scenarios considered. The
yellow shaded area qualitatively marks the region where the mean susceptibility is significantly different from zero, which coincides with the susceptible regime. In each case, the standard error of the mean is equal to or smaller than the size of the markers. The self-susceptibility is maximal when miRNA levels are low, in which case the availability of free RNA molecules increases roughly linearly with the transcription rate. As ¯β increases, miRNA repression gets
stronger and self-susceptibilities decrease until, at large enough ¯β,
RNAs are fully repressed and therefore insensitive to small changes in their transcription rates. (c) Comparison between maximum self-susceptibility , mean self-self-susceptibility and χmax for different degrees of TH in the high BH scenario. The intensity of crosstalk between different RNAs, measured by the latter quantity, is indeed of the same order of magnitude as self-susceptibilities. Adapted from [6]. . . 33
xiv List of Figures 3.10 Crosstalk selectivity in CLASH network. Inverse of incoming
(S−1
in on left column) and outgoing (Sout−1 on right column) selectivities
as a function of miRNA mean transcription rate, ¯β. The inverses
of Sin and Sout give a proxy of the number of mRNAs receiving
or propagating the effects of a perturbation. CLASH network is very selective until the susceptible region is reached, i.e. both the number of nodes whose variation influences a given mRNA and the number of nodes that are influenced by variation of a certain node is very low. Upon reaching the susceptible threshold the network starts cross-talk and the number of nodes involved in perturbations drastically increases. The random network presents a lower selectivity with respect to real and reshuffled ones, with a peak of cross-talk in the susceptible region. Adapted from [6]. . . 35 3.11 Measure of RNA asymmetry (a) and (b) CLASH and random
asymmetries values, ∆, as a function of the overall miRNA mean transcription rate hβi in the 3 scenarios considered for binding het-erogeneity. The yellow shaded area marks the region where the mean susceptibility is significantly different from zero (which coincides with the susceptible regime). Displayed curve points have a Standard Error of the Mean (SEM) comparable to the size of the markers. Adapted from [6]. . . 37 3.12 Degree of cross-talk localization (ρ) as a function of β. a)
CLASH network ρ for different values of transcriptional heterogeneity at fixed (high) BH. b) CLASH network ρ for different values of binding heterogeneity at fixed TH. c) Cross-talk localization for CLASH and random network. Adapted from [6]. . . 38 3.13 Robustness of expression profiles from the CLASH
interac-tome in the presence of crosstalk. (a)Coefficient of Variation
(CV ) of RNA levels as a function of the overall mean miRNA tran-scription rate ¯β for different degrees of TH. (b) Behaviour of the CV
as a function of ¯β in different BH scenarios in a given TH scenario
(CV tr = 0.4). (c) Comparison between the rescaled normalized max-imal susceptibility χmax (varying between 0 and 1) and the rescaled
normalized Coefficient of Variation as a function of the overall mean miRNA transcription rate Κ in a given CV for different degrees of TH (CVtr = 0.4) and BH (high) scenario. (d) χmaxvs CV transcriptional
heterogeneity (CV tr ) and high BH. Results are obtained by averag-ing over 100 independent TH realizations. In each case the standard error of the mean is equal to or smaller than the size of the markers. Adapted from [6]. . . 40 4.1 Growth rate distributions for a uniform sampling of E. coli’s
genome-scale metabolic network in a glucose-limited medium.
4.2 Empirical growth rate distributions (markers), together with
the best fitting MaxEnt distributions (dashed lines in both panels) and the distributions derived from the dynamical model (straight lines in both panels). Adapted from [7]. . . 48
4.3 Results from the minimal population dynamical model. a) Time-evolution of p(λ). b) Stationary growth rate distributions obtained for different values of σ = D/λ3
max. c) Stationary mean
growth rate hλi as a function of σ. Adapted from [7]. . . . 51 5.1 Cartoons representative for the analysis of the logistic growth
model. a)The solution of the logistic model plotted as the logarithm
of the population size as a function of time. The initial condition is given by the initial population size N0. b) Mapping of the punctual
growth rate (dN/dt) vs population size (N). c) Maximum growth rate (λmax) calculated as the derivative in time t = 0 of growth curves
obtained by the model with different initial conditions plotted as function of N0. In all the three plots the carrying capacity level (k)
is emphasized by a dashed black line. . . 57 5.2 Batch experiment protocol and results. From left to right,
from a flask with cells growing exponentially in their standard growth medium, at time t = 0 h, samples of N0 cells have been taken and
moved into new dishes supplied with the very same nutrient quality present in the flask. From time t = 0 on the growth was monitored through automatic cell counting and growth curves similar to the one on the very right have been obtained. . . 58 5.3 Sketch of the lag time model. a) Cartoon summarizing the
model. At the population level, a population of N0 cells (light blue
dots in the top-left circle) needs a time tlag before starting to grow
exponentially over time. The same dynamics is valid at the single-cell level, where each single cell i starts after a time τi to give birth to
sub-colonies whose sizes grow exponentially over time. b) Schematic representation of the two possible scenarios for the population lag time. The Gaussian statistic scenario (in blue) and the extreme-values one (in red). This second case has been obtained considering a uniform
distribution for the τis. . . 60
5.4 Experimental lag times. a) Experimental lag times as a function of the initial seeding (N0 ). Lighter color dots are experimental data
obtained through the fit. Their error bars are the error on the fit. The darkest red dots are the average of the smaller dots binned over
N0. b) Standard deviation of the averaged values (dark red dots)
of plot (a). In both plots the vertical dashed lines are located in correspondence of the carrying capacity value, k. . . . 61
xvi List of Figures 5.5 Experimental growth curves and growth rates. a) Example
of a growth curve as a function of time. b) Experimental growth rates as a function of the initial seeding (N0 ). Lighter color dots
are experimental data obtained through the fit. Their error bars are the error on the fit. The darkest red dots are the average of the smaller dots binned over N0. In both plots the vertical dashed lines
are located in correspondence of the carrying capacity value k. . . . 61 5.6 Representations of the growth rate (dN/dt) of a population
of size N as a function of its size. a) Trends for logistic growth
(blue solid line), weak (green) and strong (yellow) Allee effect. The value k corresponds to the carrying capacity. b) Examples of weak Allee effects with different values of parameter α that increases ac-cording to the arrow. The blue curve is the logistic case with α = 0. The dashed black line represents the carrying capacity k. . . . 64 5.7 Experimental data and model comparison. Fit of the logistic
(orange), weak Allee (blue) and modified logistic (red) models. . . . 65 5.8 Outcomes of the modified logistic model with uniform noise
on a and b. . . . 66
5.9 Putative validation of the modified logistic model. a) Max-imum growth rate as a function of N0 for different values of the
carrying capacity and r(N0) ∼ a(N0)b. b) Maximum growth rate
as a function of N0 for different values of the carrying capacity and
r(N0) ∼ a(ln N0)b. . . 66
5.10 Representative behavior of the threshold x as a function
of time in the different environments.(a) a periodic two-state environment where x switches (in this case) between the values λmax
and xmin = λmax/2; (b) a periodically switching environment where x
takes on random values drawn uniformly from [xmin, λmax]; (c) a
two-state environment where switches occur at exponentially distributed random times; (d) an environment where x behaves as in (b) but in which switches occur at exponentially distributed random times. In this example, the characteristic switching times ωns and ωs are taken
to be equal and fixed to 40 (a.u.). Adapted from [8]. . . 68 5.11 Colormaps showing representative probability densities p(λ, t).
Panels to the right of each map depict the density profile at different time points within the zoomed-in region, at time increasing from top to bottom. Results are shown for a) const-t and const-x environment,
b)const-t and rand-x environment, c) rand-t and const-x environ-ment, and d) rand-t and rand-x environment. Parameter values:
5.12 Growth without phenotypic diffusion. (a and b)Long-time phenotypic distributions (left) and time evolution of the population growth rate Λ (right) in the absence of diffusion in the different environments (represented by different colors and line widths) and for
x = 0.3λmax (panel (a)) and x = 0.7λmax(panel (b)). In the former
case (x < λmax/2), the distribution can achieve the highest possible
CGR. In turn, the long term fitness Λ sets around λmax/2. In the
latter case (x > λmax/2), the distribution peaks around the threshold
CGR, while the population achieves a growth rate Λ larger than
λmax/2. (c) Time-averaged f as a function of the CGR for const-x
(left) and rand-x (right) environments and for three different values of xmin. One sees that the position of the maximum depends both
on the chosen threshold and on the specific environment. Adapted from [8]. . . 71
5.13 Phenotypic distributions and fitness in a symmetric
envi-ronment. a,b)Asymptotic, time-averaged phenotypic distributions obtained for a population evolving with a diffusive kernel in a uniform background phenotypic landscape (a = 0). c) Asymptotic population growth rate Λ (in units of λmax) as a function of D for the four types
of environment. Vertical dotted lines mark the values of diffusion studied in panels (a) and (b). Horizontal lines at small and large
D stand for the analytical estimates for the fitness obtained in the
const-x regime (dotted blue line) and the rand-x regime, respectively.
d-f) Same as a-c but with q(λ) with a = 20 rather than uniform.
Adapted from [8]. . . 75
5.14 Phenotypic distributions and fitness in an asymmetric
envi-ronment: bet-hedging. a)Asymptotic, time-averaged phenotypic distributions (top panels) and asymptotic population growth rate Λ (in units of λmax) as a function of D (bottom panel) obtained as in
Fig. 5.12d-f but in the presence of an asymmetric environment with characteristic switching times ωs= 30 and ωns= 50 time units. Blue
and green horizontal lines at small and large D show the analytical estimates of Λ in the exploration and exploitation limits, obtained in the const-x and rand-x regimes, respectively. Grey horizontal lines represent the same analytical estimates but in the presence of a sym-metric environment with ωns = ωs= 40 time units. (b to d) Same
as (a) but with different choices of ωns and ωs. Displayed curves are
averaged over 100 independent realizations of the dynamics. Adapted from [8]. . . 77
xviii List of Figures B.1 Comparison between crosstalk patterns in the CLASH
net-work and its edge-swapped randomized versions. a)
Fre-quency of the shortest paths for CLASH (left) and edge-swapped (right) networks. b-c) Degree distributions of RNA (top) and miRNA (bottom) nodes in the CLASH and edge-swapped networks. d-g) Global crosstalk descriptors for the CLASH and edge-swapped net-works as a function of the mean miRNA transcription rate β: (d) mean susceptibility; (e) mean maximum susceptibility; (f) Pearson correlation coefficient between susceptibilities and local kinetic pa-rameters; (g) Coefficient of variation of RNA levels. Adapted from [6].
. . . 88 C.1 Cartoon representation of the evolution of the distribution. 90
List of Tables
Chapter 1
Introduction and thesis outline
All the relevant information to build, sustain and replicate cells, the building blocks of life, is safely stored in the DNA molecule and constitutes the genotype of cells. For this information to be converted into observable traits, or phenotypes, it needs to be first transcribed into an intermediate molecule (RNA) and then translated into proteins. This flow of information, commonly referred to as the central dogma of the biology, involves many cascades of molecular reactions [1]. From the binding of transcription factors to particular loci of the DNA molecules, which initiate the transcription, to the action of ribosomes in translation and to the novel post-transcriptional layer of regulation constituted by micro-RNA molecules. The result is a complex network of interactions between molecules whose energies are often just a few times the thermal energy. In fact, along with strong interactions, such as covalent bonds, that guarantee the stability of molecules, weak molecular interactions (electrostatic, hydrophobic, van der Waals) stand, having typical energies falling in the kBT energy range. Being in the level of thermal noise fluctuations, they havea transitory nature which renders possible for the same molecule to take part in many reactions. The contrappasso for this is that an often not negligible amount of ‘noise’ is introduced in all biological processes [9, 10, 11]. Speaking of noise in biological systems requires particular care, in fact under the noise umbrella term, a lot of different processes and scenarios are considered. The basic idea is that we regard as sources of noise all the mechanisms and processes that introduce variability in the parameters of the system under investigation that we do not want/cannot consider. As much as we speak of thermal noise leading the Brownian motion of a power grain, instead of considering the multitude of interaction between the grain and the water molecules [12].
In practice, biological noise is usually divided into two contributions, an intrinsic component, due to the stochasticity of the biochemical processes in the system, and an extrinsic one, related to the coupling with the variability of the environment in which reactions take place. The functional roles of those noises in biological processes are very diverse. Along with expected entropy-increasing effects of limiting robustness, fidelity and channel capacity in signaling, under some circumstances, it plays more constructive roles, like accelerating the pace of evolution, increasing the fitness of the population in a dynamic environment (bet-hedging) and promoting heterogeneity [13]. Still, if not controlled, randomness may pose more damage
2 1. Introduction and thesis outline than benefit. Therefore biology had to evolve a number of strategies to cope with fluctuations. Since the relative magnitude of fluctuations in molecule numbers (N) is expected to scale as ∼ √1
N, a direct solution to decrease noise is to increase
the copy numbers. While this is possible for some processes, in general, spatial and energetic constraints go against this solution. An alternative, less trivial way of confronting noise is to use regulatory systems that can either suppress the noise or redirect perturbations. Overall, although living cells are a crowded spatially heterogeneous space which contains lots of different biomolecules whose concentrations and activities are subject to intrinsically random forces, from this randomness a vast array of precisely timed and intricately coordinated biological functions emerge. This seemingly paradoxical nature of life has drawn the interest of an increasing number of physicists, whose expertise contributed to disentangle the scenario of microscopic processes, experimental advances allow to probe in ever more details [14]. With all this in mind, along this thesis, we will try and see how physics, and in particular statistical physics tools can help to shed light on the effect of noise and the role of the subsequent heterogeneity in some key examples. More specifically:
In Chapter 2, we begin with the discussion of fluctuations at the cellular level, and in particular in gene expression, where stochasticity is mitigated by post-transcriptional regulation channels, that were optimized by evolution to stabilize the output protein levels. In particular, noise processing is thought to be the key function, miRNAs) exert in regulation. After an overview of the role of miRNAs as ‘micromanagers’ of gene expression, we will introduce the ceRNA effect and see how
miRNA-RNA networks can be modeled.
In Chapter 3, we see how measuring the response of the system to specimen perturbation permits to grasp effective interactions between distant RNA molecules mediated by miRNAs. First, we explain the feature of such crosstalk in simplified cases of study and then we focus our attention on an experimentally validated large scale network and explore its features both with respect to its capability of processing the extrinsic noise on transcription and establish extended crosstalks, which are enhanced by heterogeneities and shaped by evolution.
In Chapter 4, we discuss the emergence of heterogeneous distributions of pheno-type from considerations on the metabolic activity. In particular, we will see how both a maximum entropy scenario and a minimal dynamical model yield experimen-tally observed distributions that are ultimately dictated by the degree of regulation cells can attain over noise.
In Chapter 5, we definitively leave the molecular level moving forward to consider the growth of cellular populations. Here, heterogeneity in phenotypes like the lag time or the growth rate will be found to influence the fitness of the population in the presence of a controlled environment. In particular, we will describe an experimental setup that allowed to measure the growth rate of a cellular population which grows starting from different initial inoculum sizes. We will find that the fitness of those populations manifests non trivial features and minimal theoretical models manage to account for such characteristics. We will then devote the discussion to the problem of cell adaptability to hostile environments. In particular, in populations of bacteria or cancer cells facing variable and often unpredictable environmental changes, variability
Figure 1.1. Representation of the genomic flow of information. Living systems can be regarded as information-flow systems in which the genetic information, stored in the DNA, must be passed on to the phenotype, that is the ensemble of characteristics displayed by an organism within a certain environment [1]. The genetic information is transmitted through a cascade of bio-chemical reactions. From DNA is produced mRNA, mRNAs are converted into proteins. Proteins, constituting the molecular machinery of the cell, build up all the traits that constitute the phenotype, such as the shape, dimension, the motility of a cell. If the transmission of information would be totally efficient, all cells sharing the same DNA should have identical phenotypes, i.e. we should have a homogeneous population of cells. However, at almost every step of these cascades, both the environment and the limited number of molecules involved in the reactions introduce noise. Consequently, the output has some noise and populations manifest a certain level of heterogeneity.
4 1. Introduction and thesis outline increases the probability that some individuals may survive the stress produced by a sudden change of the environment. In that respect, it has been speculated that those kinds of cell populations implement a risk distribution strategy: they may have evolved to regulate not only the averaged gene expression levels but also the extent of allowed deviations from such an average, setting it at the desired level in order to face (as population) each environmental condition [15].
Part of the work described in this thesis led to the publication of three papers: 1. (2019) M. Miotto, E. Marinari, and A. De Martino, "Competing endogenous RNA crosstalk at system level", PLOS Computational Biology, 15(11):e1007474 2. (2019) A. De Martino, T. Gueudre’, and M. Miotto, "Exploration-exploitation tradeoffs dictate the optimal distributions of phenotypes for populations sub-ject to fitness fluctuations", Phys. Rev. E 99, 012417, DOI: 10.1103/Phys-RevE.99.012417
3. (2017) C. Enrico Bena, M. Del Giudice, T. Gueudre’, M. Miotto, E. Turco, A. De Martino, C. Bosia, "Inoculum-density dependent growth reveals inherent cooperative effects and stochasticity in cancer cell cultures", arXiv preprint arXiv:1710.10978
An additional paper described in 3.4 is in preparation.
The research activity conducted during this Ph.D. involved also the collaboration with other projects not described in this thesis. These collaborations led to the following publications:
1. (2019) M. Monacelli and M. Miotto, "Gene heterogeneity drives the evolution of species", arXiv preprint arXiv:1912.01444 [16]
2. (2019) M. Miotto, L. Di Rienzo, P. Corsi, G. Ruocco, D. Raimondo and E. Milanetti, "Simulated Epidemics in 3D Protein Structures to Detect Functional Properties", arXiv preprint arXiv:1906.05390 [17]
3. (2018) M. Miotto, P. P. Olimpieri, L. Di Rienzo, F. Ambrosetti, P. Corsi, R. Lepore, G. G. Tartaglia, E. Milanetti, "Insights on protein thermal stabil-ity: a graph representation of molecular interactions", Bioinformatics, DOI: 10.1093/bioinformatics/bty1011 [18]
4. (2018) M. Miotto, L. Monacelli, "Entropy evaluation sheds light on ecosystem complexity", Phys. Rev. E 98, 042402, DOI: 10.1103/PhysRevE.98.042402 [19]
Chapter 2
Regulation of gene expression
The information to assemble all the proteins an organism needs in the various stages of life is encoded in its DNA. Anyway, neither all proteins are synthesized at the same time, nor all cells employ the same proteins. Each cell produces only the proteome it needs in relation to the environmental stimuli it receives. The control of gene expression, i.e. regulation of the conversion of genetic information into proteins, is a fundamental process to bring the genome to life and mis-regulation at any level is usually associated with disease [20]. Moreover, gene expression is regulated at different levels and there is increasing evidence that the diverse processes involved in this regulation are integrated with each other [21, 22, 23, 24].The regulation mainly takes place at two levels, during transcription (the con-version of DNA into RNA) and before translation (before mRNA is turned into proteins). Furthermore, downstream of these two processes, expressed proteins can still be regulated by post-translational modifications (PTM) and protein degradation (post-translational control). Transcriptional control has received much attention, through both traditional single gene studies [25] as well as through genome-wide approaches such as expression profiling [26], transcription factor binding studies and identification of regulatory sequence elements [27], and chromatin remodeling and epigenetics [28]. Recently, there has been an increasing appreciation of the necessity and importance of post-transcriptional gene expression regulation. Post-transcriptional regulation mechanisms comprise various processes such as mRNA processing (ppolyadenylation, capping, and splicing), mRNA export and localization, mRNA decay, and mRNA translation. In particular, the regulation operated by miRNA is under much scrutiny. In fact, from 1993, year of their first observation, up to now, micro-RNAs were found to be involved in the regulation of a plethora of processes, from cellular development to proliferation, from survival to apoptosis, thus being regarded to play a central role in gene regulation both in health and disease [29]. The observation that, through a titration mechanism, miRNAs can act as mediators of effective interactions among their common targets (competing endogenous RNAs or ceRNAs) has brought forward the idea (known as ceRNA hypothesis) that RNAs can regulate each other in extended cross-talk networks. This ability is considered pivotal to shape a cell’s protein repertoire. In fact, by being able to target different RNA species with different kinetics, they can act as mediators of an effective interaction between the RNAs, such that a change
6 2. Regulation of gene expression in the transcription level of one RNA can result in an alteration of the levels of another RNA. Furthermore, the involvement of miRNAs in peculiar motifs of the post-transcriptional regulatory network suggests that they actively perform noise processing in gene expression [30]. Recent work has characterized the emergent properties of cross-talk and noise processing in small regulatory motifs in silico [4, 31]. Small motifs are however embedded in large, cell-scale networks of interactions and a strongly heterogeneous structure of targeting patterns. Perturbations could in prin-ciple propagate across this network and affect RNAs that are topologically distant through chains of miRNA-mediated couplings, creating a collective, long-range mode of regulation characterized by strong and highly selective cross-talks. In Chapter 3, we will see how to measure crosstalk and discuss its evolutionary signatures and biological consequences.
2.1
Noise in gene expression
An emerging view is that gene expression noise is not simply a necessary evil of the molecular computations of the central dogma, but is at times utilized by cells to achieve certain functions. In other words, evidence is mounting for specific physiological roles for gene expression noise [13]. For instance, stochasticity is the driving force that generates phenotypic heterogeneity in microbial populations. In fact, population heterogeneity in the expression of even one protein can have important consequences for a population of cells. For instance, [32] found that cell-to-cell variability in the expression of a single antibiotic resistant protein in Saccharomyces cerevisiae can lead to pronounced effects in the response of the whole population to an antibiotic challenge; at intermediate antibiotic concentrations, the strain with the largest phenotypic heterogeneity was best able to survive. In some instances, the effect of noise can be amplified by the presence of multi-stability in genetic networks. This can lead to multiple phenotypes coexisting in a cell population. Individual cells can make transitions between those phenotypes driven by fluctuations in the expression of certain key genes in the network [11].
An example is provided by the behavior of individual Bacillus subtilis cells when they are subject to stress; the cells must decide whether to enter a competent state or to start forming spores [33, 34]. The two phenotypes are mutually exclusive, and the decision between them is determined by transient values of the concentration of key proteins in the network, which can stochastically exceed a threshold value and thereby force the cells to assume the competence phenotype [35]. Not all gene expression noise, however, is beneficial. Some processes, such as the development of a multicellular organism, rely on precise spatial and temporal transmission of genetic information, and in these cases noise, in gene expression needs to be kept to a minimum [36]. Recent experiments have found that noise suppression mechanisms exist at the level of gene networks that control development [37]. Here, we will focus on one of the mechanisms cells evolved to process noise: the post-transcriptional regulation mediated by micro RNAs.
2.2
The role of miRNA
MiRNAs are endogenous 22 nucleotide-long noncoding RNA RNAs (ncRNAs), which play important regulatory roles in animals and plants by pairing to the messenger RNAs (mRNAs) of target genes and specifying mRNA cleavage or repression of protein synthesis [38]. Lin-4 [39, 40] and let-7 [41] were the first miRNAs to be discovered, identified studying the developmental stages of Caenorhabditis elegans ( C. elegans). It rapidly became clear that miRNAs represented novel means of regulating developmental timing. Subsequently, hundreds of non protein-coding miRNAs started being identified in many other processes. Currently, thousands of miRNAs have been identified in humans and other species, and miRNA on-line sequences repositories, such as the miRbase database [42], are available as much as miRNA-mRNA binding prediction tools like TargetScan [43]. Researchers further gained interest in miRNAs when, in 2005, the first reports addressing the biological function of miRNAs in cancer were published, showing that miRNAs act as onco-genes or tumor suppressors and are involved in a huge variety of pathways deregulated in cancer [44]. To date, altered miRNA expression has been reported in almost all types of cancer.
2.2.1 The ceRNA hypothesis
With a lot of simplification, we can state that the phenotype of an organism is set by the amount of proteins the organism possesses. The proteome of the cell is not static but can change in response to both precise internal and environmental stimuli as much as due to fluctuations. The timing of responses can be of paramount importance for cell survival, especially in the presence of adverse fluctuating environments (as we will better discuss in Chapter 5). To reorganize the proteome, cells can tune the synthesis/degradation ratios of proteins and their precursors mRNAs. In particular, once mRNA molecules are transcribed, the cell can prevent their translation onto protein increasing their decay rate or acting at the level of ribosomes, those actions though inevitably affects all mRNA species. The employment of miRNA molecules allows a more fine layer of regulation. In fact, since miRNAs can be engineered to target specif RNA molecules in specific regions, cells can repress a certain RNA by increasing the number of miRNA species that bind to that RNA.
The interesting thing is that one miRNA can bind to several (up to many hundreds) different RNAs. In fact, the canonical RNA-miRNA binding takes place through the base-pairing of 6-9 nucleotides of the seed region of the miRNA. The sole fact that the pairing involves a small number of nucleotides explains why it is not so uncommon that the same miRNA can have more than one target. Whenever a molucule binds to other different kinds of molecules and the binding provokes sequestration of the complex from the system, a competition for the binding takes place between the targets. This equals to an indirect interaction among the molecules (see Figure 3.1). In fact, a variation in the concentration of one RNA induces a variation in the levels of the miRNA molecules that bind the RNA. This variation in the miRNA will in turn influence all the other RNAs the miRNA can bind to. This crosstalk introduces a further layer of regulation, in fact not only the cell can regulate the levels of different RNAs by varying the common
8 2. Regulation of gene expression miRNA concentration. But it can act on one RNA and modify the level of other RNAs since the miRNAs propagate the perturbation. mRNAs become correlated. Therefore, looking at target concentrations (as experiments often do) it may be hard to disentangle the contribution to correlation due to competition from the more trivial one due to variations in the level of the common miRNA. Together with the great experimental effort spent in both identifying and characterizing new miRNA motifs, theoretical modeling has been pursued too. Mathematical models for ceRNA regulation have been developed by multiple groups, and include models for ceRNA co-regulation, for the effects of miRNA-target binding strength on ceRNA regulation, for the effects of the number of miRNA binding sites per ceRNA, and for the interplay between ceRNA regulation and other types of regulatory interactions [31, 4, 45]. In particular, kinetic modeling of a minimal network, in which one miRNA interacts with two competing RNAs, showed that ceRNA activity is determined by the relative abundance of ceRNAs and miRNAs as well by the type of their interaction (stoichiometric or catalytic) [46]. Further extension of the minimal model by considering interactions between multiple miRNAs and ceRNAs allowed for the characterization of mean and noise profiles of ceRNA network components and the response time of the network components required to resume their steady states upon perturbation [31]. Noorbakhsh et al. [47] studied noise characteristics within a ceRNA network composed by a miRNA, a protein-coding RNA and a non -coding RNA, showing that the noise is dramatically high when the combined transcription rate of the ceRNAs approximates the transcription rate of the miRNA (i.e. the cross-regulation of the two ceRNA happens). Later on, by integrating miRNA-mediated ceRNA crosstalk with transcription factor (TF) regulation, Martirosyan et al. [48] showed that miRNA regulation of a gene through the ceRNA network can outperform its regulation by a TF, suggesting the possible role of miRNAs as major regulators rather than fine-tuners of gene expression. While these models helped to improve our understanding of ceRNA regulation, they do not account for miRNAs that have hundreds of other targets or for ceRNA regulation by multiple shared miRNA species. Most importantly, they do not consider the effective coupling between ceRNAs that are linked by a long chain of miRNA-ceRNA interactions. Those aspects are the main topics of the following sections.
miRNA biogenesis in animals and interaction with target mRNAs
Genes coding for miRNAs can be found as autonomous units in intergenic regions of the genome [49, 50], in introns (i.e. non-coding regions inside a gene that are removed after splicing) of both protein coding and non-coding genes [51] and even in exons (i.e. regions non-coding for a portion of the mature RNA) of non-coding genes [52]. miRNA genes can also form clusters regulated by a common promoter, creating a polycistronic transcription unit [53]. The primary product of the transcription of a miRNA gene is a long transcript called pri-miRNA. Pri-miRNAs are processed in the nucleus by the enzyme Drosha, originating ∼ 100 nucleotides long miRNA precursors with a hairpin structure, called pre-miRNAs. These precursors are transferred to the cytoplasm by the protein Exportin-5, where they undergo further processing by the Dicer enzyme. This enzyme cuts the hairpin loop of the pre-miRNA, leading to a double stranded RNA (dsRNA) duplex with an imperfect match between the sequences. The duplex is then incorporated into a protein complex called RNA-induced silencing complex (RISC). Within the RISC, only one of the two strands of the miRNA is loaded, the other being released and degraded.
Figure 2.1. miRNA biogenesis and target binding. Adapted from [2]. Once loaded in the RISC, the miRNA
is ready to exert its repressive action on its target RNA, whose sequence is recognized through Watson-Crick base pairing. The canonical bind-ing mode between a miRNA and its target consists of a nearly perfect pairing with a small region, about 6 nucleotides long, contained in the 5′ end of the miRNA, the so-called
seed region [54]. Usually, the se-quence of the target complementary to the seed region is located in the 3′-UnTranslated Region (3′UTR). In
animals (plants behave quite differ-ently), the formation of the com-plex promotes translational repres-sion. Furthermore, mRNA bound to the RISC complex is subject to desta-bilization, both through direct cleav-age and through deadenylation [29]. Both processes end with the
degrada-tion of the target and the release of the RISC complex. A further route is the trapping of the complex protein granular structures, called P-body [55]. In this case, both target and miRNA are removed from the system. The seques-tration of target molecules, possibly combined to an enhanced degradation, is then at the basis of miRNA-mediated gene regulation. Computational models predict that more than 60% of human genes are targeted by miRNAs [54, 56].
10 2. Regulation of gene expression
2.3
Modelling post-transcriptional regulatory networks
To build an efficient measure of crosstalk and see how this crosstalk is influenced by heterogeneity in important features of the network, the first thing we need is a model to describe the time evolution of the miRNA and RNA concentrations. When dealing with chemical reactions, the simplest model one can build is a deterministic mass-action scenario. In particular, the whole network can be modeled as a system of coupled ordinary differential equations (ODE) for the concentration levels of free molecules and complexes.Let us consider the general case of a system composed of N RNA species {mi}Ni=1
(the ceRNAs) and M miRNA species {µa}Ma=1. Since we want to understand the basic
features of crosstalk, we focus only on miRNA and RNA molecules. Consequently, we do not take into consideration all the processes that lead to the formation of miRNA and RNA molecules nor the pathways that lead to their degradation (as discussed in the Panel ‘miRNA biogenesis in animal and interaction with target mRNAs’). We only assume that free RNA i is synthesized and degraded with rates
bi and di respectively, while free miRNA a has βa synthesis rate and δa degradation
one.
RNA and miRNA can form complexes cia with rates kia+ and complexes can
dissociate with rate k−
ia. (We neglect that in order to form a complex, miRNA
molecules must bind to the RISC). While miRNA and RNA are bound, their complex is assumed to undergo two different degradation processes, either a catalytic process in which the miRNA returns to the cytosol or a stochiometric route where both molecules are destroyed. The two different pathways the complex can take derives from biological information. In fact, it has been observed that the assembling of miRNAs in the RISC structure prevents their degradation, so that once the mRNA is processed the RISC (just the free miRNA for us) returns at disposal for binding another free mRNA. When miRNA and RNA are bound together, though, the whole complex can be sequestered by specific cellular structure-like P-bodies, resulting in effective removal of both miRNA and mRNA from the cytosol [55]. To model these two complex degradation pathways, we then call for two more rates.
σia quantifies the complexes full degradation route while κia) accounts for complex
partial degradation: the release of miRNA and destruction of RNA. The whole process can be schematize as
∅ µa bi↓ ↑ di ր κia µa + mi kiα+ −−−⇀ ↽−−− kiα– cia βa↑ ↓ δa ց σia ∅ ∅
Since molecular interactions happen only inter species, the network of interactions has a bipartite structure (see also Figure 2.2a-b). In such a scenario, equations for
1 2 3 M 1 2 3 N interaction strength miRNAs ceRNAs
∅
∅
a
i
ia
∅
bi di kia + kia — βa δa σia κiaA
B
C
(log) Free regulator level
F re e t a rg e t le ve l repressed target free target susceptible target “threshold” max/2 max
Figure 2.2. Summary of the features of a miRNA-RNA network. (a)Sketch of an interaction network formed by miRNAs and their targets (ceRNAs). The network is a weighted bipartite graph. Line thickness is proportional to the coupling strength (i.e. to the miRNA-ceRNA binding affinity). (b) Sketch of the individual processes lumped in each interaction represented in (a). (c) Sketch of the behavior of the level of free targets (ceRNA or miRNA) as a function of the level of free regulators (miRNA or ceRNA, respectively). Adapted from [3].
the time evolution of free molecules and complexes can be written as follows: ˙ [mi] = bi− di[mi] − X a k+ia[mi][µa] + X a k−ia[cia], (2.1a) ˙ [µa] = βa− δa[µa] − X i k+ia[mi][µa] + X i (k− ia+ κia)[cia], (2.1b) ˙ [cia] = kia+[mi][µa] − (kia−+ κia+ σia)[cia]. (2.1c)
where [mi] and [µa] stand for free RNA and miRNA concentrations, respectively.
This set of equations can be numerically solved once parameters and initial conditions are specified. To understand how things work, we restrain to the steady state regime of the dynamics, so that we can not concern with initial values, and have a unique set of steady state free molecule concentrations. However, transient regimes are important and crosstalk can be characterized there as well. We briefly discuss this possibility in Panel ‘Crosstalk away from stationarity’.
Imposing nil time derivative in 3.41a, steady state expressions for the concentra-tions are given by:
[mi] = bi+Pakia−[cia] di+Pak+ia[µa] , (2.2a) [µa] = βa+Pi(kia−+ κia)[cia] δa+Pik+ia[mi] , (2.2b) [cia] = kia+[mi][µa] (k− ia+ κia+ σia) . (2.2c)
12 2. Regulation of gene expression
Crosstalk away from stationarity
miRNA-ceRNA interaction strengths and silencing/sequestration mechanisms emerge, together with the relative abundance of regulators and targets, as key factors for the onset and character of ceRNA crosstalk, including its selectivity. Moreover, heterogeneities in kinetic parameters as well as in miRNA-ceRNA interaction topology are major drivers of ceRNA crosstalk in a broad range of parameter values. The picture obtained at stationarity can be extended to out-of-equilibrium regimes. In particular, one can characterize a ’dynamical’ ceRNA effect, which can be stronger than the equilibrium one, as well as the typical timescales required to reach stationary crosstalk [57].
Eliminating the complexes {cia}, the N × M + N + M steady state equations
eq. (2.2) reduce to a set of N + M coupled equations for the free concentrations of species {µa, mi}: [mi] = m⋆i 1 + Ni X a [µa] µ0ia = m⋆ iFi, (2.3a) [µa] = µ⋆a 1 + Ma X i [mi] m0 ia = µ⋆ aFa. (2.3b) in which m⋆
i = bi/di and µ⋆a = βa/δa represent the concentrations of free
compounds in the absence of inhibition; while Ma (Ni) is the number of RNA
(miRNA) that bind miRNA a (RNA i). Finally, m0
ia and µ0ia are given by:
m0ia = δa kia+ 1 + k−ia+ κia σia ! , (2.4a) µ0ia = di kia+ 1 + k−ia σia+ κia ! . (2.4b)
m0ia and µ0ia are proportional to the inverse affinity of the complex (given by the
ratio k+/k−), so they quantify the strength of the binding. Note that, put in this
form, they can be estimated by novel miRNA transfection experiments [58]. Again, we stress that this modelization represents a coarse-graining of the real biological process, in fact, it does not consider all the catalyzing intermediate steps that involve the presence of proteins and other RNA molecules, as the formation of the RISC complex. Anyway, assuming that the only rate-limiting compounds are the miRNA molecules the underlining catalytic reactions may be ignored. Despite its essentialness, this approach allows to fully characterized analytically and numeri-cally the steady state of the dynamics and consequently to precisely quantify the sensitivity of a ceRNA to alterations in the level of one of its competitors, sufficing to capture many of the central characteristics of miRNA-based regulation from basic assumptions about the underlying processes.
All reactions reported in 3.41a, i.e. transcription, degradation and titration events due to miRNA-ceRNA interactions, are intrinsically stochastic. This means in practice that molecular levels evolving in time are bound to be subject to random fluctuations, with the strength of the noise affecting each molecular species roughly proportional to the square root of its mean. After a transient, concentrations will stabilize and fluctuate around the steady state of the deterministic model. The deterministic model thereby yields a description of the miRNA-ceRNA network that is all the more accurate when the system is well mixed and concentrations are sufficiently large. In what follows, we will limit the discussion on results obtained only using the deterministic model in the steady state regime. This will allow to quantitatively measure the cross-talk between ceRNA in different parameter scenarios and to have strong analytical support. For a review on stochastic models see [3].
Parameter reduction
At the moment, the state of the system depends on 4MN + 2M + 2N parameters. While much biology is contained in each parameter and in specific situations all parameters should be accurately considered, here we want to focus on the main features of crosstalk and a reduction of the number of parameters to be explored is helpful. So, to shrink the parameter space we assume that σia = σ, κia = κ,
and di = d and δa = δ for each i and a. Furthermore, we can also suppose that
kia− << σ + κ, which equals to say that complexes are degraded faster than the time
thermal noise needs to separate the species. Under those assumptions, one gets
µ0ia= λm0iadδ for all i and a, where λ = (σ+κ)σ is the ‘stoichiometric ratio’ measuring
the relative degree of stoichiometricity of complex decay. The number of effective parameters in this case shrinks to NM + N + M + 3, namely the inverse affinities
µ0ia, the synthesis rates bi and βa, the stoichiometric ratio λ, and the rates, δ, d.
Reasonable choices for all those parameters are reported in Table 2.1. Note that inverse affinities and synthesis rates will be the source of heterogeneity whose effect we aim to characterize. For this reason, in Table 2.1 we reported typical values that in practice can vary also by orders of magnitude. Finally, since miRNA molecules are used by cells as regulators, we use the miRNA transcription rate as a control parameter upon varying which crosstalk patterns will be analyzed.
2.3.1 RNA regimes
Once a reasonable choice of parameters is done, Eq. 2.3 can be numerically solved and the concentrations of free molecules can be studied varying miRNA transcription rate. Note that since equations for the concentration of miRNA and ceRNA have the same structure, qualitative similar results are found if one looks at the mirror system, i.e. if we vary RNA transcription rates [4, 57].
Varying β on a logarithmic scale, we can see that as β increases, the concentration of free miRNA in the system increases as well, while RNA concentrations go down in a sigmoidal fashion (see Figure 2.2c).
If the levels of all miRNA species interacting with ceRNA i are sufficiently low (specifically, much lower than the respective thresholds µ0
ia, so that
P
14 2. Regulation of gene expression
Figure 2.3. Steady-state concentrations in a system with 2 ceRNAs, obtained by fixing all parameters but the transcription rate b1 of ceRNA 1. The dynamical
range of the cross-talk interaction between the two ceRNAs corresponds to the window where the fraction of free and bound molecules (φ) are similar, i.e., to the S-regime. Adapted from [4].
then the steady-state level of RNA i will be very close to the maximum possible,
m⋆i. In such conditions, RNA species i will be roughly insensitive to changes in
miRNA levels. We will call this the ‘unrepressed’ or ‘free’ regime for RNA i. As the quantity a Paµa/µia increases, e.g. following an increase in the level of one or
more miRNA species, [mi] deceases. This occurs most notably whenPaµa/µia∼ 1
(corresponding, for M = 1, to a miRNA level close to the threshold value µ0
ia). Here
RNA i is very sensitive to a change in miRNA levels. We shall therefore term this the ’susceptible’ regime for RNA i. Finally, when miRNA levels become sufficiently large, ceRNA i will eventually become fully repressed. In order for this to occur, it suffices thatPaµa/µia>> 1 (which occurs e.g. when the level of at least one of the
miRNA species targeting i significantly exceeds its corresponding threshold µ0
ia ).
We then shall this the ‘repressed’ regime for ceRNA i (see Figure 2.2c for a sketch). Note that the sigmoidal shaped response curve is typical of titration mechanisms.
It is now very instructive to look at what happens if instead we modulate the transcription rate of one ceRNA. Let us consider a system with only two ceRNA molecules and one miRNA and look at concentrations upon varying the transcription rate of say ceRNA 1. As b1 increases, m1 grows as expected while the concentration of
free miRNAs decreases as they increasingly engage targets. This in turn un-represses the other RNA species, whose level also increases as the transcription rate of ceRNA 1 is upregulated (see Fig. 2.3). The level of ceRNA 2 increases upon changing b1
and this response happens in the susceptible region. This is the key signature of the miRNA-mediated crosstalk that can be established between competing RNAs. In what follows we will see how to quantitatively measure the crosstalk and why heterogeneity is a key ingredient.
Table 2.1. Summary of parameter values.
Parameter Value Description Ref.
d 0.08 [h−1] RNA degradation rate [59]
δ 0.027 [h−1] miRNA degradation rate [59]
λ 0.2 stoichiometricity ratio [59]
hbi 8 [molecules/h] mean RNA transcription rate [59]
Chapter 3
Molecular crosstalk
Almost all processes inside cells involve bindings between molecules. If a molecule can bind to two possible target molecules, in such a way that once the molecule binds to one target it can not interact with the other until the complex dissociates, then a sort of competition for the binding of the common molecule is established between the targets. Such competition results in an effective, or mediated, interaction between the targets. In fact, if the concentration of one target increases, then part of the molecules targeting the second target will be diverted toward the first and the net result will be an increase of the second target free molecules. The effective interaction is termed crosstalk.
Here, we will focus on the crosstalk between RNAs originating from their compe-tition in binding micro RNA [60]. However, this mechanism of ‘titrative’ interaction is found in processes as different as protein ubiquitination [61], growth factors sig-naling [62], and transcription factors sequestration [63]. Consequently, the picture we are going to discuss is expected to apply in general to all networks of molecular species competing for a common resource. As we saw in 2.1 and in 2.2, micro RNAs are important post-transcriptional regulators of gene expression. Since each micro RNA can bind to many targets, they originate a network of effective interactions among the whole population of RNAs.
The characteristic of the resulting crosstalk, as we show in 2.3, depends on three main ingredients: the concentrations of molecules, the kinetics of the binding between micro RNA and target and obviously the topology of the resulting network. The abundances of individual miRNA and target molecules in cells can span many orders of magnitude. Heterogeneities in transcriptional activities are the central mechanism behind this scenario. Furthermore, while cells can regulate the average level of transcription, variations from the average can happen both due to molecular noise and to perturbations.
miRNA binding kinetics depends on the degree of complementarity between the miRNA and its target RNA, with higher complementarities resulting in stronger repressive effects. Recent investigations highlighted a rich scenario of different binding modes and strength [5]. Finally, the wiring observed in real networks shows peculiar statistical features, like broad connectivity distributions.
![Figure 2.1. miRNA biogenesis and target binding. Adapted from [2].Once loaded in the RISC, the miRNA](https://thumb-eu.123doks.com/thumbv2/123dokorg/2885694.10819/29.892.436.720.570.880/figure-mirna-biogenesis-target-binding-adapted-loaded-risc.webp)