Carlo Nazareno Dibenedetto,
Elisabetta Fanizza,
Marinella Striccoli,
and Françoise Remacle
†Department of Chemical Sciences, University of Padova, Via Marzolo 1, I-35131 Padova, Italy‡Theoretical Physical Chemistry, University of Liège, Allèe du 6 Aout 11, B4000 Liège, Belgium
⊥CNR-IPCF SS Bari, c/o Chemistry Department, University of Bari Aldo Moro, Via Orabona 4, I-70126 Bari, Italy #Chemistry Department, University of Bari Aldo Moro, Via Orabona 4, I-70126 Bari, Italy
*
S Supporting InformationABSTRACT: One of the most recent developments at the forefront of nanotechnology is
the attempt to exploit quantum phenomena in nanometer scale materials, exploring novel applications of quantum effects. An effective exploitation of quantum phenomena must necessarily pass through a deep understanding of how to generate, manipulate, and characterize coherent superposition of quantum states in the nanosystems. However, despite the lively interest in this topic, the study of coherent effects in nanomaterials still represents relatively unexplored territory. Here we report an investigation on the ultrafast coherent dynamics of colloidal CdSe quantum dots (QDs) by the mean of two-dimensional electronic spectroscopy (2DES). The time evolution of specific coherent superpositions offine structure levels in these nanomaterials is clearly demonstrated. The obtained results represent an important step forward toward a deeper understanding of quantum properties of nanomaterials.
■
INTRODUCTIONThe capability of exploiting quantum coherent phenomena in nanometer scale materials is at the forefront of the most recent applications in quantum technology. The development of this technology, however, is strongly dependent on a deep understanding of how to generate, manipulate, and character-ize a coherent superposition of quantum states in the nanosystems.1 This is a particularly compelling subject, because the investigation of quantum phenomena occurring in matter at nanometer-length scales and femtosecond time scales challenges the currently available state-of-the-art experimental and theoretical methodologies. Therefore, it is of crucial importance to start building a solid base of knowledge about the quantum coherent dynamic behavior of nanosystems.2
Among the wide wealth of nanomaterials considered so far for quantum applications, semiconductor nanocrystals (quan-tum dots, QDs) have become a widely trialed choice in recent years3,4 because of their exceptional electronic and optical properties arising from quantum mechanical effects of spatial confinement.5 The technological exploitation of QDs is nowadays an already mature field ranging from applications in solar cells, to spintronics and photonics, nonlinear optics and lasers.6−9
Extensive spectroscopic and theoretical investigations on colloidal QDs, especially CdSe, resulted in a good under-standing of the main properties of the electronic states and the dynamic process in which they are involved. The simple
particle-in-a-sphere (PS) model has been demonstrated to be a very handy model for the interpretation of the optical responses, able of capturing the major features of absorption spectra, Coulombic coupling in multiexciton states, population relaxation, and trapping dynamics.10While this model justifies the major features of the optical responses, recent ultrafast coherent multidimensional experiments suggested that it needs to be refined to account for more detailed properties. Ultrafast spectroscopies indeed revealed a much more complex and richer level structure, the “fine structure”,11 particularly relevant in the coherent dynamic response in the ultrafast time regime.12−14The dense manifold of states arising in the fine structure are predicted in the framework of the effective mass approximation (EMA) where spin−orbit coupling (SO), exchange interaction, and crystalfield mix the PS states and lift their degeneracy.13 The fine structure is often not directly recognizable in the absorption spectra of colloidal QDs, and even more advanced nonlinear techniques struggle to fully decipher the nondegenerate fine structure states within excitonic bands. For this reason, despite its significance, the study of exciton fine structure in colloidal QDs has been mainly hampered by experimental challenges. Also from the theoretical point of view, despite the considerable amount of efforts paid to obtain a thorough description of the fine structure energy levels in QDs,15 several aspects remain still
Received: November 30, 2019
Published: December 2, 2019
Downloaded via CNR on April 7, 2020 at 08:41:42 (UTC).
unclear, such as the interplay between Coulomb and exchange interactions, spin−orbit coupling, interband mixing and crystal field splitting and their possible size dependence, as well as the coupling to phonon modes.
In view of using QDs as candidates for quantum technology devices, the time evolution of coherence superpositions offine structure levels lying on the same (intraband) or on different (interband) exciton bands (Figure 1) are of fundamental interest not only to understand the mechanisms of dephasing but also to harness the quantum nature of the coherent phenomena in devices. Toward this aim, in this work, we studied the coherent dynamics of colloidal suspensions of CdSe nanocrystals, looking in particular at the evolution of coherent superpositions offine structure states.
Although the first investigations on the ultrafast coherent dynamics in semiconductors date back to the 1980s,16−18when it comes to the detection of coherent dynamics, 2D electronic spectroscopy (2DES) is one of the most mighty techniques. Indeed, 2DES is capable of mapping the evolution of coherent superposition of states at different coordinates in 2D frequency−frequency correlation maps.19 Despite the note-worthy recent advancements in data acquisition and analysis techniques, the experimental reports about coherent super-positions of different excitonic bands in QD samples remain limited,12,20−23 and the debate about their effective exper-imental detection is still open.24Here we made a step further in the discussion, reporting clear evidence for coherent electronic dynamics.
■
METHODSSample Preparation and Characterization. The syn-thesis of CdSe colloidal quantum dots (QDs) was carried out by properly modifying a reported procedure.25,26All solvents were of the highest purity available and used as received; CdO powder, trioctylphosphine oxide (TOPO; technical grade 90%), hexadecylamine (HDA, 90%), and oleic acid (90%).
CdSe QDs were synthesized under nitrogen flux by
decomposition at high temperature of CdO in the presence of a mixture of ligands (TOPO, HDA, and OLEA). Typically, CdO (0.127 g, 1 mmol) and 1 mL of OLEA were put at 90°C in a three-necked flask under vacuum to eliminate moisture and then heated up to 260 °C under nitrogen to completely decompose the CdO red powder into the Cd−oleate complex
(pale yellow solution). The Cd−oleate mixture was then cooled down to 85°C and kept under nitrogen. TOPO (9 g, 23 mmol) and HDA (9 g, 37 mmol) were left at 110°C under vacuum for 1 h, cooled down to 85°C, and transferred into the Cd−oleate flask. The temperature was then increased up to 300°C and 2 mL of TBP were injected at 280 °C, followed by the Se precursor solution (0.394 g of Se, 5 mmol, dissolved in 4.5 mL of TBP) injection at 295°C (injection temperature). Soon after the injection, the temperature was brought down to 270 °C (growth temperature), and the flask was allowed to stay at this temperature under stirring for the QDs growth. The desired QD size was achieved by subsequent growth at 270°C for a variable reaction time. The reaction mixture wasfinally cooled down to 100°C and allowed to stay at this temperature for 1 h for the annealing step. Then the QD sample was purified from the unreacted reagents and side products by the addition of methanol as nonsolvent and centrifugation. The collected precipitate was redispersed in 4 mL of hexane.
In order to obtain stable CdSe QD dispersion in water, a surface functionalization was carried out by using mercapto-carboxylic acids. Such bifunctional organic acids enable the partial exchange of the pristine TOPO/HDA/Olea ligands by SH-moiety, which has a high affinity with the QD surface. The carboxylic functional groups point outward toward the QD surface, enabling their stable dispersion in water. Two mercapto-carboxylic acids were used, namely, mercaptopro-pionic acid (MPA, HS-(CH2)2-COOH) and
mercaptounde-canoic acid (MUA, HS-(CH2)10-COOH), differing for the
length of the alkyl chain, being MPA∼ 0.68 nm and MUA ∼ 1.71 nm.27,28In a typical capping exchange process, 0.5 mL of the as-synthesized QDs (nearly 10−5M) were diluted 1:3 with chloroform, and the new ligand MUA or MPA (10 mg/mL) was added. The solution was stirred overnight. It became turbid upon addition of a small amount of organic base (TBAH). At this stage, the QD solution is collected by centrifugation at 3000 rpm and dissolved in carbonate buffer. Repeated centrifugation and dialysis are carried out to remove the insoluble particles and the free ligand molecules, respectively, from the solution.
2DES Measurements. 2DES measurements were con-ducted with the setup described in ref29. Briefly, the output of an 800 nm, 3 kHz Ti:sapphire laser system (Coherent Libra) is converted into a broad visible pulse in a noncollinear optical Figure 1.Computedfine level structure for CdSe nanocrystals of 3.3 nm (a) and 4.4 nm (b) diameter, based on EMA approximation supplemented by SO, exchange interactions, and crystalfield splittings, as in ref13. Colored double arrows exemplify intramanifold (blue), interband 2S3/2−1S1/2
(yellow), interband 1S3/2−2S3/2 (red), and intraband 1S3/2−1S1/2 and 2S3/2−2S1/2 (green) energy gaps (seeSI for more details).“F” is the
projection of the total momentum. An intra (inter)-band coherence is defined as a coherent superposition of fine structure levels lying on the same (different) exciton bands.
amplifier (Light Conversion TOPAS White). The spectrum was tuned to cover the two main transitions appearing in the absorption spectra of the QDs samples. The transform-limited condition for the pulses at the sample position is achieved through a prism compressor coupled with a Dazzler pulse shaper for thefine adjustment. The pulse duration, optimized through FROG measurements (Figure S2.1), is 9 fs for the pulse inFigure 2a (CS3.3.-MUA and CS3.3-MPA) and 8 fs for the pulse inFigure 2d (CS4.4-TOPO). The pulses energy at the sample position is reduced to 5 nJ per pulse by a broadband half-waveplate/polarizer system. The 2DES experi-ment relies on the passively phase stabilized setup, where the laser output is split into four identical phase-stable beams (three exciting beams and a fourth beam further attenuated of 3 orders of magnitude and used as Local Oscillator, LO) in a BOXCARS geometry using a suitably designed 2D grating. Pairs of 4° CaF2wedges modulate time delays between pulses. One wedge of each pair is mounted onto a translation stage that regulates the thickness of the medium crossed by the exciting beam and provides a temporal resolution of 0.07 fs. Delay times t1 (coherence time between first and second
exciting pulses), t2(population time between second and third exciting pulses), and t3 (rephasing time between the third exciting pulses and the emitted signal) are defined. Rephasing (R) and nonrephasing (N) spectra can be acquired suitably changing the pulse sequence. The total (purely absorptive)
signal (T) is obtained by a sum of the R and N signals. The outcome of the experiment is a 3D array of data describing the evolution of 2D frequency−frequency correlation maps, where the two frequencies ω1 and ω3 are obtained Fourier
transforming t1 and t3, respectively, as a function of t2. For
the CS3.3-MUA and CS3.3-MPA samples, the 2DES spectra were acquired for population times ranging from 0 to 800 fs in 5 fs increments. For the CS4.4-TOPO sample, we performed a first scan with t2from 0 to 250 fs, with steps of 7.5 fs, to put the
attention on possible coherent and ultrafast dynamics; and a second scan with t2 from 0 to 2 ps with steps of 60 fs, to
explore the dynamics at longer times. For all the samples, each experiment repeated at least four times to ensure reproduci-bility.
Theoretical Simulations. The excitonic level structure is parametrized as a function of the QD size using the PS model and the effective mass approximation for the hole and the electron and the spectroscopic data of ref30 on the 1S3/2−
2S3/2transition. In order to obtain thefine structure levels, we
include the spin−orbit, exchange, and crystal field couplings, as in ref13. The values of the parameters for the exchange and crystalfield coupling are taken from ref13and are assumed to be the same for the 1S and 2S bands. The value of the SO coupling is set to be 220 meV, smaller than the bulk value (≈ 418 meV). Because of the small dot size, one expects a decrease of the SO coupling compared to the bulk value. Band Figure 2.(a) Experimental (black) and simulated (blue) absorption spectra of CdSe QDs diameter 3.3 nm, capped with MUA and dispersed in water (CS3.3-MUA). Normalized photoluminescence (PL) spectra (dotted lines) are also reported. The blue bars indicate the position and the intensity of the calculated transitions, according toFigure 1, and the blue line is the convolution with a Gaussian (fwhm = 0.08 eV). The shaded red areas depict the laser spectral profiles used for the excitation in 2DES experiments. (b) Transmission electron microscopy (TEM) micrograph (scale bar 20 nm) and (c) size distribution (σ% = 10%) of CS3.3-MUA. (d−f) Same as (a)−(c) for CdSe QDs diameter 4.4 nm, capped with TOPO and dispersed in hexane (CS4.4-TOPO).
mixing31 could also play a role since the 1S1/2h−1Se state is
known to be mixed with a D envelope function, but was not included in this study. Additional details are reported in the Supporting InformationandMethods. The model is found to be adequate to elucidate the role of thefine structure levels in the fast oscillating electronic coherences (≈50 fs period) identified in 2DES spectra. As discussed below, the slower coherent electronic oscillations (≈150 fs period) that arise from the fine structure levels will be coupled to the phonon modes through nonadiabatic interactions. These nonadiabatic interactions are not taken into account in the model since we focus here on characterizing the fast, tens of fs, oscillating electronic coherence. The electron−phonon coupling, which arises from coupling between the electronic and the nuclear motion, typically manifests itself on a longer ps time scale. It can be described by atomic scale computations,22,32−35which uncover a much more complex and dense electronic and phonon level structure. This was shown to lead to a complex relaxation dynamics for the Cd33Se33 whose different time
scales can be scaled to describe ps relaxation dynamics in larger size QDs.22,34,36
■
RESULTS AND DISCUSSIONThe main reasons that complicate the detection of coherent dynamics in QDs samples are (i) the inhomogeneous broadening, intrinsically affecting QDs samples and resulting in a quick ensemble dephasing (“fake decoherence”37) and (ii) the contribution of the nonresonant response of the solvent affecting the dynamics at short time delays (coherent artifact) and contributing also at longer times through impulsive Raman modes.20,23,38−40 Guided by theoretical predictions and supported by materials science techniques, these two hindering effects have been overcome through a suitable choice of size dimensions, ligands, and solvent.
First, different from previous 2DES investigations mainly focused on QDs with diameters in the range 5−7 nm,20,22,23 we considered here smaller dots (diameter 3.3 nm, labeled CS3.3) with polydispersity around 10%. The splitting between levels increases as the QD size decreases, thus exciton energy gaps amongfine structure states are wider and the emerging bands of states are not overlapping like in bigger dots (see also Figures S1.1−S1.3).41In this way, the possibility to selectively excite specific superpositions of states and follow their
coherent dynamics is easier and the fake decoherence effect is mitigated.
Second, to avoid solvent interference, we modified the native capping layer of CdSe QDs to be dispersible in water. Previous 2DES investigations on QDs suspensions have been performed i n o r g a n i c s o l v e n t s , t o l u e n e a n d c h l o r o f o r m mainly,20,23,38−40,42both characterized by a strong nonresonant optical Kerr effect and by several Raman active modes that hinder the weaker oscillatory features due to possible coherent dynamics of the QDs. Water is instead the ideal solvent because it has very low polarizability and no relevant Raman modes below 1600 cm−1. To stabilize water suspensions of QDs, we functionalized them with mercaptoundecanoic acid (MUA) or mercaptopropionic acid (MPA) that, because of the presence of a carboxylic group, guarantee water solubility in a basic environment.
For comparison, we also considered a bigger size QD sample (diameter 4.4 nm) functionalized with the native trioctylphos-phine oxide (TOPO) ligand and suspended in hexane. Differently from other organic solvents, such as toluene or chloroform, hexane has a nonlinear response weak enough not to overcome the QDs’ signal.
Figure 2 reports the linear and morphological character-ization of the two QD samples. In panels (a) and (d), experimental and simulated linear absorption spectra are compared, whereas panels (b, e) and (c, f) report the morphological characterization and the size distributions, respectively. The stick spectra shown in Figure 2a,d have been obtained using the spherical particle model and the EMA, supplemented by SO, exchange interactions, and crystalfield splittings as in ref13, seeSIfor details. The simulated spectra show that the main transitions in the investigated spectral window involve states of the 1S3/2−1Se, 2S3/2−1Se, and 1S1/2− 1Semanifolds for the two sizes, with the spacing between the 1S3/2 and 2S3/2 manifold being larger for the smaller dot size (Figure 2a, 3.3 nm). For this smaller dot size, the 2S1/2and the
P3/2 manifolds clearly fall out of the laser bandwidth and do
not contribute to the coherences characterized in the 2DES spectra reported below.
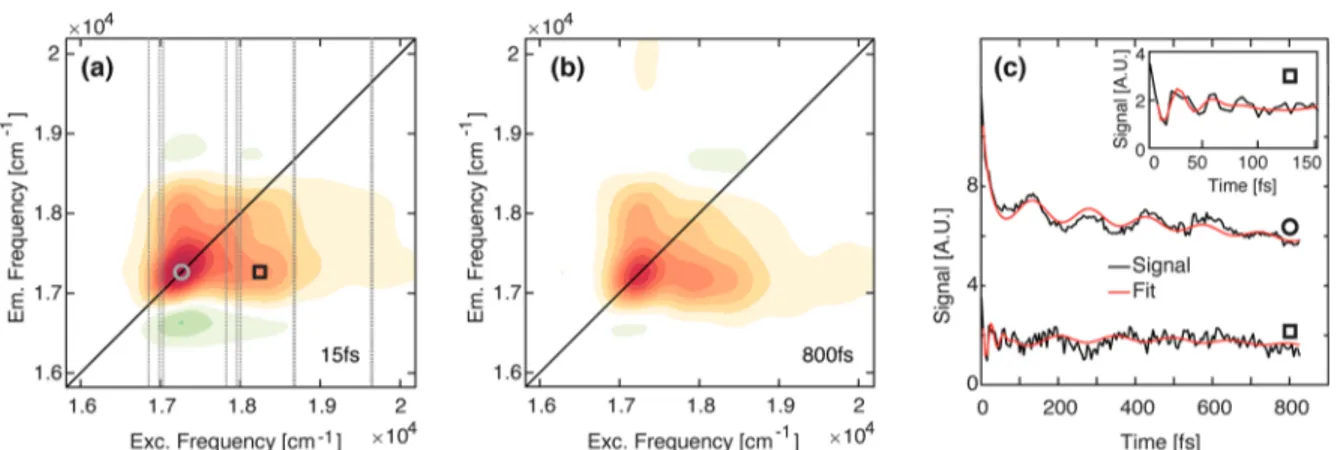
The ultrafast dynamics of the samples have been characterized by 2DES in BOXCARS configuration using exciting laser profiles also shown inFigure 2a,d. Details about Figure 3.2DES measurements on CS3.3-MUA suspended in water. (a, b) Examples of total (purely absorptive) 2DES maps at two selected values of population time t2(more maps available inSI). Dashed lines indicate the position of the brightfine level structure states, as estimated in the
simulations, in agreement withFigure 1a. (c) Decay traces extracted at diagonal (17300, 17300 cm−1) coordinates (circle) and at off-diagonal (18300, 17300 cm−1) coordinates (square). Black: experimental data; red:fitting trace obtained from the global fitting analysis. The inset shows a zoom at early times of the decay trace at off-diagonal coordinates.
main diagonal peaks are typically observed.24 Based on the calculated exciton level scheme presented inFigure 1, we can take a step further and recognize within the inhomogeneously broadened peak also the broadening effect of the fine structure. The evolution of the 2DES maps along t2has been analyzed
through recently proposed global data analysis method-ologies.43,44 The inspection of the nonoscillating population dynamics highlighted kinetic decay constants in agreement with previous studies on similar samples.42,45,46 The 2DES signal decay can be wellfitted with three time constants: (i) an ultrafast time constant of the order of tens of fs that can be attributed to ultrafast processes such as hot carrier relaxation, spectral diffusion and scattering phenomena; (ii) a second component associated with interband relaxation and/or surface related relaxation channel due to presence of thiol ligands; and (iii) a long time component (≫1 ps) describing the overall decay of the maps following relaxation processes happening in time scales well beyond the investigated experimental time window. All these dynamic processes have been already widely documented in the literature.20−24,42,45,46Table S2.1 in the SI summarizes the exact values of the time constants for the samples considered in this work.
Much more interesting is the oscillating dynamics associated with the evolution of coherent superposition of states. The presence of a lively oscillating coherent dynamics is witnessed by the representative decay traces extracted at relevant coordinates and plotted in Figure 3c. In the decay traces at the two positions reported, one clearly distinguishes coherences with beating periods of the order of 150 fs and faster ones of the order of 50 fs. The main components contributing to the overall beating behavior of the whole 2D maps can be initially checked looking at the Fourier spectrum of coherences (FSC), obtained Fourier-transforming the 2DES maps along t2after integration over the excitation and emission
frequencies. It is worth highlighting that only the main components can survive to the integration along the two frequency dimensions, and therefore, beatings arising from artifacts appearing only at specific coordinates should be averaged over.
In Figure 4a, we report the FCS obtained applying Fourier transform only until t2 = 250 fs to highlight the
contribution of quickly damped oscillations shown in the lower trace in Figure 3c and in the inset. Thefigure also shows as vertical bars all the possible values of energy gaps involving superpositions of intramanifold (blue), interband (yellow and red), and intraband (green) fine structure levels, obtained by the simulations and defined as inFigure 1andFigures S1.4 and S1.5 in SI. The comparison with the experimental data reveals a fairly good agreement with the calculated fine structure levels.
The first relevant component is at about 225 cm−1. This component has a frequency compatible with the excitation of the longitudinal optical (LO) phonon typical of CdSe nanocrystals,47,48but also with the energy gaps corresponding to coherences between the intramanifold 1S3/2and 2S3/2 fine structure states (blue). The possibility of distinguishing between the two contributions has been already explored, and an approach based on the analysis of the tilt of the signal in the corresponding Fourier map has been proposed.49However, the investigation of the amplitude distribution of this component revealed a complex behavior and its dynamics, characterized by a dephasing time of about 400 fs, does not fully agree with the ps dynamics expected for a LO phonon.22,36,50 This suggests more complex interactions and Figure 4.Beating analysis for the 2DES measurements on CS3.3-MUA suspended in water. (a) Fourier spectrum of coherences (FSC) obtained applying a Fourier Transform along t2until 250 fs and then
integrating alongω1andω3frequency axes. Vertical bars highlight the
energy gap values estimated by the simulations, see alsoFigure S1.4 of the SI. The transitions are color-coded as inFigure 1. (b) Amplitude distribution map (absolute value CAS55) obtained from the global fitting of the rephasing signal relative to an oscillation with central frequency 1120 cm−1and damping time 21 fs. (c) Same as (b) for the nonrephasing signal. (d) Time-frequency transform of the trace at coordinates (18300, 17300) cm−1(labeled with a square in Figure 3a).
a mixing of nuclear and electronic degrees of freedom, possibly leading to the formation of stable polarons.33,51 Several theoretical and experimental investigations have already been devoted to the investigation of the coupling between the electronic and nuclear motion (see, for example, refs22,33, 36, 52, and 53). However, a thorough investigation of this phenomenon would require measurements on a time window possibly longer than the one explored in this work and will be the object of future studies.
Additional higher frequency modes have been detected at about 700, 1100, and 1900 cm−1, all characterized by relatively short dephasing times (<25 fs) and, also as a consequence of the time-frequency resolution limit of the Fourier transform, by relatively broad frequency distribution. These coherent sub-100 fs oscillations are mainly detected at cross-peaks positions in the rephasing data and at diagonal positions in the nonrephasing spectra, as shown in the amplitude distribution maps in Figure 4b,c. They correspond to interband 2S3/2−
1S1/2(yellow) and 1S3/2−2S3/2(red) coherences, as well as to
intraband coherences involving the two spin orbit bands 1S3/2 and 1S1/2(green).
A more direct way to visualize dephasing times of beating modes is to perform a time-frequency transform analysis (TFT), an approach that allows overcoming the limitations of conventional methods based on Fourier transforms, maintain-ing both frequency and time resolution. A TFT spectrum, indeed, shows on the ordinate the frequencies of the components contributing to the beating pattern at a specific coordinate of the 2D map, like a conventional Fourier spectrum, and on the abscissa their time evolution.54,55 In Figure 4d, we report the results of such analysis applied to the beating trace extracted at the below-diagonal cross-peak coordinates of the rephasing spectra pinpointed by a square inFigure 3.
Since at these frequencies we can easily exclude solvent contributions and CdSe phonon modes, we assign these oscillations to the evolution of coherent superpositions of electronic states. The localization of these components at off-diagonal (off-diagonal) coordinates in rephasing (nonrephasing) signal, as well as their fast dephasing time support this attribution.
To generalize our approach to the characterization of electronic coherent beatings betweenfine structure states and exclude artifacts due to a particular sample, we repeated the measurements also on two additional samples. First, we considered QDs with the same size (3.3 nm) but function-alized with a shorter alkyl chain ligand, namely mercaptopro-pionic acid (MPA), with the aim to check for possible modifications in the photophysical behavior due to the presence of charges in closer proximity of the nanocrystal core. 2DES measures on CS3.3-MPA provided completely comparable results as for CS3.3-MUA, and no relevant difference could be detected between these samples (data provided inSI), proving that the presence of charged groups on the ligands is not affecting the ultrafast coherent dynamics of the CdSe cores.
In addition, we also performed 2DES measures on the CS4.4-TOPO sample in hexane, whose linear and morpho-logical characterization is reported in Figure 2d−f. The relevant features emerging from measurements on CS4.4-TOPO sample are summarized inFigure 5(for the computed level scheme and transition frequencies, see Figure 1b and Figure S1.5). In this case, the peculiarities of the QDs
underlined before are less appreciable both because the larger size leads to a smaller spacing between the bands and because of possible contributions of the organic solvent. Nevertheless, coherent dynamics could still be revealed and the agreement between the calculated energy gaps amongfine structure states and experimental pieces of evidence is good.
■
CONCLUSIONSIn conclusion, in this work we have documented how it is possible to identify and follow the time evolution of coherent superpositions of electronic fine structure states optically generated in colloidal samples of QDs. Differently from previous works, a suitable choice of dots’ size and solvent, complemented by optimized data analysis procedures and theoretical predictions, allow to clearly identify several overdamped beatings in the time evolution of 2DES signals, despite the intrinsic inhomogeneity and size dispersion of the colloidal samples.
The demonstration that coherent dynamics can emerge even from a large inhomogeneous ensemble is a particularly relevant issue in view of quantum technology applications and coherent control. Indeed, while in thisfield, a lot of attention has been devoted to the coherent optical manipulation of spins and excitons in single QD systems,56 the ability to coherently address larger ensembles is the key toward the applicability of Figure 5. 2DES measurements on CS4.4-TOPO suspended in hexane. (a) Example of a total (purely absorptive) 2DES map at t2=
300 fs (more maps available inSI). Dashed lines pinpoint the position of thefine level structure states as estimated by the simulations as in
Figure 1b. (b) Fourier spectrum of coherences. Vertical bars highlight the energy gap values estimated by the simulations with the same color code as inFigure 1, see alsoFigure S1.5. (c) Time-frequency transform of the trace at coordinates (17150, 16100) cm−1, pinpointed with a square marker in panel (a).
The comparison of the experimental results with calculations allowed not only justifying the presence of all the main electronic beating components appearing in the time evolution of the 2DES signal, but it also provides their specific attribution to intra or interband coherences. In the frequency range between 700 and 1200 cm−1 for the dots’ sizes considered in this work, interband coherences among the 2S3/2−1S1/2 and the 1S3/2−2S3/2 bands are identified. The possibility of untangling intraband and interband coherences is crucial information in the perspective of more systematic exploitation of coherent QDs optical properties in quantum logic devices.
■
ASSOCIATED CONTENT*
S Supporting InformationThe Supporting Information is available free of charge at https://pubs.acs.org/doi/10.1021/acs.jpcc.9b11153.
Additional information about theoretical simulations: parameters and model details for the fine structure, simulation of absorption spectra, and assignment of modeled coherences. Additional experimental data: characterization of the exciting pulses used in 2DES (FROG measurements), additional 2DES maps, and summary of the results of the globalfitting analysis of the 2DES data (PDF)
■
AUTHOR INFORMATION Corresponding Author *E-mail:[email protected]. ORCID Elisabetta Collini:0000-0002-1019-9100 Luca Bolzonello:0000-0003-0893-5743 Andrea Volpato:0000-0003-3368-0017 Elisabetta Fanizza:0000-0001-6293-9388 Marinella Striccoli:0000-0002-5366-691X Françoise Remacle: 0000-0001-7434-5245 Present Addresses§ICFO − The Institute of Photonic Sciences, Mediterranean
Technology Park, Av. Carl Friedrich Gauss, 3, 08860 Castelldefels (Barcelona), Spain.
∥SciLifeLab, Tomtebodavägen 23a, 171 65 Solna, Sweden.
Notes
The authors declare no competingfinancial interest.
■
ACKNOWLEDGMENTSThis work was financially supported by the H2020 FET Project COPAC (766563). MIUR PRIN 2015 No. 2015XBZ5YA is also acknowledged.
(6) Colloidal Quantum Dot Optoelectronics and Photovoltaics; Konstantatos, G., Sargent, E. H., Eds.; Cambridge University Press: Cambridge, 2013.
(7) Imamoglu, A.; Awschalom, D. D.; Burkard, G.; DiVincenzo, D. P.; Loss, D.; Sherwin, M.; Small, A. Quantum Information Processing Using Quantum Dot Spins and Cavity QED. Phys. Rev. Lett. 1999, 83 (20), 4204−4207.
(8) Kamat, P. V. Quantum Dot Solar Cells. Semiconductor Nanocrystals as Light Harvesters. J. Phys. Chem. C 2008, 112 (48), 18737−18753.
(9) Todescato, F.; Fortunati, I.; Gardin, S.; Garbin, E.; Collini, E.; Bozio, R.; Jasieniak, J. J.; Della Giustina, G.; Brusatin, G.; Toffanin, S.; et al. Soft-Lithographed up-Converted Distributed Feedback Visible Lasers Based on CdSe-CdZnS-ZnS Quantum Dots. Adv. Funct. Mater. 2012, 22 (2), 337−344.
(10) Kambhampati, P. Unraveling the Structure and Dynamics of Excitons in Semiconductor Quantum Dots. Acc. Chem. Res. 2011, 44 (1), 1−13.
(11) Efros, A. L.; Rosen, M.; Kuno, M.; Nirmal, M.; Norris, D. J.; Bawendi, M. Band-Edge Exciton in Quantum Dots of Semiconductors with a Degenerate Valence Band: Dark and Bright Exciton States. Phys. Rev. B: Condens. Matter Mater. Phys. 1996, 54 (7), 4843−4856. (12) Kohler, D. D.; Block, S. B.; Kain, S.; Pakoulev, A. V.; Wright, J. C. Ultrafast Dynamics within the 1S Exciton Band of Colloidal PbSe Quantum Dots Using Multiresonant Coherent Multidimensional Spectroscopy. J. Phys. Chem. C 2014, 118 (9), 5020−5031.
(13) Wong, C. Y.; Scholes, G. D. Using Two-Dimensional Photon Echo Spectroscopy to Probe the Fine Structure of the Ground State Biexciton of CdSe Nanocrystals. J. Lumin. 2011, 131 (3), 366−374.
(14) Ma, H.; Jin, Z.; Zhang, Z.; Li, G.; Ma, G. Exciton Spin Relaxation in Colloidal CdSe Quantum Dots at Room Temperature. J. Phys. Chem. A 2012, 116 (9), 2018−2023.
(15) Sercel, P. C.; Efros, A. L. Band-Edge Exciton in CdSe and Other II−VI and III−V Compound Semiconductor Nanocrystals − Revisited. Nano Lett. 2018, 18 (7), 4061−4068.
(16) Becker, P. C.; Fragnito, H. L.; Cruz, C. H. B.; Fork, R. L.; Cunningham, J. E.; Henry, J. E.; Shank, C. V. Femtosecond Photon Echoes from Band-to-Band Transitions in GaAs. Phys. Rev. Lett. 1988, 61 (14), 1647−1649.
(17) Masumoto, Y.; Shionoya, S.; Takagahara, T. Optical Dephasing of Excitonic Polaritons in CuCl Studied by Time-Resolved, Nondegenerate Four-Wave Mixing. Phys. Rev. Lett. 1983, 51 (10), 923−926.
(18) Langer, V.; Stolz, H.; von der Osten, W. Observation of Quantum Beats in the Resonance Fluorescence of Free Excitons. Phys. Rev. Lett. 1990, 64 (8), 854−857.
(19) Collini, E. Spectroscopic Signatures of Quantum-Coherent Energy Transfer. Chem. Soc. Rev. 2013, 42 (12), 4932−4947.
(20) Caram, J. R.; Zheng, H.; Dahlberg, P. D.; Rolczynski, B. S.; Griffin, G. B.; Fidler, A. F.; Dolzhnikov, D. S.; Talapin, D. V.; Engel, G. S. Persistent Interexcitonic Quantum Coherence in CdSe Quantum Dots. J. Phys. Chem. Lett. 2014, 5 (1), 196−204.
(21) Cassette, E.; Pensack, R. D.; Mahler, B.; Scholes, G. D. Room-Temperature Exciton Coherence and Dephasing in Two-Dimensional Nanostructures. Nat. Commun. 2015, 6, 6086.
(22) Dong, S.; Trivedi, D.; Chakrabortty, S.; Kobayashi, T.; Chan, Y.; Prezhdo, O. V.; Loh, Z.-H. Observation of an Excitonic Quantum Coherence in CdSe Nanocrystals. Nano Lett. 2015, 15 (10), 6875− 6882.
(23) Turner, D. B.; Hassan, Y.; Scholes, G. D. Exciton Superposition States in CdSe Nanocrystals Measured Using Broadband Two-Dimensional Electronic Spectroscopy. Nano Lett. 2012, 12 (2), 880− 886.
(24) Cassette, E.; Dean, J. C.; Scholes, G. D. Two-Dimensional Visible Spectroscopy For Studying Colloidal Semiconductor Nano-crystals. Small 2016, 12 (16), 2234−2244.
(25) Fanizza, E.; Urso, C.; Pinto, V.; Cardone, A.; Ragni, R.; Depalo, N.; Curri, M. L.; Agostiano, A.; Farinola, G. M.; Striccoli, M. Single White Light Emitting Hybrid Nanoarchitectures Based on Function-alized Quantum Dots. J. Mater. Chem. C 2014, 2 (27), 5286−5291.
(26) Fanizza, E.; Altomare, M.; Di Mauro, A. E.; Del Sole, T.; Corricelli, M.; Depalo, N.; Comparelli, R.; Agostiano, A.; Striccoli, M.; Curri, M. L. Polyelectrolyte Multilayers As a Platform for Luminescent Nanocrystal Patterned Assemblies. Langmuir 2012, 28 (14), 5964−5974.
(27) Hinterwirth, H.; Kappel, S.; Waitz, T.; Prohaska, T.; Lindner, W.; Lämmerhofer, M. Quantifying Thiol Ligand Density of Self-Assembled Monolayers on Gold Nanoparticles by Inductively Coupled Plasma−Mass Spectrometry. ACS Nano 2013, 7 (2), 1129−1136.
(28) Jing, L.; Kershaw, S. V.; Li, Y.; Huang, X.; Li, Y.; Rogach, A. L.; Gao, M. Aqueous Based Semiconductor Nanocrystals. Chem. Rev. 2016, 116 (18), 10623−10730.
(29) Bolzonello, L.; Volpato, A.; Meneghin, E.; Collini, E. Versatile Setup for High-Quality Rephasing, Non-Rephasing, and Double Quantum 2D Electronic Spectroscopy. J. Opt. Soc. Am. B 2017, 34 (6), 1223.
(30) Norris, D. J.; Bawendi, M. G. Measurement and Assignment of the Size-Dependent Optical Spectrum in CdSe Quantum Dots. Phys. Rev. B: Condens. Matter Mater. Phys. 1996, 53 (24), 16338−16346.
(31) Efros, A. L. Luminescence Polarization of CdSe Microcrystals. Phys. Rev. B: Condens. Matter Mater. Phys. 1992, 46 (12), 7448−7458. (32) Wang, L.-W.; Zunger, A. Local-Density-Derived Semiempirical Pseudopotentials. Phys. Rev. B: Condens. Matter Mater. Phys. 1995, 51 (24), 17398−17416.
(33) Kelley, A. M. Electron−Phonon Coupling in CdSe Nanocryst-als. J. Phys. Chem. Lett. 2010, 1 (9), 1296−1300.
(34) Kilina, S. V.; Kilin, D. S.; Prezhdo, O. V. Breaking the Phonon Bottleneck in PbSe and CdSe Quantum Dots: Time-Domain Density Functional Theory of Charge Carrier Relaxation. ACS Nano 2009, 3 (1), 93−99.
(35) Prezhdo, O. V. Photoinduced Dynamics in Semiconductor Quantum Dots: Insights from Time-Domain Ab Initio Studies. Acc. Chem. Res. 2009, 42 (12), 2005−2016.
(36) Pal, S.; Trivedi, D. J.; Akimov, A. V.; Aradi, B.; Frauenheim, T.; Prezhdo, O. V. Nonadiabatic Molecular Dynamics for Thousand Atom Systems: A Tight-Binding Approach toward PYXAID. J. Chem. Theory Comput. 2016, 12 (4), 1436−1448.
(37) Pelzer, K. M.; Griffin, G. B.; Gray, S. K.; Engel, G. S. Inhomogeneous Dephasing Masks Coherence Lifetimes in Ensemble Measurements. J. Chem. Phys. 2012, 136 (16), 164508.
(38) Kobayashi, Y.; Chuang, C.-H.; Burda, C.; Scholes, G. D. Exploring Ultrafast Electronic Processes of Quasi-Type II Nanocryst-als by Two-Dimensional Electronic Spectroscopy. J. Phys. Chem. C 2014, 118 (29), 16255−16263.
(39) Seiler, H.; Palato, S.; Sonnichsen, C.; Baker, H.; Kambhampati, P. Seeing Multiexcitons through Sample Inhomogeneity: Band-Edge Biexciton Structure in CdSe Nanocrystals Revealed by Two-Dimensional Electronic Spectroscopy. Nano Lett. 2018, 18 (5), 2999−3006.
(40) Griffin, G. B.; Ithurria, S.; Dolzhnikov, D. S.; Linkin, A.; Talapin, D. V.; Engel, G. S. Two-Dimensional Electronic Spectros-copy of CdSe Nanoparticles at Very Low Pulse Power. J. Chem. Phys. 2013, 138 (1), 14705.
(41) Norris, D. J.; Efros, A. L.; Rosen, M.; Bawendi, M. G. Size Dependence of Exciton Fine Structure in CdSe Quantum Dots. Phys. Rev. B: Condens. Matter Mater. Phys. 1996, 53 (24), 16347−16354.
(42) Righetto, M.; Bolzonello, L.; Volpato, A.; Amoruso, G.; Panniello, A.; Fanizza, E.; Striccoli, M.; Collini, E. Deciphering Hot-and Multi-Exciton Dynamics in Core−Shell QDs by 2D Electronic Spectroscopies. Phys. Chem. Chem. Phys. 2018, 20 (27), 18176− 18183.
(43) Volpato, A.; Bolzonello, L.; Meneghin, E.; Collini, E. Global Analysis of Coherence and Population Dynamics in 2D Electronic Spectroscopy. Opt. Express 2016, 24 (21), 24773−24785.
(44) Volpato, A.fitko - Global Fit of 2DES data; https://github. com/MUOSColliniLab/fitko.
(45) Kambhampati, P. Hot Exciton Relaxation Dynamics in Semiconductor Quantum Dots: Radiationless Transitions on the Nanoscale. J. Phys. Chem. C 2011, 115 (45), 22089−22109.
(46) Lenngren, N.; Abdellah, M. A.; Zheng, K.; Al-Marri, M. J.; Zigmantas, D.; Žídek, K.; Pullerits, T. Hot Electron and Hole Dynamics in Thiol-Capped CdSe Quantum Dots Revealed by 2D Electronic Spectroscopy. Phys. Chem. Chem. Phys. 2016, 18 (37), 26199−26204.
(47) Trallero-Giner, C.; Debernardi, A.; Cardona, M.; Menéndez-Proupín, E.; Ekimov, A. I. Optical Vibrons in CdSe Dots and Dispersion Relation of the Bulk Material. Phys. Rev. B: Condens. Matter Mater. Phys. 1998, 57 (8), 4664−4669.
(48) Todescato, F.; Minotto, A.; Signorini, R.; Jasieniak, J. J.; Bozio, R. Investigation into the Heterostructure Interface of CdSe-Based Core−Shell Quantum Dots Using Surface-Enhanced Raman Spec-troscopy. ACS Nano 2013, 7 (8), 6649−6657.
(49) Seibt, J.; Pullerits, T. Beating Signals in 2D Spectroscopy: Electronic or Nuclear Coherences? Application to a Quantum Dot Model System. J. Phys. Chem. C 2013, 117 (36), 18728−18737.
(50) Fernée, M. J.; Sinito, C.; Mulvaney, P.; Tamarat, P.; Lounis, B. The Optical Phonon Spectrum of CdSe Colloidal Quantum Dots. Phys. Chem. Chem. Phys. 2014, 16 (32), 16957−16961.
(51) Hameau, S.; Guldner, Y.; Verzelen, O.; Ferreira, R.; Bastard, G.; Zeman, J.; Lemaître, A.; Gérard, J. M. Strong Electron-Phonon Coupling Regime in Quantum Dots: Evidence for Everlasting Resonant Polarons. Phys. Rev. Lett. 1999, 83 (20), 4152−4155.
(52) Liu, A.; Almeida, D. B.; Bae, W. K.; Padilha, L. A.; Cundiff, S. T. Non-Markovian Exciton-Phonon Interactions in Core-Shell Colloidal Quantum Dots at Femtosecond Timescales. Phys. Rev. Lett. 2019, 123 (5), 57403.
(53) Kelley, A. M. Exciton-Optical Phonon Coupling in II-VI Semiconductor Nanocrystals. J. Chem. Phys. 2019, 151 (14), 140901. (54) Volpato, A.; Collini, E. Optimization and Selection of Time-Frequency Transforms for Wave-Packet Analysis in Ultrafast Spec-troscopy. Opt. Express 2019, 27 (3), 2975−2987.
(55) Volpato, A.; Collini, E. Time-Frequency Methods for Coherent Spectroscopy. Opt. Express 2015, 23 (15), 20040−20050.
(56) Ramsay, A. J. A Review of the Coherent Optical Control of the Exciton and Spin States of Semiconductor Quantum Dots. Semicond. Sci. Technol. 2010, 25 (10), 103001.