University of Rome “Tor Vergata” Institute CNR-TAE
University of Rome “Tor Vergata”
Ph.D. course in “Materials for Environment and Energy”
(Cycle XXI)
Investigation on low and high temperature
fuel cell components and their evaluation
in short stack configuration
Giovanni Brunaccini
A.A.: 2008/2009
Supervisor: Director:
Index
Index i
Abstract 1
Introduction 3
Background 3
Advantages of temperature reduction for SOFCs operation 5 Needs for increasing operation temperature in PEMFCs 5
High temperature issues for PEMFC devices 7
Description of the developed activities 8
References 10
Chapter 1 - Experimental characterization of IT-SOFCs in single cell
and stack configuration with different fuels 11 1.1 - Characterization of an innovative single cell based on Ni-doped
Perovskite anode catalyst 11
1.1.1 - Introduction 11
1.1.2 - Experimental 12
1.1.3 - Conclusions 17
1.2 - 1kW planar SOFC stack characterization 17
1.2.1 - Introduction 17
1.2.2 - Hardware description 18
1.2.3 - Testing procedure 21
1.2.4 - Experimental 24
1.2.5 - Natural gas fed SOFC time test 30
1.2.6 - Conclusions 37
1.3 - Catalytic partial oxidation based 1kW planar SOFC stack 37
1.3.1 - Introduction 37
1.3.2 - Stack description and operating procedure 38
1.4 - Results comparison 42
Chapter 2 - HT-PEM stack characterization under significant working
conditions for automotive applications 46
2.1 - Background 46
2.2 - Description of work 46
2.3 - Physico-chemical investigation 47
2.4 - Electrochemical characterization of single cells 48
2.5 - 1kW stack test 51
2.5.1 - Test equipment and process conditions 52
2.5.2 - Performance measurements 53
2.5.3 - Diagnostic procedures to improve stack performance 56 2.5.4 - Torque compression variation to improve contact resistance 58
2.5.5 - Second short stack test 61
2.5.6 - Duty cycle test 71
2.5.7 - Conclusions 73
2.5.8 - References 74
Conclusions 75
List of publications 76
Abstract
Research activities on solid oxide (SOFC) or polymer electrolyte membrane (PEMFC) fuel cells are currently focused on performance and lifetime enhancement as well as costs reduction. These aspects are relevant to make such systems more attractive for the market, both for stationary and automotive applications.
From this point of view, an increase of temperature (for 80°C to 110-120°C) appears necessary for PEMFC technology (high temperature PEMFC, or HT-PEMFC). This would allow more resistance to CO contaminants in the fuel, better thermal and water management and a better efficiency for co-generation.
On the contrary, SOFC technology is moving towards intermediate temperature (IT-SOFC); this would allow cost reduction while developing planar cells, due to less critical construction processes and an increase of stability.
These ways to enhance the fuel cells applications are well studied for single cell but the scale-up process to significant power production devices needs specific investigations. Moreover, different technologies need different field test procedures, tailored on the specific application sectors.
In this Ph.D. thesis, fuel cell devices exploiting either solid oxide or polymer electrolyte technologies, were tested for specific applications. In particular, 1kW fuel cell stacks were tested in order to verify the possibility of fuel cell use in small size applications.
Nowadays, HT-PEMFC devices are creating lot of interest for FC technology development. Anyway, despite a deep knowledge of material properties, the assessment of the new materials at stack level have undergone only few studies. In this research activity this aspect was investigated.
Moreover, IT-SOFC technology is considered valuable for stationary applications and distributed energy production, using cheap fuels and a highly efficient electrochemical process. Nevertheless, for residential energy
consumption, the studied SOFC device can be considered not as a downscaled device for laboratory study, but as the base to develop a complete system.
This Ph.D. thesis involves considerations for both stationary and automotive applications, by analysing fuel cells stack with a size large enough to be considered a proof-of-concept. In other words, the size appears sufficient to investigate main phenomena visible in larger stack oriented to real world applications.
The whole activity can be divided in two lines:
1) tests of HT-PEMFC short stacks that were carried out to evaluate their performance in typical automotive working conditions (current, temperature, humidification, pressure) and to establish an optimal operating point.
2) tests of IT-SOFC stacks in natural gas, in order to evaluate performance decay and its response to detrimental effects due to thermal and redox cycles that can appear in "out of laboratory" usage.
Diagnostic analysis such as current interrupt method and electrochemical impedance spectroscopy completed the study by supplying information about the optimization of stack assembling procedure.
The whole experimental activities were carried out in laboratory, to accurately control the process variables; nevertheless, the recorded performances are anyway meaningful with respect to real world applications, once defined tailored working conditions by a good compromise between performances and costs.
Introduction
BackgroundSustainable energy sources are now attracting great interest, mainly due to the aspects related to environment protection and energy saving. Among the various energy conversion technologies, Fuel Cells (FCs) seem to be effective conversion devices thanks to their high efficiency electrochemical processes, which are independent on the Carnot thermodynamic efficiency limitation, with respect to internal combustion engines [1]. Among the FCs, two technologies are considered particularly interesting for small size applications, the Polymer Electrolyte Membrane Fuel Cells (PEMFCs) and the Solid Oxide Fuel Cells (SOFCs). These two technologies work in very different temperature ranges (typically 40 to 90°C for PEMFCs and 800 to 1000°C for SOFCs), fed with different fuels, and with different needs for working condition control apparatus. These technologies show different advantages and drawbacks and, as a consequence, they must be tailored to be suitable for different fields of applications.
The main physical and working parameters can be summarised as follows in Table 1:
Fuel Cell Technology PEMFC SOFC
Electrolyte material Polymer Ceramic
Catalyst Pt based Ni based
Anode fuels Hydrogen
Hydrogen, hydrogen-CO mixtures, low-weight hydrocarbons, natural gas (desulphured) Poisoning fuel
impurities CO, Sulphur Sulphur
Typical temperature
range 40 – 90°C 800 – 1000°C
Start-up time < 1min Few hours
Sensitivity to thermal cycles
Devices can be switched on and off
several times
Only few thermal cycles can be imposed
Power density 450 – 500 mW/cm2 300 – 350 mW/cm2
Table 1: Physical and electrochemical parameters to describe working conditions for PEMFCs and SOFCs
With reference to the fuels used to feed these kind of cells, SOFC devices offer the possibility of internal gas reforming. Reforming reactions convert the mixture flowing at the system gas inlet in a hydrogen rich stream, capable of supplying the stack with only minimum carbon deposition probability. This process (that, if needed, is done in external reactors for PEMFCs) reduces the overall size (and cost) of turnkey systems. On the contrary, strict requirements include the necessity of full removal of sulphur and sulfated compounds, because, according to the state-of-the-art technology, even a small content of these substances damage the cells and reduce the device lifetime [2].
In order to convert the intrinsic potential of fuel cell devices in market attractive turn-key systems, the above mentioned drawbacks must be mitigated.
One of the possible ways to reduce costs and technical problems to put these devices in the market is the extension of their operative temperature range, this action would bring appreciable advantages for both considered technologies. This
procedure leads to the study of so-called Intermediate Temperature SOFCS (or IT-SOFCs) [3] and High Temperature PEMFCs (or HT-PEMFCs) [4].
Advantages of temperature reduction for SOFCs operation
Concerning with SOFCs, high operation temperatures lead to the use of high quality and expensive steel for the fabrication process of stack plates, due to the need of avoiding plates oxidation during operation. For commercial viability of a small size SOFC devices in residential applications, the stack contribution to the total cost is usually considered about 30% of the complete system. In order to achieve such a target, the degradation rate of the device's components needs to be taken into account. For this reason, decreasing operating temperature helps to satisfy market requirements, by allowing for a replacement of traditional oxidation resistant alloys with cheaper ferritic stainless steels. This replacement is valid both for plates and current collectors. Secondly, planar technology is expected to reduce costs by using a simplified construction process like tape casting of the cells [5].
Moreover, high temperature implies higher energy requirement during the start-up phase, by using more power to bring the stack at the right temperature and a more expensive insulation chamber in order to maintain temperature and to avoid electromagnetic interference (from thermal irradiance) on the control system. Finally, the higher is temperature the higher is the mechanical stress at the electrode/electrolyte interface (due to the different volume variation coefficient for different materials), especially for large planar cells that are considered well promising for cost reduction in a mass market.
For these reasons, a diminution of the operating temperature is a first step to make this kind of device more attractive for the market, because higher electrochemical stability of materials assures longer lifetime of the devices.
On the other hand, high temperature allows the utilization of cheap electrocatalysts (like nickel that shows good catalytic activity for H2 and CH4
only at high temperature); so, while operating at lower temperature, it is necessary to assess the performance of the device under test.
In this thesis work, both new SOFC materials and stack devices were tested under different conditions.
Needs for increasing operation temperature in PEMFCs
Similarly to SOFC systems, a higher temperature range is desirable for PEMFCs for different reasons.
Firstly, for cogeneration applications, the heat produced at high temperature is characterised by higher exergy content [5]. The heat transfer is, in fact, proportional to the temperature gradient from the source (the fuel cell) to the drain (the external plant).
The effect on the overall cost reduction is due to the higher reachable efficiency; in fact, the electrochemical reaction of H2 oxidation for electrical power
production is exothermal and the hot water produced at the cathode of the stack can be used in a heat exchanger to improve the conversion efficiency (from fuel to electrical power and heat) of the cell.
Moreover, at higher temperature, PEMFC stacks show a better resistance to contaminants in the fuel [6]; in fact, CO content (due to the no ideal operation of the hydrocarbons reforming systems) in H2 causes deactivation of the anode
catalyst in the long run. This phenomenon happens because the typical catalyst for PEM fuel cells is platinum; Pt atoms adsorb CO and, as a consequence, the number of active sites to allow the adsorption of H2 decreases, affecting the cell
performance.
The adsorption process of CO on Pt is more significant at low temperature (about 80°C) and decreases at higher temperature [7]. In particular, moving from 80°C to 130°C, the tolerance to CO presence in a PEM stack grows from 10 to 1000ppm. This feature allows for the utilization of H2 produced by means of a
reformer without any extra purification methods and with significant cost reduction in out-of-laboratory applications.
At low temperature, the poisoning effect can be made milder if O2 is added in
the fuel stream or if advanced catalysts (resistant to CO poisoning) are used. Anyway, the former action causes fuel utilization reduction, the latter obligates to use experimental materials not available in commercial device in short term.
From the kinetic point of view, high temperature positively affects the reversible potential and the slope of the Tafel equation, but it has negative effect on the OCV value.
In general, the reversible potential variation due to a temperature variation is described by the Nernst equation:
nF S T Erev ∆ = ∂ ∂
at a given constant pressure. For a fuel cell fed with hydrogen and air, the right-hand side of this equation is strongly negative below 100°C; on the contrary, above 100°C the produced water is present as steam, and the entropy variation is lower.
In contrast over 100°C, OCV value, that includes the voltage drop due to activation effects, is lowered by the increased value of the H2O pressure in the
expression: + = O H O H rev p p p F RT E OCV 2 2 2 * ln 2 .
Another temperature effect on the Tafel equation is the increment of the exchange current density (io) from low to higher temperatures for Nafion based
membranes [9], about 30 times for a 40°C temperature increment.
Furthermore, while a PEMFC device is working at a temperature over 100°C, the risk of flooding phenomena is reduced thanks to the water evaporation; on the contrary, the dehydration could increase due to the heat production and, as a consequence, the proton conductivity of the membrane decreases. A dramatic decrease of the conductivity is typically experienced below 30% R.H.
Secondly, in the long term, deep variations of water content may lead to mechanical stress of the membrane, due to subsequent swelling and shrinking phenomena.
For commercial applications (for which PEMFCs are still too expensive [10]), the cost reduction comes also with the presence of cheaper and simpler thermal management systems. From this point of view, the heat produced by the electrochemical reaction and the Joule effect in the device, is as more easily moved away from the cells as higher is the temperature gradient toward the ambient temperature. Hence, at higher temperature, a higher amount of heat is moved away and a less severe control on the thermal management can be implemented, with a consequent size and cost reduction for the cooling system.
High temperature issues for PEMFC devices
Despite the above described enhancement achieved by increasing temperature, some critical factors must be considered. As the proton conductivity of the membrane is reduced at low relative humidity, the evaporation of water content into the membrane lead to a major issue when cells operates over 100°C [11]. In practical applications, commonly used Nafion membranes show dehydration when operated at temperature over 90°C.
Moreover, the thermal management system must control the temperature distribution within the device. In particular, high temperature can cause the creation of hot spots on the membrane, leading to extra mechanical stress or local dehydration with subsequent deformation and damage. This causes a reduced lifetime of the devices and increasing costs.
Moreover, the effect of possible degradation of components into the device must be assessed during high temperature operations. The degradation of a single component (catalyst, catalyst support, electrode) affects the overall performance of the device and the related lifetime. Typical degradation can be attributed to catalyst support corrosion (that reduces catalyst stability) and to catalyst dissolution.
Description of the developed activities
Concerning with IT-SOFCs, two 1kW commercial stacks were characterised in H2 and in (desulfurized) natural gas (NG), in order to evaluate the performance
characteristics and to identify the main problems related to the scale-up process. Materials investigation was carried out at the level of cell. According to the state-of-the-art and commercial forecast, planar cell technology was selected.
The tests, carried out under different conditions, allow to derive useful information for the selection of auxiliary devices during the engineering process while developing a complete SOFC power generation system around the stack.
The aim is to assess SOFC performance both in H2 and NG (mainly CH4).
Obviously, better results are expected in H2 than in NG; anyway, natural gas, that
unlike hydrogen is already available to residential users without any modification of the current gas distribution infrastructure, can be directly fed into SOFC devices that operate in the internal reformation mode.
Hence, for the short/mid term exploitation, NG performance are more important for mass market distribution, and H2 is to be considered as an ideal
target for the tested technology. Moreover, exhaust gas emissions can be recycled in advanced applications using them as heating input for absorption heating and cooling systems.
The second part of this work deals with HT-PEMFCs, a 1kW short stack (6 cells) was tested under automotive relevant conditions. A wide range of temperatures was investigated (from 30°C to 130°C) and pressure as well, in order to find optimal operating conditions. Moreover, the assembling process was optimised. Diagnostics was performed by Current Interrupt Method (CIM), Electrochemical Impedance Spectroscopy (EIS) and hydrogen crossover tests. Relationships between stack components characteristics and electrochemical behaviour were investigated.
References
[1] Kunze, J; Stimming, U. - Angewandte Chemie International Edition Volume: 48, Issue: 49, November 23, 2009, pp. 9230-9237
[2] Nyqvist, R.G.; de Bruijn, F.A.; Stobbe, E.R. - Journal of Power Sources Volume: 159, Issue: 2, September 22, 2006, pp. 995-1004 de Wild, P.J.; [3] Huijsmans, J.P.P.; van Berkel, F.P.F.; Christie, G.M. - Journal of Power
Sources Volume: 71, Issue: 1-2, March 15, 1998, pp. 107-110;
[4] Mallant, Ronald K.A.M. - Journal of Power Sources Volume: 118, Issue: 1-2, May 25, 2003, pp. 424-429
[5] Saidi, M.H.; Ehyaei, M.A.; Abbasi, A. - Journal of Power Sources Volume: 143, Issue: 1-2, April 27, 2005, pp. 179-184
[6] Scott, K.; Shukla A.K.; Reviews in Environmental Science & Bio/Technology (2004) 3:273-280
[7] Zhang, Jianlu; Xie, Zhong; Zhang, Jiujun; Tang, Yanghua; Song, Chaojie; Navessin, Titichai; Shi, Zhiqing; et. al. - Journal of Power Sources Volume: 160, Issue: 2, October 6, 2006, pp. 872-891
[8] Das, Susanta K.; Reis, Antonio; Berry, K.J.;Journal of Power Sources Volume: 193, Issue: 2, September 5, 2009, pp. 691-698
[9] Parthasarathy et al. - J of electr.soc. – 1992
[10] Scholta, J.; Berg, N.; Wilde, P.; Jörissen, L.; Garche, J.; Journal of Power Sources 127 (2004) 206–212
[11]Licoccia, S.; Traversa, E.; Journal of Power Sources Volume: 159 (2006), pp. 12-20.
Chapter 1
Experimental characterization of IT-SOFC in single cell
and stack configuration with different fuels
1.1 - Characterization of innovative single cell based on
Ni-doped Perovskite anode catalyst
1.1.1 - Introduction
The direct oxidation of hydrogen and hydrocarbons in intermediate temperature solid oxide fuel cells (IT-SOFCs) has been intensively investigated due to the high intrinsic efficiency of the direct electrochemical oxidation process.
A significant attention has been focused on hydrogen and methane electro-oxidation by using electrocatalysts such as Cu/CeO2, Ni-Cu and various
perovskites [1, 2]. Encouraging results have been achieved at temperatures below 800°C, especially in the presence of ceria electrolyte.
Some attempts have been addressed to the direct oxidation of hydrogen and larger molecular weight hydrocarbons [1]. It has been observed that the kinetics of direct electrochemical oxidation of propane is slower than methane and, moreover, it is more affected by the cracking process producing carbon fibres on the anode surface, especially in the case of Ni-based catalysts. The formation of carbon deposits also occurs under steam reforming conditions at intermediate temperatures. Accordingly, it appears necessary to investigate alternative catalysts
for both direct electro-oxidation and steam reforming of propane in IT-SOFCs. Recently, several investigations have been addressed to the use of Ru as
promoter of anodic processes in SOFCs [3-4]. Yet, the high cost of Ru suggests searching for an alternative catalyst formulation with similar activity at intermediate temperatures.
In this work, efforts were focused on the investigation of the effect of Ni in combination with La0.6Sr0.4Fe0.8Co0.2O3 and ceria (Ni-LSFCO/CGO) as oxidation
catalyst for propane in intermediate temperature SOFCs.
In order to evaluate the characteristics of this catalytic system propane direct electro-oxidation process has been evaluated in a ceria-electrolyte supported single cell.
1.1.2 - Experimental
Based on a Ni-LSFCO/CGO anode catalyst, a button cell, whose area is 1cm2,
was prepared at CNR-ITAE.
It consisted of 3 layers listed in Table1.1:
Layer Composition Thickness [µm]
Anode Ni-LSFCO 70%
CGO 30% 15
Electrolyte CGO 250
Cathode LSFCO/CGO 15
Table 1.1: Cell components description. Noticeable are the Ni-LSFCO used as anode catalyst and a 250µm thick electrolyte layer
After mounting the cell on an alumina tube, it was heated up to 800°C in He stream. At 800°C, the gas was switched to H2 and suddenly as the potential
reached the OCV it was switched to 500 mV preventing an extensive reduction of perovskite. Subsequently, the anode was fed with dry propane under working condition at 500 mV. It is inferred that during its operation in the SOFC, the Ni-LSFCO anode is not subjected to strong reducing conditions for prolonged times. The reducing environment at the anode is mitigated by both the cell potential fixed at 500 mV and the mixed electronic/ionic conduction of CGO electrolyte that does not allow it to reach high OCV associated with a very low oxygen partial pressure at the anode. Electrochemical polarizations and ac-impedance measurements were performed on electrolyte supported single cells at 800°C by using an AUTOLAB PGSTAT30 Metrohm potentiostatic frequency-response analyzer equipped with 20A booster. Gold wires were used as current collectors
for the cell. A thermocouple was positioned close to the cell. Impedance spectra were obtained in the frequency range from 10 mHz to 1 MHz with applied ac-voltage amplitude of 10 mV rms. All impedance measurements were taken under open circuit conditions and 500 mV.
Although LSFCO perovskite is not stable in the presence of methane (in out-of-cell measurements), it improves its stability during SOFC operation in a CGO based cell due to the mild anodic reducing conditions [5]. It is pointed out that the strong reducing conditions in the presence of hydrocarbons in the out of cell experiment are significantly alleviated during SOFC operation thanks to oxygen pumping effect from the cathode to the anode. AC impedance analysis of the SOFC cell operating in the presence of H2 in the range 700-800°C, reported in
Figure1.1, under working conditions (500 mV) shows appropriate polarization resistances essentially above 700°C. The Rs decreases from 0.43 Ωcm2 at 700°C to
0.25 Ωcm2 at 800°C. These ohmic losses are due to the supporting 250 µm
membrane electrolyte. Polarization resistance is lower than 0.3 Ωcm2 at 750°C.
0 0.05 0.1 0.15 0.2 0.25 0.3 0.35 0.4 0.2 0.3 0.4 0.5 0.6 0.7 0.8 0.9 1
Z' / ohm cm
2-Z
''
/
o
h
m
c
m
2700°C
750°C
800°C
Figure 1.1: AC impedance analysis of the SOFC cell operating in presence of H2 between
700°C-800°C under working conditions (500mV), shows appropriate polarization resistances
essentially above 700°C. The Rs decrease from 0.43 Ωcm2 at 700°C to 0.25 Ωcm2 at 800°C.
In Figure 1.2, polarization curves carried out in H2 show that the maximum
power density increases with temperature (421 mWcm-2 at 800°C) whereas the
OCV decreases due to the electronic conduction of CGO [6].
The performance of perovskite anodes in the presence of methane feed has been previously investigated [5]. In the present work, the attention is addressed to operation of the anode with propane. Impedance spectra were carried out at 800°C after different operating times of the cell in the presence of dry propane at open circuit voltage conditions. Figure 1.3 shows that the initial resistance in propane is larger than in H2 (0.32 vs. 0.25 Ωcm2). Possibly, after the switch to H2, the
electrode is partially reoxidized due to a decrease in reducing conditions. During operation, the increasing depth of the reduction process and possibly a small amount of carbon deposition on the catalyst causes decrease of both ohmic and polarization resistances practically achieving the same results obtained in hydrogen, i.e. Rs= 0.25 Ωcm2 and Rp=0.07 Ωcm2 at 800°C. The observed Rp value
in propane at 800°C (0.10 Ωcm2 at 0 hrs and 0.07 Ωcm2 after 101 hrs), indicate
suitable reaction rates.
0
0.1
0.2
0.3
0.4
0.5
0.6
0.7
0.8
0.9
0
0.4
0.8
1.2
1.6
2
Current density / A cm
-2V
o
lt
a
g
e
/
V
0
0.05
0.1
0.15
0.2
0.25
0.3
0.35
0.4
0.45
P
o
w
e
r
D
e
n
s
it
y
/
W
c
m
-2700°C
750°C
800°C
Figure 1.2: Polarization curves carried out in H2 show that the maximum power density
increases with temperature (421 mWcm-2 at 800°C) whereas the OCV decreases due to the
0
0.03
0.06
0.09
0.12
0.2
0.25
0.3
0.35
0.4
0.45
Z' / ohm cm
2-Z
''
/
o
h
m
c
m
2 0h 5h 23h 101hFigure 1.3: AC impedance analysis of the SOFC cell operating shows initial resistance in
propane is higher than in H2 (0.32 vs. 0.25 Ωcm2). After operation it become comparable to the
one observed in H2, i.e. Rs= 0.25 Ωcm2 and Rp=0.07 Ωcm2 at 800°C. The observed Rp values in
propane at 800°C (0.10 Ωcm2 at 0 hrs and 0.07 Ωcm2 after 101 hrs) indicate suitable reaction
rates.
Figure 1.4 shows polarization curves in dry propane feed at 800°C after different operating times of the cell. A maximum power density of about 300 mW/cm2 was obtained after 101 h of lifetime. Both polarization and impedance
spectra indicate that the direct electro-oxidation of propane can be suitably performed in the temperature range of 800°C. The output power density of the present device (300 mWcm-2 at 800°C) is mainly affected by ohmic drop and low
OCV, essentially related to the electrolyte membrane thickness and electronic conduction than to the catalyst properties.
No evident carbon deposits or tar formation was observed on the anode surface after cell shut down. Some amount of carbon was present in the wall of the alumina tube and a pitchy fluid apparently came out from the anode compartment during cell operation.
0
0,1
0,2
0,3
0,4
0,5
0,6
0,7
0,8
0,9
0
0,3
0,6
0,9
1,2
1,5
Current density / A cm
-2V
o
lt
a
g
e
/
V
0
0,05
0,1
0,15
0,2
0,25
0,3
0,35
P o w e r D e n s it y / W c m -2 0h 5h 23h 101hFigure 1.4. Polarization curves at different times in propane at 800°C. Both polarization and impedance spectra indicate that the direct electro-oxidation of propane can be suitably performed in the temperature range of 800°C. The output power density of the present device
(300 mWcm-2 at 800°C) is mainly affected by ohmic drop and low OCV, essentially related to
the electrolyte membrane thickness and electronic conduction than to the catalyst properties.
Clearly, the performance of the present SOFC may be greatly enhanced if a thin electrolyte is used (reducing ohmic drop) and if the CGO electrolyte membrane is replaced by another electrolyte characterized by a higher ionic transport number under such conditions. In fact, high ohmic drop and low OCV affect the performance of the present SOFC device. Whereas, the polarization resistances in dry propane were quite promising and indicate that this catalyst can properly operate without the need to use noble metals like Ru, Rh, etc. to promote the oxidation process. As well known Ni promotes the C-H bond scission and thus, the direct oxidation but, during hydrocarbons operation, it also significantly increases the probability of irreversible deposition of carbon species at the surface blocking the catalytic sites with time.
Breaking of the carbon-hydrogen bond is considered to be the activation step in the direct oxidation process [8] followed by removal of the adsorbed species by O2- ions. Long term operation of Ni under dry operation is questioned, as
has been identified as a suitable oxidation catalyst for both H2 and methane [9].
The rate determining step on this oxide catalyst presently appears to be related with the scission of C-H bond the combination of highly dispersed Ni with a highly electronic/ionic conductor such as LSFCO perovskite, significantly reduces the carbon deposition under mild anode reducing condition in the presence of CGO.
1.1.3 – Conclusions
Direct oxidation of hydrogen and propane on a Ni-LSFCO/CGO electro-catalyst has been investigated at intermediate temperatures (800°C) in a CGO electrolyte supported cell [10]. The measured electrochemical performances were affected by low OCV, whereas interesting polarization resistances were recorded.
No carbon deposit was observed in the catalyst discharged after operation of the anode under mild reducing condition in a SOFC. The achieved performance for hydrogen and propane oxidation are both acceptable even in the presence of a thick electrolyte membrane. However, the electric efficiency is still not appropriate (the maximum power density is achieved at about 500 mV). It is envisaged that an increase of electric efficiency may be achieved by improving the reversibility of the process (i.e. decreasing the polarization resistance) and reducing the ohmic resistance while maintaining mild reducing conditions at the anode that are essential to preserve the perovskite structure.
1.2 - Steam reforming based 1kW planar SOFC stack
1.2.1 - Introduction
Based on the results of studied materials, an intermediate temperature SOFC stack was built and tested, in order to evaluate the reachable performance when a scale up is applied to the button cells. Moreover, the characterization of stacks is an intermediate step to the prototype production of a turn-key fuel cell system.
From this point of view, a 75 solid oxide fuel cell stack was tested both in hydrogen and in methane from natural gas. The work is intended to give a high
repeatability stack study with particular attention to power performance in different operating conditions in order to extend stack life time. The achieved stack power was higher than 1 kW in hydrogen and about 0.98 kW in natural gas.
An accurate conditioning procedure was accomplished in order to avoid cracks in the cells, electrode delamination and anode catalyst reoxidation. A few thermal cycles were performed. This study allowed to evaluate the performance and efficiency of planar SOFC cells based stack. The time study indicated proper stability for the device operation even in the presence of thermal cycles.
1.2.2 - Hardware description
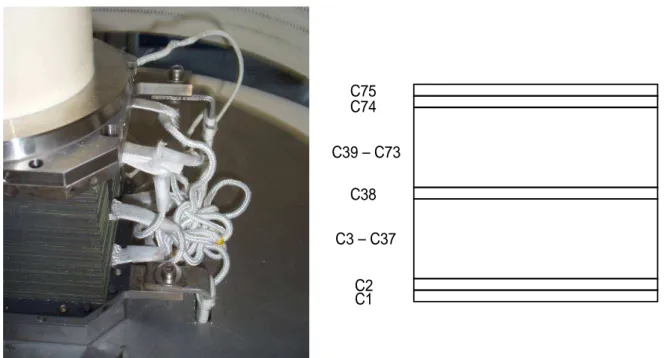
The tested stack (visible in Figure 1.5a) was composed of 75 SOFC planar (9.6x9.6 cm2) cells and was equipped with 8 voltage probes to sample the voltage
of 7 groups of cells.
In particular, the first two, the central cell (cell #38), and the last two cells were individually monitored, in addition the remaining ones were sampled as two 35-cell substacks each.
C1 C2 C3 – C37 C38 C39 – C73 C74 C75
Figure 1.5: (a) 1kW SOFC stack tested in this work - (b) sketch of the voltage probes distribution to sample single cell and substack voltages
The test bench (shown in Figure 1.6) was equipped with specific hardware to control stack temperature, gas flows and to apply a variable electric load.
Particular attention was paid to guarantee complete insulation of the current collectors of the stack from each other and from the test bench chassis; to achieve this condition, the insulation of the power input terminals of the electronic load were checked.
High temperature insulating gaskets were used to separate the cathode compartment from the test bench chassis ground to avoid short circuit effects that would have brought the single cells operating point too low, i.e. under conditions where Ni easily reoxidizes at the anode. On the other hand, the anode electrode was separated from the chassis ground by a long alumina cylinder, this is because the upper side of the stack undergoes the pressure of the mechanical load to maintain the cells in row tightly close each other without any leakage.
(b)
(a) (c)
Figure 1.6: The used test rig (a) and a close-up on gas pre-heaters (b) and electrical furnace (c)
Due to the high pressure of the mechanical load, in order to avoid strains and bending of the steel slab supporting the furnace basement, the system was provided with a pair of rigid steel wired rods to finely regulate a counter pressure.
Moreover, to deal with natural gas, the plant was equipped with a pre-reformer to convert hydrocarbons heavier than methane (e.g. propane) that can poison the anode catalyst by forming carbon deposits.
Natural gas was fed by pre-reforming it in a dedicated catalytic converter operating in the range 350 - 450 °C. The output gas flow was regulated (at the input of test bench) with a mass flow calibrated as for CH4; according to the gas
analysis, it was determined that the most part of the feeding gas was methane. The gas mixture coming from the pre-reformer was supplied to the anode compartment thanks to the internal reforming occurring into the stack. This process enriched the hydrogen content of the mixture by converting the CH4 in H2
and CO2 through the reaction of steam reforming and possibly a subsequent water
gas shift [11]:
CH4 + H2O CO + 3H2
CO + H2O CO2 + H2.
Thus, for each mole of CH4 in the natural gas stream, 4 moles of H2 are
obtained.
In the whole process, steam reforming reaction is strongly endothermic, whereas water gas shift reaction is exothermic. Thus, a part of heat required was provided by the latter reaction, and lower electrical heating power was required while feeding the cathode compartment with air. Moreover, steam reforming is characterised by a minor sensitivity to thermodynamic conditions (with respect to dry reforming) for carbon formation, thanks to the higher hydrogen/carbon ratio, and converts natural gas in a mixture with quite high hydrogen concentration. Anyway, for turnkey systems, the necessity of finely regulate the steam content of anode stream leads to higher costs and control hardware complexity.
During the laboratory tests, a humidifier was used to add the correct amount of water steam, and a steam-to-carbon ratio (S/C) always larger than 2 was imposed. As described later, different values were attempted, in order to find a compromise between voltage stability and performance.
The test stand was equipped with a humidifying device containing deionized water, that, in turn, (by evaporation) provide the gas with a saturating amount of
steam, according to the desired steam/carbon ratio. The temperature of deionized water was automatically regulated and, to avoid the presence of liquid droplets in gas stream, the steam was accordingly introduced only when the correct temperature was reached. This control, based on the water temperature, acts accordingly to psychrometric tables and equations, so that, only the needed water steam is dragged by anode gas stream.
This is necessary because, if not enough steam is present (unless oxygen is added) the Boudouard reaction [11] could occur and give the equilibrium:
2CO CO2 + C,
partially converting CO into carbon, deactivating catalyst and affecting the cell performance.
1.2.3 – Testing procedure
A double step test was carried out: in the first step, only hydrogen was used to feed the stack, in order to set a benchmark for the natural gas test performance, that was the subject of the second step of the procedure.
The whole test procedure was divided into 7 subprocedures to be executed in a row. This was useful both to verify the correct fulfillment of each operation before the begin of the subsequent one, and to adapt the test sequences to the software provided with the test bench. Moreover, in case of any failure or malfunctioning of the system, the manual intervention is generally faster and less dramatic on the overall procedure.
The needed sub-procedures were identifiable as follows:
• Stack positioning,
• Leakage tests,
• Start-up and conditioning,
• Experimental measurements and characterization in hydrogen,
• Flows switch from hydrogen to natural gas,
• Experimental measurements and characterization in natural gas,
• Shut-down
The start-up procedure included the positioning and slow increase (up to 600 kgf) of a mechanical load to assure the tightening of the sealing gaskets between cells. Afterwards, anode and cathode gases are begun to flow and heat up together with the furnace at 200 °C/h.
A first gas reduction was operated as the 650 °C temperature target was reached. In steps, the conditioning mixture (5% H2 in N2) was converted into an
intermediate mixture (up to about 33% H2 in N2).
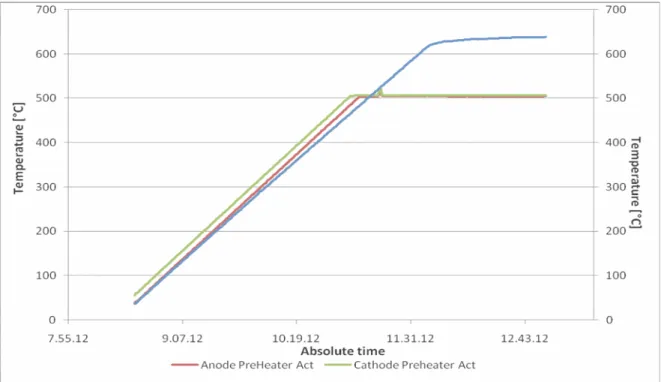
The described heating up procedure is shown in Figure 1.7:
Figure 1.7: Preheating procedure at controlled temperature rate for feeding gases and furnace.
The stack was heated at 200°C/h to avoid thermal shocks to the cell that would have given damage due to the different volume mechanical expansion coefficient for temperature variation ath the electrode/electrolyte interface. This makes the startup procedure particularly long for SOFC technology. Gases were provided at 500°C, so that the cathode air flow was regulated in orde to find a compromise between temperature decreasing due to the flow and the necessity of high flow rate to have a uniform temperature distribution within the stack and to avoid limitations at high current load.
The conditioning procedure continued until temperature reached 750 °C, after that the gases were imposed at the regime flows:
H2 flow: 2250 Nl/h (37.5 slpm), N2 flow: 1500 Nl/h, Air flow 4000 Nl/h.
From these data it is possible to calculate the stoichiometric coefficient for both anode and cathode; in particular at the maximum current value (20 A), this value, for the anode compartment (fed with H2), is:
min 1200 min 60 * 20 20 20 s C s C s C A= = = i.e. mol l l mol eq eq C C H 414 . 22 min * 2 * 96486 min 1200 2 Φ =
This calculus is for one cell only, for the whole stack it must be:
min 44 . 10 75 * 96486 * 2 414 . 22 * 1200 2 l cells H = ≈ Φ .
Hence, the stoichiometric coefficient is 37.5/10.44 = 3.59. For the cathode compartment:
mol l l mol eq eq C C O 414 . 22 min * 4 * 96486 min 1200 2 Φ = ,
as the oxygen in air is about 21%, ΦO2 =0.21*ΦAir, so:
min 88 . 24 75 * 21 . 0 * 96486 * 4 414 . 22 * 1200 l cells Air = ≈ Φ ,
Hence, the stoichiometric coefficient is 66.7/24.88 = 2.68.
These final flow values were set through a logarithmic gas supply reduction procedure, (i.e. with time intervals that become shorter while increasing hydrogen flow) started once the stack temperature reached an average value of 650°C.
In order to detect the correct behavior of the stack while varying the feeding mixture, the OCV was recorded and reported in Figure1.8. It was noticed a regular increment of the OCV in time, while increase the H2 concentration in N2, due to
allowed the anode compartment to undergo a deep reduction and hold good conductivity of the metallic component of the anode layer.
Riduzione logaritmica dei gas
58 59 60 61 62 63 64 65 0 10 20 30 40 50 60 70 Tempo [min] O C V [ V ] H2/N2 2% H2/N2 3% H2/N2 4% H2/N2 5%
Logarithmic gas reduction
Time [min] O C V [ V ]
Riduzione logaritmica dei gas
58 59 60 61 62 63 64 65 0 10 20 30 40 50 60 70 Tempo [min] O C V [ V ] H2/N2 2% H2/N2 3% H2/N2 4% H2/N2 5%
Logarithmic gas reduction
Time [min] O C V [ V ]
Figure 1.8: OCV variation while increasing H2 concentration (from 2% up to 5%) in N2 during stack
conditioning, the procedure was carried out in steps with a duration variable according to a logarithmic time law.
1.2.4 - Experimental
To have a uniform distribution of temperature through the stack, a 10 A current was drained for about 30 min.
A first polarization test was performed to verify the capability of the stack of achieving the nominal 1kW power. During this test the load control mode was galvanostatic and a 16A current was drained. The overall stack voltage at each selected load is shown in Figure1.9.
Polarization test @ 760°C
gas flows: Anode mix 3750 Nl/h (60% H2 - 40% N2) - Cathode air 4000 Nl/h gas pressure = 1 bar abs
50 55 60 65 70 75 80 85 0 2 4 6 8 10 12 14 16 18 Current [A] S ta c k V o lt a g e [ V ] 0 200 400 600 800 1000 1200 S ta c k P o w e r [V ] VOLTAGE POWER Pmax = 1018 W V = 63.7V
Figure 1.9: First polarization test to verify the capability of reaching the nominal power (1kW) in H2.
The expected power was generated at 16A, and the corresponding stack voltage was 63.7V.
To verify that every cell was properly working, the single cell (or ministack, according to the measurement sketched in Figure 1.5b) voltages were recorded and plotted in Figure1.10. In Figure1.10, it is visible a lower voltage in cell #75, on the cathode side, this is attributable to the high air flow entering the stack at a temperature lower than the cells.
After OCV stabilization, the stack underwent a second polarization test in H2
as a benchmark to evaluate the performance in NG.
The benchmark results were extracted by performing a polarization curve from 0 to 20 A that is shown in Figure 1.11.
Single cell and ministack voltages during first polarization test Tstack = 760°C - p = 1 bar abs.
0.00 0.20 0.40 0.60 0.80 1.00 1.20 0.00 2.00 4.00 6.00 8.00 10.00 12.00 14.00 16.00 18.00 Current [A] V o lt a g e [ V ] 0.00 7.00 14.00 21.00 28.00 35.00 42.00
Cell#1 - anode side Cell#2 Cell#38
Cell#74 Cell#75 - cathode side Cell#3-#37 ministack Cell#39-#73 ministack
Figure 1.10: Single cell voltages recorded during first polarization test, the differences between cell voltage are not particularly significant. The lowest voltage of the cathode nearest cell may be attributable to the lower temperature in correspondance to a high a high air flow at lower temperature than the stack.
Figure 1.11: Second polarization test: OCV = 85V, P_max = 1170 W @20 A.
The observed OCV in hydrogen was 85.0 V. The recorded power reached a maximum value of 1170 W (measuring a voltage of 58.5 V @ 20 A), it is shown in Figure 1.11.
Before switching the gas mixture from H2 to NG, the stack was loaded with a
10A constant current for 24 hours. In order to verify the correct operation in the presence of favorable feeding conditions. At the end of this procedure, a second polarization test was accomplished. The best power performance was reached, by recording a value of 1248W (corresponding to 62.43V) at 20A and a OCV = 81.58V. The IV curve and the power curve are reported (along with the ones recorded later in NG) in Figure 1.12.
IV curves for first stack in H2 and NG during first thermal cycle
40 45 50 55 60 65 70 75 80 85 90 0 2 4 6 8 10 12 14 16 18 20 Current [A] S ta c k v o lt a g e [ V ] 0 150 300 450 600 750 900 1050 1200 1350 1500 S ta c k p o w e r [W ]
H2 fed IV curve NG fed IV curve H2 fed stack power NG fed stack power OCV = 81.58V OCV = 72.0V Maximum power in H2 anode stream = 1248 W Maximum power in NG anode stream= 974 W Voltage at maximum power in H2 = 62.43V Voltage at maximum power in NG = 48.7V Tstack = 760°C p = 1 bar abs
Figure 1.12: IV and power curves in hydrogen and natural gas recorded during the first thermal cycle. The stack reached very good performance with a maximum power value in H2 of 1248W (62.43V @
20A) and 974W in NG (48.7V @ 20A).
Once come back to 0A and after stabilizing the OCV value, the H2 to natural
gas switch was done.
Direct use of hydrocarbon fuels in SOFC stacks shows the problem of carbon deposition on a nickel based anode [12]. Carbon deposition reduces both catalyst activity and electrical conductivity; if carbon deposits create a layer, the gases will
be prevented from reacting. Moreover, carbon deposition produces mechanical strains on the anode structure and, as a consequence, the risk of cell damage.
To overcome these problems a gas pre-processing is usually applied. This can be done by an external device performing the fuel reaction with oxygen or water steam (respectively named as dry or steam reforming) and, at the outlet of the devices, a mixture of H2, CO, CO2, CH4 and H2O is collected. This device increases
costs and complexity of the system.
For this stack, a two step reforming is suggested to work with natural gas. In the former step the above mentioned pre-reforming was applied; in the latter, internal steam reforming of CH4- and H2-rich mixture was performed.
As the reforming process is endothermic, it needs heating to be accomplished. For turnkey systems, the necessary heat is usually provided by the combustion of exhaust gases at the outlet of the stack to heat up the steam and fuel.
Due to the presence of the external pre-reforming, in this test, before starting the procedure, desulphurization and pre-reformer sections were started and set to the temperature regime conditions (respectively 330 °C and 450°C).
Moreover, the H2 and CH4 rich gas mixture exiting from the pre-reformer
was used to feed the stack.
Three different values of steam content were used to evaluate the achievable performance with carbon deposition avoided by catalytic steam reforming, the related polarization tests are reported in Figure 1.13.
Figure 1.13: Polarization test in natural gas at variables steam content.
To investigate the effect of the variation of air stoichiometry, a steady current test was carried out. The air flow variation is shown in the following Table 1.2:
Air flow[slpm] Voltage [V] Stack Temp. [°C] 66.7 52.4 756 83.3 51.6 756 100.0 49.7 756 116.7 46.5 755 133.3 42.5 753 100.0 43.6 751 66.7 47.2 751
Table 1.2: Recorded stack voltages and temperatures at different air flows.
A slight temperature variation was observed, but the stack voltage appeared to have significant sensitivity to the excess of air. This flow caused a rapid cooling of cathode feeding gas. As a compromise, it was chosen an air flow of 66.7 slpm corresponding to a stoichiometry of 2.7 at 20 A.
1.2.5 – Natural gas fed SOFC time test
A 161 hour (about one week) time test was carried out by draining a 14 A constant current. During this test, the stack continuously produced about 730W (i.e. 52.3 V). This power was recorded without any significant fluctuation and in stable condition of feeding gases and mechanical load. This result was comparable with that achieved in pure hydrogen. The difference in current value of 14 A instead of 16 A with respect to the test in H2 was selected to diminish the risk in
natural gas of reaching the cutoff voltage.
Time study @ 14 A: close up on starting phase
0 3 6 9 12 15 0 85 170 255 340 425 510 595 680 Time [s] C u rr e n t [A ] 0 15 30 45 60 75 V o lt a g e [ V ]
Current [A] Voltage [V]
Figure 1.14: Transient behavior at the beginning of the time study at 14 A constant current, the maximum current value was reached in two steps.
As shown in Figure 1.14 the time study was performed in two steps: the former was 4 minute long at 10 A to give a uniform distribution of temperature in the stack (from anode to cathode), and, as this steady condition was reached, the latter step was started. The first recorded voltage value was 43.7 V. An increase of voltage in the first few minutes is reported in the following Table 1.3:
Time [min] Voltage [V] 0 43.7 1 46.8 2 48.8 3 50.1 4 50.6 5 51.2 6 51.5 7 51.9
Table 1.3: Recorded voltages during transient phenomena at 14 A.
The long run of the time study yielded the steady current voltage trend, this is shown in Figure 1.15, the average recorded value is 52.09 V and it is possible to observe a very slightly increasing value of the stack voltage of about 20 µV/min.
Time study @ 14A
V_avg = 52.091 0 2 4 6 8 10 12 14 16 0 100 0 2000 3000 400 0 50 00 60 00 70 00 8000 9000 10000 Time [min] C u rr e n t [A ] 47 48 49 50 51 52 53 54 55 V o lt a g e [ V ]
Current [A] Voltage [V] V - Linear trend [V]
Figure 1.15: Endurance test at 14 A to analyse stack voltage stability and linear trend.
At the end of this test, a slow current reduction was executed down to 0 A to measure the new OCV value, and a value of 74.0 V was recorded in natural gas.
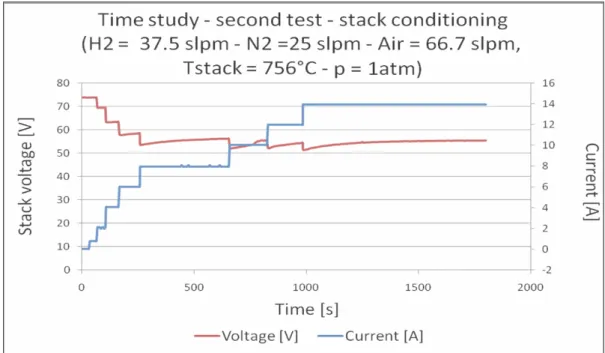
After that, a second endurance test was carried out, the result of the starting operations is reported in Figure 1.16 (and significant points in Table 1.4 as well) and shows increased values of voltage with respect to the same current values of
the previous test. To have a comparable start conditions, a long conditioning in hydrogen was done.
Figure 1.16: Second time study, maximum current (14 A) reached in several steps.
Time [s] Current [A] Voltage [V]
0 0 74 40 0.75 73.8 84 1.95 69.4 120 4.05 63.3 180 6 57.9 232 6 58.3 289 7.95 53.9 349 7.95 54.7 529 7.95 55.8 709 10.05 52.8 799 10.55 55.4 829 12 52 889 12 53.4 979 12 54.4 1005 13.95 51.6 1035 13.95 52.4 10.95 13.95 53.2 1185 13.95 54.1 1425 13.95 55
After about 29 hours the feeding gas was switched in natural gas and water steam, the transient phenomenon is reported in Figure 1.17. It showed a decrease in the average voltage value with respect to the one recorded in hydrogen. Moreover, during the transient it was possible to observe the short term effect of water steam as fluctuations of the voltage value and the related variation from 2.4 cc/min to 4 cc/min and to 6.6 cc/min.
Usually, by calculating the ratio between number of moles of steam and number of moles of carbon, it is defined a steam/carbon (S/C) ratio; the considered water content correspond respectively to: S/C=2, S/C= 3.33 and S/C=5.5.
Figure 1.17: Effect of the steam content variation at the beginning of the second time study. The water addition is necessary to supply the stack with enough oxygen to avoid carbon deposition; on the other hand, this produces lowering of the anodic potential. For this reason, it is necessary to find a good compromise between these two contrasting phenomena. The corresponding steam-to-carbon ratios (S/C) were taken between 2 and 5.5.
The voltage fluctuations are attributable to the O2 presence in anode stream
(coming from water steam) whose effect is reducing power of the anodic stream; on the other hand, the water steam makes possible the steam reforming reaction.
Different water contents in gas flow were attempted to find a good compromise between voltage reduction (with respect to pure H2 feeding) and
voltage stability (affected by the endothermic equilibrium of reforming reaction, especially at low current load).
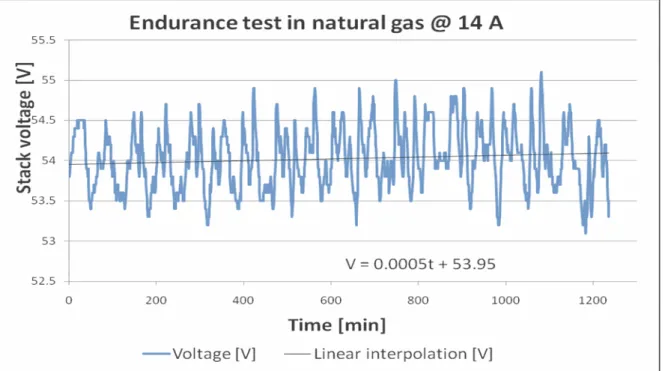
In Figure 1.18 it is possible to observe the effect of the short second conditioning in little amount of hydrogen between two long run in natural gas.
The stack has shown a 2-volt voltage recovery with respect to the previous endurance test, the average recorded value is 53.95 V instead of 52.09 at 14 A, moreover the voltage trend appears to show an increasing behavior.
Figure 1.18: Endurance test in natural gas at 14 A and linear trend approximation. The plotting vertical scale highlights that fluctuations are not more than 1V around the average voltage during the whole 20 hour test.
After the 20 hour test at 14A load, the stack underwent a controlled shut down (carried out at 5°C/min, according to the manufacturer spcifications) to study its behaviour if a thermal cycle occurs.
After complete cooling, the start-up procedure was started again; the subsequent polarization test was quite satisfactory, reaching power performance similar to the the one achieved in the previous tests both in hydrogen and in natural gas, as shown in Figure 1.19, with a maximum value of about 1108W at 18A in hydrogen and 867W at 15A in natural gas. These values are very close to
the ones recorded during the first thermal cycle (1170W, at the same current loads), highligthing no significant decay caused by this shut-down/start-up operation. The relative performance decay is (1170-1108)/1170=0.053=5.3%. This decay does not seem a dramatic value, provided that any operation in H2 was not
carried out (unlike it was done when best performance was recorded in the previous cycle).
The results were normalized (Figure 1.20) with respect to number of cells in the stack and cell area to be easily comparable with the other solid oxide fuel cell based devices.
Polarization after a thermal cycle - H2 and NG performance comparison H2 test: Anode flow= 3750 Nl/h (60% H2 - 40% N2)
NG test: Anode flow rate = 290 NL/h (natural gas) + 3 cc/min water steam gas pressure = 1 bar abs - Tstack = 760°C
0 15 30 45 60 75 90 0 2 4 6 8 10 12 14 16 18 20 Current [A] S ta c k v o lt a g e [ V ] 0 200 400 600 800 1000 1200
Stack voltage in H2 Stack voltage in NG Stack power in H2 Stack power in NG V = 57.7V V = 61.6V
P = 1108W
P = 867W
Figure 1.19: Performance comparison between H2 and NG fed polarization tests. The maximum
power difference can be attributable to the different thermodynamic potential of NG and H2, and the
ohmic region of the IV curve showed similar slope, so that no degradation of electrolyte can be detected after short endurance test in H2.
As visible in Figure 1.21 (in which the overall stack and gases temperature behaviours are reported) the stack was operated at 760°C feeding gas streams at 650°C.
Polarization tests in H2and in NG for the first stack
Normalization to single cell performance
0 0.2 0.4 0.6 0.8 1 1.2 0 0.02 0.04 0.06 0.08 0.1 0.12 0.14 0.16 0.18 0.2
Current density [A/cm^2]
S in g le c e ll v o lt a g e [V ] 0 0.03 0.06 0.09 0.12 0.15 0.18 S in g le c e ll p o w e r d e n s it y [m W /c m 2 /c e ll ]
Stack#1 - Cell voltage in H2 Stack#1 - Cell voltage in NG Stack#1 - Cell power density in H2 Stack#1 - Cell power density in NG
V1avgNG= 0.771V
V1avgH2= 0.821V
OCV1avgNG= 1.025V
OCV1avgH2= 1.122V p1avgH2=160 mW/cm 2
/cell
p1avgNG=125 mW/cm 2
/cell
Figure 1.20: Normalized results of polarization tests both in H2 and NG for the first stack
operating in the second thermal cycle.
Stack and gas temperature during tests
T e m p e ra tu re [ °C ] Time
Stack and gas temperature during tests
T e m p e ra tu re [ °C ] Time
Figure 1.21: Overall temperature log for stack and gases during the whole second thermal cycle; the rightmost part of the figure represents the stack cooling/shutdown, the negative temperature slope was limited by the furnace insulation.
1.2.6 - Conclusions
A planar SOFC stack was tested by polarization and endurance tests. It was fed with either hydrogen or natural gas and thermal cycles were performed. A good voltage stability under steady state conditions was observed. Thermal cycles slightly affected the power performance. A short conditioning in hydrogen appeared as a process allowing to recover good efficiency. By applying this procedure, even a higher voltage value (at same current load) was recorded after the latter thermal cycle. Different water steam contents in natural gas were investigated; the steam showed a valuable contribution to avoid carbon deposition on the anode catalyst without affecting the generated power
1.3 - Catalytic partial oxidation based 1kW planar SOFC stack
1.3.1 - Introduction
With the purpose of evaluating two different approaches to the market related issues, a second commercial stack was tested. This new stack was chosen thanks to two differences with respect to the previous. In this case, the selected stack shows two advantages, the former is a self compression system, so there is no need for external compression plunger in the turnkey system, the latter is the way to adapt the stack power to the customers’ demands.
In particular, single cells are packed in clusters with 6 cells each, so, once assembled every cluster, the tightness of the gaskets must be assured only between the plates at the extremes of each cluster.
Moreover, from the scale-up strategy point of view, to match demands of different residential units, the choice of stackable cell clusters as pre-fabricated devices, allow for adaptation to different nominal power values. Furthermore, in case of damage of the stack, that typically involves contiguous cells, the replacement of one whole cluster in a single operation leads to reduction of plants shutdown time.
The latter difference is the presence of a self-compression strategy for each cluster. In fact, every group of six cells is packed with sealing and removable
springs to hold the whole cluster. For stack configurations, two holes through every cell are exploited by inserting threaded rods with calibrated springs to give a proper tightness and assure avoidance of gas leakage.
1.3.2 – Stack description and operating procedure
The stack consisted of 72 anode supporting planar cells in series and enclosed in a metal shell (visible in Figure 1.22) provided with insulating material to avoid short circuits and offer mechanical protection to the cells. Each cell has an area of 50cm2. N-type thermocouples were mounted to monitor the temperature
distribution during operations.
Figure 1.22: Second tested stack. Composed of 75 cells, it is enclosed in a protective shell and has a self compressione system made with threaded rods and calibrated springs.
This stack operated at about 760°C at a pressure of 1 bar abs. After a start-up procedure comparable to the one applied to the first stack, and whose temperature trends are reported in Figure 1.23, both in terms of time duration and H2/N2
feeding mixture, two polarization tests were carried out.
The only significant variation in the start-up procedure was the gas temperature at the inlets, it was set at 750°C instead of 650°C.
Stack#2 - Temperatures recorded during first thermal cycle 0 100 200 300 400 500 600 700 800 900 0 200 400 600 800 1000 1200 Time [min] T e m p e ra tu re [ °C ]
T stack bot[°C] T stack top[°C] T air out [°C]
Controlled shut-down Polarization tests
OCV stabilization
Start-up heating about 200°C/h
Figure 1.23: Temperature behaviours into the stack shell during the whole test. It is possible to tell the heating up for stack conditioning, the two time intervals used to carry out two polarization tests and the shutdown operation.
Moreover, this stack operated a dry reforming process, by adding oxygen (by air) in the anode stream. This is a catalytic partial oxidation (CPOx) reaction i.e. the oxygen content in the anode stream is lower than the stoichiometric amount for full oxidation. This process allows for a better compactness of the whole gas processing system and for reduced hardware complexity. It is a catalytic reforming process so that CH4 and H2 mixture (from natural gas) reacts with
oxygen according to the reactions:
CH4 + 1/2 O2 CO + 2H2
and
CH4 + 2 O2 CO2 + 2 H2O,
depending on the thermodynamic conditions, CO2 can continue to react with CH4,
according to: