UNIVERSITY OF VERONA
DEPARTMENT OF MEDICINE
PHD SCHOOL OF LIFE AND HEALTH SCIENCES
PHD IN INFLAMMATION, IMMUNITY AND CANCER
CYCLE XXX
PHD THESIS
PD-L1 EXPRESSION IN LUNG NON SMALL CELL CARCINOMA:
EVALUATION OF HETEROGENEITY AND DEFINITION OF BIOPTIC
CRITERIA FOR IMPROVING PATIENTS SELECTION
Coordinator: Prof. Gabriela Constantin
Tutor: Prof. Matteo Brunelli
PhD candidate: Dr. Enrico Munari
In memory of Alessandro Moretta
1 INDEX ABSTRACT Page 2 INTRODUCTION Page 3 MATERIAL AND METHODS Page 5 RESULTS Page 7 TABLES AND FIGURES Page 12 DISCUSSION Page 20 CONCLUSIONS Page 25 REFERENCES Page 26 ACKNOWLEDGMENTS Page 29
2
ABSTRACT
Purpose: PD-L1 expression determination defines eligibility for treatment with pembrolizumab in patients with advanced non-small lung cancer (NSCLC). Conflicting results have been reported in the few studies that have addressed the issue of PD-L1 heterogeneity. This study was designed to better define which value across core biopsies from the same case more closely reflects the PD-L1 expression status on whole sections and how many biopsies are needed for confident classification of tumors in terms of PD-L1 expression.
Materials and Methods: we built tissue microarrays as surrogate of biopsies collecting 5 cores per case from 268 cases and compared PD-L1 staining results using clone SP263 with tumor whole sections; moreover, we evaluated PD-L1 expression consistency between 84 paired primitive and relapsed tumors. Results: we found an overall positivity in 39% of cases for 1% cutoff and 10% of cases for 50% cutoff; we observed a discordance rate within tissue cores of 20% and 7.9% for ≥ 1% and ≥ 50% cutoffs, respectively. The maximum value across cores was associated with high concordance between cores and whole sections and the lowest number of false negative cases overall. In order to reach an area under the curve (AUC) and sensitivity > 0.90, 4 and 3 cores were necessary at 1% and 50% cutoff, respectively. Importantly, with 20% as cutoff, less than 3 cores showed high sensitivity and specificity in identifying cases with ³50% of tumor cells positive for PD-L1 on whole sections. Finally, we found PD-L1 expression concordance between primary and paired metastatic tumor in 88% and 91% of cases using 1% and 50% cutoff, respectively. Conclusions: an accurate definition of the criteria to determine the PD-L1 status of a given tumor may greatly help to select those patients who could benefit from anti-PD1/PD-L1 treatment.
3 INTRODUCTION Programmed cell death 1 (PD1) is an inhibitory receptor originally identified in T lymphocytes that, upon interaction with its ligand PD-L1, delivers inhibitory signals that downregulate T cell function. Under physiological conditions, this interaction leads to peripheral T-cell tolerance, while in cancer patients it may impair T cell responses against tumor cells [1-3]. Immunotherapy with checkpoint inhibitors has proven highly effective in different tumor types representing a true revolution in cancer therapy [4, 5].
Currently, there are four drugs targeting the PD1/PD-L1 axis which have been approved by the Food and Drug Administration (FDA): two against PD-L1 (atezolizumab and durvalumab) and two against PD1 (nivolumab and pembrolizumab).
Predicting which patients will respond to checkpoint inhibitors therapy is a major issue and so far has been mainly based on immunohistochemical evaluation of PD-L1 on tumor cells[6, 7]. Although some studies found significant correlation between expression of PD-L1 and response to therapy in different tumor types[8-12], others have not, since responses have been observed also in in patients whose tumors lacked PD-L1 expression[13, 14].
Pembrolizumab is an anti-PD1 humanized monoclonal antibody that was recently granted FDA approval after clinical trials conducted in patients with advanced lung adenocarcinoma or squamous carcinoma on the basis of PD-L1 expression on viable tumor cells, evaluated with a validated assay. Specifically, the KEYNOTE-010 trial demonstrated that pembrolizumab prolonged the overall survival in previously treated patients whose tumors expressed PD-L1 in at least 1% of cells[15]. Moreover, the KEYNOTE-024 trial showed significantly longer progression-free survival and overall survival for previously untreated patients with tumors expressing PD-L1 in at least 50% of cells[10].
It is evident that the immunohistochemical evaluation of PD-L1 expression on tumor specimens has become an issue of major importance. In addition, it is
4
necessary to consider that, for the large majority of patients, such evaluation is made on small biopsies. However, small tissue samples, like diagnostic biopsies, might not be entirely representative of tumor specimen and display divergent results due to the possible heterogeneous expression of PD-L1. Specifically, if only one random biopsy would be available, it could be possible that a proportion of cases might be misclassified. Therefore, it is of major importance to understand the magnitude of this problem as it can profoundly impact on the patient’s management; in this regard, only a few studies have been conducted, reporting conflicting results. For these reasons, in this study we assessed the heterogeneity of PD-L1 expression in NSCLC using tissue microarrays as surrogate of small biopsies with a validated immunohistochemical assay (Ventana’s SP263) in order to understand its impact in patient selection for therapy in first and second line setting. Moreover, we aimed at better defining which value across core biopsies from the same case more closely reflects the actual PD-L1 expression status and how many biopsies are needed for confident classification of tumors in terms of PD-L1 expression. Finally, we evaluated a large number of paired tumor relapses to evaluate the consistency in terms of PD-L1 expression with paired primary tumors.
5 MATERIAL AND METHODS Study Cohort The study cohort consisted of consecutive patients with primary NSCLC who had undergone surgical resection at the Sacro Cuore Don Calabria Hospital of Negrar, Verona (Italy) between 2003 and 2017 with available slides and paraffin embedded tissue blocks.
None of the patients received therapy before surgery.
Tumors were classified according to the 2014 WHO classification and staging was done using the TNM staging manual (7th edition). Patients demographics and clinical data were retrieved from the digital archives.
Investigations have been conducted according to principles expressed in the Declaration of Helsinki. Tissue Microarray Construction For every case, all H&E stained slides were reviewed for diagnosis confirmation; one block was then selected for tissue microarray (TMA) construction. For each block, 5 cores with a diameter of 1 mm were obtained from the diverse areas of the tumor and randomly numbered from 1 to 5. Overall, 12 TMAs were built. Immunohistochemistry and Scoring From each block (single cases and TMAs) 5µm sections were cut and stained with PD-L1 (clone SP263, Ventana) on an automated staining platform (Benchmark ULTRA; Ventana). An OptiView DAB IHC Detection Kit (Ventana) and an OptiView Amplification Kit (Ventana) were used according to the manifacturer’s recommendations for the visualization of the primary anti PD-L1 antibody.
Stained sections were scanned using Ventana iScan HT and scored based on percentage of positive tumor cells showing membranous positivity, irrespective of staining intensities; a three-tiered system was then applied using the following thresholds: < 1%, 1-49% and ≥ 50%.
6 We considered as adequate the cores showing a neoplastic component ≥ 30%, in order to be well beyond the commonly used minimum of ≥ 100 viable carcinoma cells; therefore, cores with lower percentages of neoplastic component have been excluded. Macrophages were used as internal control in order to validate the adequacy of PD-L1 staining reaction. Statistical Analysis Statistical analysis was carried out using Stata and R (version 3.2.3)[16]; χ2 was
used to analyze contingency tables, Cohen’s κ to calculate coefficient of agreement and ROC curves were constructed to evaluate the predictive ability of core biopsies for PD-L1 status on whole sections.
7 RESULTS Patient Characteristics From an initial 271 patients, three were not considered for the analysis because of failure in TMA construction or staining. Overall, 268 patients were included in this study; of these, 190 (71%) were males and 78 (29%) were females; median age was 70 years (range 41-87 years), for whom surgically resected specimen was available. Of the 268 patients, 183 (68%) were diagnosed with adenocarcinoma, 64 (24%) with squamous cell carcinoma, and 21 (8%) with other histotypes (15 with large cell carcinoma, 4 with adeno-squamous carcinoma and 2 with large cell neuroendocrine carcinoma). The median size of the tumors was 2.7 cm (range 0.8-21 cm). Lymph node status was available for 246 cases: 172 cases were N0, 35 N1, 34 N2 and 5 N3. PD-L1 expression and clinical-pathological features Overall, when considering a cutoff of ³ 1% of cells stained by PD-L1, 105/268 (39%) cases resulted positive, while considering a cutoff of ³ 50% of cells, 26/268 (10%) cases were positive on whole sections. We analyzed the associations between PD-L1 expression on whole sections and clinico-pathological features (Table 1). We show that, when considering 1% cutoff, PD-L1 positive tumors often correspond to a higher stage. Notably, squamous cell carcinomas were more often positive than adenocarcinomas. Evaluation of PD-L1 expression concordance within tissue cores For this analysis, we considered tissue cores from a 239 patients. Overall, when considering a cutoff of ³ 1% of cells stained by PD-L1, 93/239 (40%) of cases resulted positive in at least one core and 146/239 (60%) were negative in all cores. Among positive cases, 45/93 (48%) showed full concordance between
8 evaluable cores: specifically, 32 cases showed positivity in 5/5 cores, 7 cases in 4/4 cores and 6 in 3/3 cores. Importantly, 48/93 cases (52%) showed discordant results in at least 1 core: of note, within the positive cases with all 5 cores available for evaluation, in 15 cases 1 core out of 5 resulted positive, in 9 cases 2 out of 5 cores were positive, in 13 cases 3 out of 5 cores were positive and in 4 cases positivity was seen in 4 out of 5 cores. Among cases with 4 cores evaluable, 2 cases were positive in 1 core and 2 cases showed positivity in 3 cores. Among cases with 3 cores available, 1 case was positive in 1 core and 2 showed positivity in 2 cores. Only 4 cases had less than 3 cores available for evaluation and none of these stained positive for PD-L1 (Table 2A). When considering a cutoff of ³ 50% of neoplastic cells expressing PD-L1, 29/239 cases (12%) were positive in at least one core while 210/239 (88%) resulted negative. Of the positive cases, 10 (34%) showed 100% concordance between available cores: among these, 5 had all 5 cores available, 1 case had 4 cores available and 4 cases had 3 cores available. Importantly, 19 (66%) of the positive cases showed discordant results in the available cores: among cases with 5 cores available, 6 were positive in just 1 core, 4 were positive in 2 cores, 3 showed positivity in 3 cores and 4 had 4 cores positive. One case showed PD-L1 positivity in 1 out of 4 cores and 1 case stained positive in 3 out of 4 cores (Table 2B). When considering the two main histotypes, namely adenocarcinoma and squamous cell carcinoma, positivity in at least one core was seen in 57/159 cases (36%) and in 32/65 cases (49%) using a cutoff of ³ 1% of cells, respectively. In positive adenocarcinomas, full concordance was seen in 26 cases (46%) while 31 cases (54%) showed discordant results within the cores. At the same cutoff (≥ 1%) in squamous cell carcinomas, 100% concordance was seen in 16 of the 32 positive cases (50%) while the other half showed discordant results within the cores.
When a cutoff of ³ 50% of cells expressing PD-L1 was applied, 18/159 (11%) adenocarcinomas and 9/65 (14%) squamous cell carcinomas were positive in at
9
least one core. Among positive adenocarcinomas, concordance within all available cores was reached in 7 (39%) cases while 11 cases (61%) showed discordance within cores. Among positive squamous cell carcinomas, 3/9 cases (33%) showed full concordance, all with 5 cores available, while 6/9 cases (67%) showed discordant results. Figure 1 shows representative discordant PD-L1 expression in a single case of adenocarcinoma and squamous cell carcinoma. Overall, considering all cases, we observed a discordance rate within core biopsies of 20% and 7.9% and a Cohen’s κ value of 0,53 (moderate) and 0,48 (moderate) for ≥ 1% and ≥ 50% cutoffs, respectively. Definition of best PD-L1 expression value across cores
Regarding tissue cores, the majority of cases had all 5 cores available for evaluation. In some cases, cores were lost during processing or contained less than 30% of tumor cells. Specifically, 215 cases had 5 cores, 31 had 4 cores, 16 had 3 cores, 4 had 2 cores and 2 had 1 core available.
We compared the PD-L1 results obtained across tissue cores for each case in order to establish which value, among maximum, minimum, mean and median, shows the highest concordance rate compared with corresponding whole sections (considered as gold standard). Overall, at 1% cutoff, we found a concordance rate of 95.9%, 95.9%%, 86.5% and 79.5% for maximum, mean, median and minimum value, respectively. Using 50% cutoff, we found a concordance rate of 95.6%, 96.6%, 96.2% and 94.4% for maximum, mean, median and minimum value, respectively. Discrepancies were due to the heterogeneous expression of PD-L1 in neoplastic cells (figure 2). In general, maximum and mean value appeared to better reflect PD-L1 expression on whole sections. However, since the maximum value across cores showed the lowest number of false negative results for both 1% and 50% cutoffs only this value was applied for subsequent analysis (Table 3).
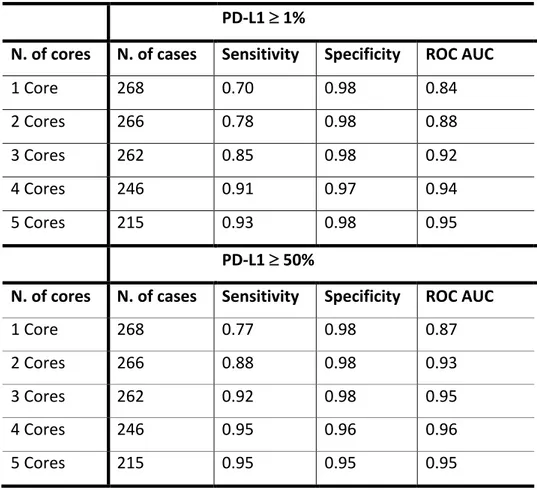
10 Definition of minimum number of biopsies for optimal concordance with whole sections Table 4 summarizes the results of sensitivity, specificity and ROC analyses relative to the number of cores evaluated, considering the results of whole sections as the reference for each case. For 1% cutoff, we found an AUC > 0.9 with 3 cores; moreover, a 0.91 sensitivity was reached when 4 cores were considered.
For 50% cutoff, we noted a progressive increment in terms of sensitivity with increasing number of cores evaluated; specifically, we found AUC and sensitivity > 0.9 with 3 cores.
We noted that, at 50% cutoff, increasing numbers of cores corresponded to a decrease of specificity (from 0.98 with 1 core to 0.95 with 5 cores), reflecting the increasing number of false positive cases. Overall, considering all positive cases (with at least 1 core with ³ 50% cells stained with PD-L1), we found 10 false positive cases (3.7%), all with at least 4 cores available. Interestingly, considering as positive those cases with more than 1 core with ³ 50% of cells stained with PD-L1, the number of false positive cases dropped from 10 to 3 while the number of false negative cases did not change (2 cases). Importantly, at 50% cutoff we found that when less than 3 cores were considered, the sensitivity remained low (< 90%). Therefore, we evaluated the predictive value of other PD-L1 cutoffs on cores, comparing data to cases in which tumor cells expressed PD-L1 in ³ 50% of cells on the whole sections. Thus, we assessed sensitivity, specificity and AUC for 10%, 20%, 30% and 40% cutoff values related to the number of biopsies analyzed (table 5). We show that, at 20% cutoff, less than 3 cores were sufficient for identifying cases with ³ 50% of PD-L1-positive tumor cells on whole sections, with sensitivity and AUC > 0.9.
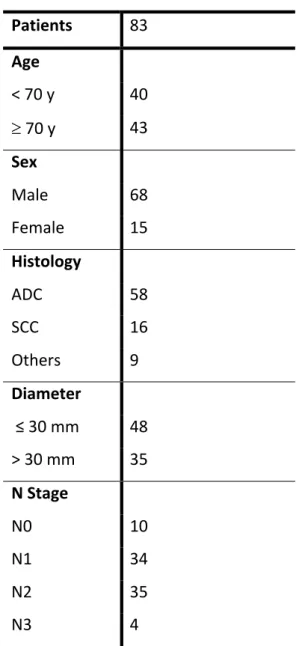
11 Evaluation of PD-L1 expression between primary and metastatic tumors We analyzed PD-L1 expression status on whole sections of 84 paired relapses from 83 patients: 75 metastasis (71 to lymph node and 4 to distant sites) and 9 local recurrences. Clinical and pathological features of corresponding primary tumors are shown in table 6. All lymph node metastasis were synchronous (33 N1, 34 N2 and 4 N3), while all distant metastasis were metachronous, with a mean interval from time of resection of the primary tumor of 19 months (range: 8-29 months); sites of distant metastasis were: colon (1), skin (1), contralateral clavicular node (1) and contralateral lung (1). Mean time to local recurrence was 40 months (range 8-91 months). All but one relapses were surgical specimens. PD-L1 expression status in primary tumors and paired metastasis are shown in table 7. When considering a cutoff of 1%, discrepancy in PD-L1 expression was present in 9/75 (12%) paired samples (kappa value = 0.75): in 7 (9.3%) cases PD-L1 expression in the metastasis was lost while in 2 cases (2.7%) was gained. When considering a cutoff of 50%, discrepancy in PD-L1 expression was observed in 7/75 (9.3%) of paired samples (kappa value = 0.61): in 5 cases (6.6%) expression was lost in the metastasis while in 2 cases (2.7%) it was gained. All discordant paired specimen were lymph node metastasis, as all cases of distant metastasis and corresponding primary tumors resulted negative for PD-L1. PD-L1 expression status in primary tumors and paired local recurrences are shown in table 8.
At 1% cutoff, discrepancy in PD-L1 expression was seen in 3/9 (33%) paired samples and all resulted in gained PD-L1 expression; at 50% cutoff, 1/9 (11%) paired samples showed gained PD-L1 expression.
12 TABLES AND FIGURES Table 1. Clinical-pathological characteristics of patients in relation with PD-L1 expression on whole sections. PD-L1 ³ 1% PD-L1 ³ 50% Variable Overall (%) Negative (%) Positive (%) P Value1 Negative (%) Positive (%) P Value1 Patients 268 163 (61%) 105 (39%) 242 (90%) 26 (10%) Age < 70 y 121 (45%) 76 (63%) 45 (37%) 0.54 111 (92%) 10 ( 8%) 0.47 ³ 70 y 147 (55%) 87 (59%) 60 (41%) 131 (89%) 16 (11%) Sex Male 190 (71%) 106 (56%) 84 (44%) 0.01 170 (89%) 20 (11%) 0.48 Female 78 (29%) 57 (73%) 21 (27%) 72 (92%) 6 ( 8%) Histology ADC 183 (68%) 120 (66%) 63 (34%) 0.06 164 (90%) 19 (10%) 0.84 SCC Others 64 (24%) 21 ( 8%) 33 (52%) 10 (48%) 31 (48%) 11 (52%) 59 (92%) 19 (90%) 5 ( 8%) 2 (10%) Diameter ≤ 30 mm 164 (62%) 107 (65%) 57 (35%) 0.09* 151 (92%) 13 (8%) 0.20* > 30 mm Unk 102 (38%) 2 56 (55%) 0 46 (45%) 2 89 (87%) 2 13 (13%) 0 N Stage N0 172 (64%) 110 (64%) 62 (36%) 0.14* 158 (92%) 14 ( 8%) 0.11* N1-N3 Unk 74 (28%) 22 ( 8%) 40 (54%) 13 34 (46%) 9 63 (85%) 21 11 (15%) 1 1 Pearson’s chi-square test (*P Value: Unknown cases excluded from test) Unk: unknown
13 Table 2. PD-L1 expression within tissue cores. Each cell shows number of total cases (239) relative to the number of positive cores out of the number of available cores using ≥ 1% (A) and ≥ 50% (B) cutoffs. Cells with thickened borders indicate cases with full concordance between cores; cells on the left of cells with thickened borders indicate cases with discordant PD-L1 expression levels within cores. If a single random biopsy was available, incorrect categorization might occur in up to 7.9% and 20% of patients with advanced NSCLC eligible for first (50% cutoff) and second (1% cutoff) line therapy with pembrolizumab, respectively. A: PD-L1 Cutoff ≥ 1% Num be r of e valuable c or es
Tot Neg Positive
5 191 118 15 9 13 4 32 4 29 18 2 0 2 7 3 15 6 1 2 6 2 3 3 0 0 1 1 1 0 239 0 1 2 3 4 5 Number of positive cores B: PD-L1 Cutoff ≥ 50% Num be r of e valuable c or es
Tot Neg Positive
5 191 169 6 4 3 4 5 4 29 26 1 0 1 1 3 15 11 0 0 4 2 3 3 0 0 1 1 1 0 239 0 1 2 3 4 5 Number of positive cores
14 Table 3. Concordance between cores and whole sections according to maximum, mean, median and minimum value across cores at 1% and 50% cutoff. PD-L1 ³ 1%
Value across cores Concordant Cases False Negative False Positive
Maximum 257 (95.9%) 4 (1.5%) 7 (2.6%) Mean 257 (95.9%) 9 (3.4%) 2 (0.7%) Median 232 (86.5%) 34 (12.8%) 2 (0.7%) Minimum 213 (79.5%) 55 (20.5%) 0 PD-L1 ³ 50%
Value across cores Concordant Cases False Negative False Positive
Maximum 256 (95.6%) 2 (0.7%) 10 (3.7%) Mean 259 (96.6%) 8 (3%) 1 (0.4%) Median 258 (96.2%) 7 (2.6%) 3 (1.2%) Minimum 253 (94.4%) 15 (2.6%) 0
15 Table 4. Sensitivity, specificity and ROC AUC according to number of available cores considering 1% and 50% cutoffs PD-L1 ³ 1%
N. of cores N. of cases Sensitivity Specificity ROC AUC
1 Core 268 0.70 0.98 0.84 2 Cores 266 0.78 0.98 0.88 3 Cores 262 0.85 0.98 0.92 4 Cores 246 0.91 0.97 0.94 5 Cores 215 0.93 0.98 0.95 PD-L1 ³ 50%
N. of cores N. of cases Sensitivity Specificity ROC AUC
1 Core 268 0.77 0.98 0.87 2 Cores 266 0.88 0.98 0.93 3 Cores 262 0.92 0.98 0.95 4 Cores 246 0.95 0.96 0.96 5 Cores 215 0.95 0.95 0.95 Table 5. Sensitivity, specificity and ROC AUC of different cutoffs and number of cores in predicting cases with ≥ 50% of cells positive for PD-L1 on whole sections Cutoffs 10% 20% 30% 40% Number
of cores SE SP AUC SE SP AUC SE SP AUC SE SP AUC 1 core .96 .91 .94 .96 .95 .96 .88 .96 .92 .81 .97 .89 2 cores .96 .88 .92 .96 .93 .94 .92 .95 .93 .88 .96 .92 3 cores .96 .85 .91 .96 .89 .93 .96 .92 .94 .92 .95 .93 4 cores 1 .84 .92 .95 .89 .92 .95 .90 .93 .95 .95 .95 5 cores 1 .85 .92 1 .89 .95 1 .90 .95 .95 .94 .94 SE: sensitivity; SP: specificity; AUC: area under the curve
16
Table 6. Clinical and pathological features of corresponding paired primary tumors Patients 83 Age < 70 y 40 ³ 70 y 43 Sex Male 68 Female 15 Histology ADC 58 SCC 16 Others 9 Diameter ≤ 30 mm 48 > 30 mm 35 N Stage N0 10 N1 34 N2 35 N3 4
17 Table 7. PD-L1 expression status in primary tumors and paired metastasis Primary Metastasis < 1% 1-49% ≥50% Total < 1% 40 2 0 42 1-49% 5 14 2 21 ≥50% 2 3 7 12 Total 47 19 9 75 Table 8. PD-L1 expression status in primary tumors and paired local recurrences Primary Recurrence < 1% 1-49% ≥50% Total < 1% 5 2 1 8 1-49% 0 1 0 21 ≥50% 0 0 0 0 Total 5 3 1 9
18
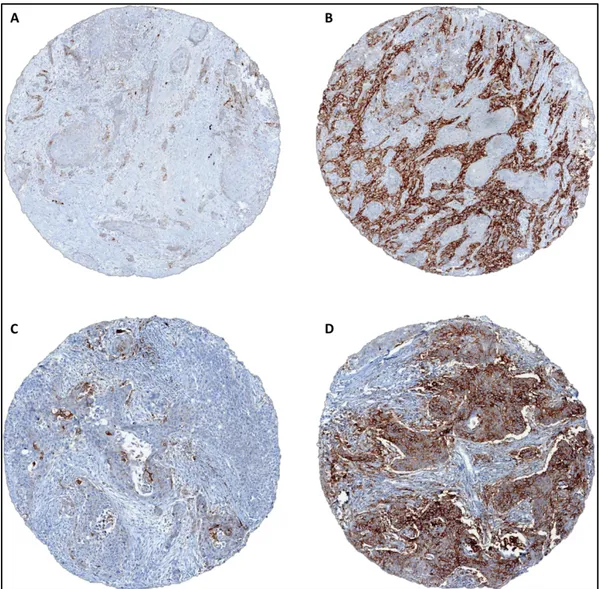
Figure 1: A, B: discordant PD-L1 expression within tissue cores from a single adenocarcinoma case (2% vs 80%); C, D: discordant PD-L1 expression within tissue cores from a single squamous cell carcinoma case (5% vs 70%).
19
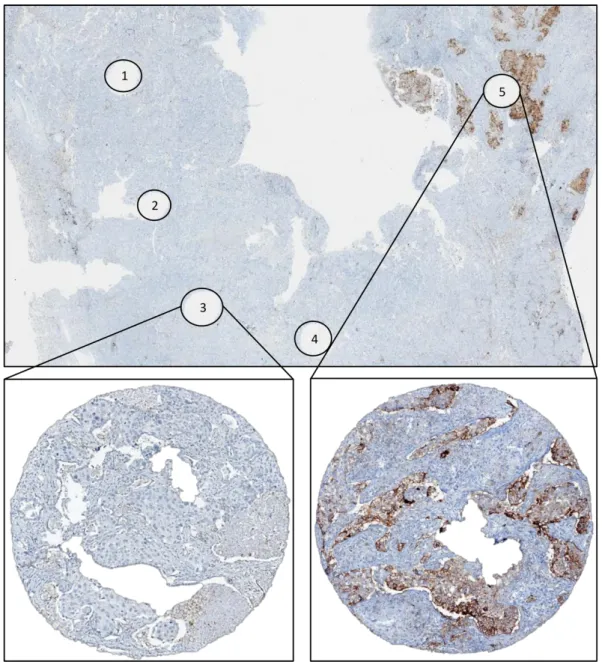
Figure 2. Representative image for PD-L1 expression heterogeneity: whole section of squamous carcinoma of the lung stained with PD-L1 showing wholes corresponding to tissue microarray cores, numbered 1 to 5; cores numbered 1 to 4 have been sampled randomly in an area that resulted to be negative while core number 5 resulted positive in 50% of neoplastic cells. Overall, tumor whole section resulted expressing PD-L1 in 20% of neoplastic cells.
20
DISCUSSION
The FDA recently approved the anti-PD1 pembrolizumab as a single agent for patients with tumors expressing PD-L1 in ³ 50% of neoplastic cells for first line therapy and as a second line therapy for patients whose tumors express PD-L1 in at least 1% of cells[10, 15]. The vast majority of these patients have advanced tumors and only small biopsies are often available for PD-L1 determination. It is therefore of major importance to determine how many biopsies should be obtained from tumors and how to consider the results of PD-L1 staining across tissue cores in order to maximize their reliability in predicting the true PD-L1 status of tumors. So far, only a few studies have addressed the issue of PD-L1 heterogeneity and its potential role in tumor misclassification, given the possible discrepancies between biopsies and resection specimens[17-19].
Moreover, no attempts have been made to harmonize biopsies and resection specimen with regard to PD-L1 expression determination.
In this study, we assessed the heterogeneity of PD-L1 expression in NSCLC and addressed the question of which value of PD-L1 expression among maximum, mean, median and minimum across tissue cores better reflects the actual PD-L1 expression on tumor specimen and how many biopsies are necessary for optimal correlation; in addition, we analyzed the predictive potential of different cutoffs in identifying cases with ³ 50% of tumor cells expressing PD-L1 on whole sections. Finally, we evaluated a large number of paired tumor relapses to evaluate the consistency in terms of PD-L1 expression with paired primary tumors.
We found an overall positivity in 39% of cases for 1% cutoff and 10% of cases for 50% cutoff, evaluated on whole sections.
Regarding tissue cores, we observed a discordance rate of 20% and 7.9% and a Cohen’s κ value of 0.53 (moderate) and 0,48 (moderate) for ≥ 1% and ≥ 50% cutoffs, respectively.
These results mean that, in practice, if a single random biopsy was available, incorrect categorization might occur in up to 7.9% and 20% of patients with
21
advanced NSCLC eligible for first and second line therapy with pembrolizumab, respectively.
In general, the maximum value and the mean value across cores from each case showed the highest concordance rates with whole sections both at 1% cutoff (95.9% for both values) and at 50% cutoff (95.6% and 96.6% respectively). Moreover, we found that the maximum value across cores correlated with the lowest number of the overall false negative cases (4 cases and 2 cases for 1% and 50% cutoff, respectively). An important issue is the definition of the minimum number of biopsies necessary for optimal correspondence with whole sections. Our results indicate that 4 and 3 cores are necessary to reach an AUC and sensitivity > 0.9 at 1% and 50% cutoff, respectively.
Importantly, with less than 3 cores, the sensitivity was not satisfactory (< 0.9) considering 50% cutoff. However, by decreasing the cutoff on cores, their predictive value increased: specifically, we found that using 20% cutoff, 1 or 2 cores showed very high sensitivity and specificity in identifying cases with ³ 50% PD-L1 positive tumor cells on whole sections.
In the clinical context, the main concern is to avoid missing patients who could benefit from an effective treatment and therefore keep the number of false negative cases as low as possible; this requirement is even more important in the setting of first line therapy. However, since treatment with checkpoint inhibitors (including PD1 PD-L1) may cause toxicity, avoiding false positive cases is also of major importance. In this regard, it should be noted that in our cohort, at 50% cutoff, when at least 2 cores were positive, the risk of false positive cases dropped to 1.2%.
Kitazono et al. evaluated PD-L1 expression using a polyclonal antibody (4059 ProSci, Poway, CA) on 70 diagnostic biopsies and corresponding surgical specimen. They found positivity in 38% of cases at 1% cutoff with an overall good concordance (92%)[19]. On the other hand, Ilie et al., by evaluating PD-L1 using the SP142 clone on 160 surgically resected samples and paired biopsies, found
22
positivity in 23% of resected cases at 1% cutoff with an overall discordance rate of 48%[18]. Gniadek et al. evaluated PD-L1 expression on TMAs from 150 cases of NSCLC using SP142 antibody and Abcam detection Kit and found 47% and 17% of cases positive at 1% and 50% cutoff, respectively. In total, they found discrepancies among cores in 28 out of 71 (40%) of positive cases[17]. Recently, Li et al. evaluated PD-L1 expression on 190 resected NSCLC and matched TMA cores using the Dako 22C3 clone; at 1% cutoff these authors found 37% of positive cases with a discordance rate of 13.2% while at 50% cutoff positivity was found in 11% of cases with a discordance rate of 6.8%[20]. Notably, different from us, these authors built their TMA using single cores with a diameter of 2 mm for each case; we used multiple smaller (1-mm) cores to have a more comprehensive picture of the lesion and to allow a better computation thanks to a higher number of biopsies. In addition, even when considering our results on a single core, although smaller in size, our data are in line with those of these authors in terms of discordance rates (13% and 4.2% for 1% and 50% cutoffs, respectively).
In relation to general positivity at 1% and 50% cutoff, the results reported by Li et al. are similar to ours, although two different clones were used (22C3 by Li et al and SP263 by us).
Another important question is related to the consistency of PD-L1 expression between primary tumors and paired metastasis, as possible discrepancies could impair the correct categorization of tumors depending on bioptic site. In our cohort of paired primitive and metastatic tumors, we found a concordance rate of 88% and 91% at 1% and 50% cutoff, respectively. Our numbers are similar to those reported in a recent study by Kim et al., where the authors found a concordance rate between primary and paired metastatic tumors in 88% and 91% at 1% and 50% cutoff, respectively[21]. At variance with this study, however, we used a validated assay. Interestingly, regarding tumor recurrences, we found lower concordance between primary and recurred tumors when considering 1% cutoff (67%) while at 50% cutoff the concordance rate was 89%. Even though we had only a small number of tumor recurrence (9), these results suggest that it might
23
be necessary to perform a biopsy to a recurred tumor, especially if second line treatment is considered.
Currently, there are 4 validated assays for PD-L1: 2 are manufactured by Dako (Carpenteria, CA) and are optimized for use with the detection systems developed for the Dako Link 48 staining platform while the other 2 assays have been developed on the Ventana BenchMark platform. Each assay was developed with a unique primary antibody (clone) against PD-L1, namely, 28-8 (Dako) with nivolumab (Bristol-Myers Squibb), 22C3 (Dako) with pembrolizumab (Merck & Co., Inc.), SP263 (Ventana) with durvalumab (AstraZeneca), and SP142 (Ventana) with atezolizumab (Genentech). The availability of multiple approved PD-L1 IHC assays poses serious difficulties regarding the application of PD-L1 testing in terms of which clone and platform to be used [22, 23]. The fact that we used only one clone can be considered a limitation of this study; since our immunohistochemistry platform is Ventana, we chose clone SP263 for the evaluation and scoring of our specimens. Moreover, Ventana’s SP263 is now CE-marked to provide information on treatment decision in NSCLC for both nivolumab and pembrolizumab.
Another limitation of this study relies in its retrospective nature and the use of TMAs as surrogate of tumor biopsies: in fact, in routine diagnostics, not all biopsies actually correspond to neoplastic tissue; therefore, the applicability of our approach is possible if considering neoplastic biopsies only. However, we believe that such approach is informative, as the neoplastic component present in a trans-bronchial biopsy that we encounter in our clinical practice is similar, in terms of quantity, to the neoplastic component present in each tissue core.
As a matter of fact, in our clinical practice we receive 2-3 transbronchial biopsies per case, each with an average dimension of 1.5 mm2, and 1-2 transthoracic biopsies, each with an average dimension of 4 mm2. Considering that
trans-bronchial biopsies contain an average of 40-50% of non-neoplastic tissue and that we utilized 1 mm-cores, it is reasonable to believe that the amount of neoplastic component present in each diagnostic biopsy is similar in terms of quantity to the one present in each tissue core. Regarding trans-thoracic biopsies, they also
24
contain non-neoplastic parenchyma and the neoplastic component present in 1 transthoracic biopsy corresponds approximately to 2 tissue cores.
Finally, it is possible that other molecules like PD-L2 could play an important role in regulating the extremely complex mechanisms of immune response against tumors. As recently demonstrated by Yearley et al., in fact, PD-L2 expression is predictive of longer progression free survival in patients treated with pembrolizumab[24]: it is reasonable to think that in the future it will be necessary to evaluate the status of other molecules like PD-L2 in order to better stratify patients.
We did not perform PD-L2 evaluation in our cohort and this represents another limitation of our study; the reason is that we lacked sufficient data regarding response to pembrolizumab to draw solid conclusions about this issue.
25
CONCLUSIONS
In conclusion we demonstrate that:
1) if a single random tissue core was available, incorrect categorization might occur in up to 7.9% and 20% of patients with advanced NSCLC eligible for first and second line of therapy with pembrolizumab, respectively; 2) when evaluating multiple cores for PD-L1 assessment, the maximum value across tissue fragments should be considered; 3) in order to reach high concordance with whole sections, 4 and 3 cores are necessary at 1% and 50% cutoffs, respectively; 4) in the first line setting, when at least two cores result positive at 50% cutoff, the false positive cases drop to 1.2%; 5) in the event of less than 3 cores, of which at least 1 with ³ 20% PD-L1-positive cells, the probability of a tumor expressing ³ 50% on whole section is high, with sensitivity and AUC > 0.9; 6) PD-L1 expression concordance between primary and paired metastatic tumor occur in 88% and 91% of cases using 1% and 50% cutoff, respectively; 7) regarding tumor recurrences, we found a lower concordance rate (66%) at 1% cutoff, suggesting the possible need for tumor re-biopsy in the setting of second line of treatment with pembrolizumab. In our view, according to our results, pathologists should describe in their report the number of cores analyzed and the percentage of cells positive for PD-L1 in each core, thus allowing the clinicians to take more confident decision with regard to patient selection for therapy.
An accurate definition of the criteria to determine the PD-L1 status of a given tumor may greatly help to select those patients who could benefit from anti-PD1/PD-L1 treatment.
26 REFERENCES 1. Ishida Y, Agata Y, Shibahara K, Honjo T. Induced expression of PD-1, a novel member of the immunoglobulin gene superfamily, upon programmed cell death. EMBO J. 1992; 11: 3887-95. 2. Nishimura H, Nose M, Hiai H, Minato N, Honjo T. Development of lupus- like autoimmune diseases by disruption of the PD-1 gene encoding an ITIM motif-carrying immunoreceptor. Immunity. 1999; 11: 141-51. 3. Pesce S, Greppi M, Tabellini G, Rampinelli F, Parolini S, Olive D, Moretta L, Moretta A, Marcenaro E. Identification of a subset of human natural killer cells expressing high levels of programmed death 1: A phenotypic and functional characterization. J Allergy Clin Immunol. 2017; 139: 335-46.
4. Pardoll DM. The blockade of immune checkpoints in cancer immunotherapy. Nat Rev Cancer. 2012; 12: 252-64. doi: 10.1038/nrc3239.
5. Brahmer JR. Immune checkpoint blockade: the hope for immunotherapy as a treatment of lung cancer? Semin Oncol. 2014; 41: 126-32.
6. Sholl LM, Aisner DL, Allen TC, Beasley MB, Borczuk AC, Cagle PT, Capelozzi V, Dacic S, Hariri L, Kerr KM, Lantuejoul S, Mino-Kenudson M, Raparia K, et al. Programmed death ligand-1 immunohistochemistry-A new challenge for pathologists: A perspective from members of the pulmonary pathology society. Archives of Pathology and Laboratory Medicine. 2016; 140: 341-4.
7. Yu H, Boyle TA, Zhou C, Rimm DL, Hirsch FR. PD-L1 expression in lung cancer. Journal of Thoracic Oncology. 2016; 11: 964-75. 8. Brahmer JR, Tykodi SS, Chow LQ, Hwu WJ, Topalian SL, Hwu P, Drake CG, Camacho LH, Kauh J, Odunsi K, Pitot HC, Hamid O, Bhatia S, et al. Safety and activity of anti-PD-L1 antibody in patients with advanced cancer. N Engl J Med. 2012; 366: 2455-65. 9. Garon EB, Rizvi NA, Hui R, Leighl N, Balmanoukian AS, Eder JP, Patnaik A, Aggarwal C, Gubens M, Horn L, Carcereny E, Ahn MJ, Felip E, et al. Pembrolizumab for the treatment of non-small-cell lung cancer. N Engl J Med. 2015; 372: 2018-28.
27
10. Reck M, Rodriguez-Abreu D, Robinson AG, Hui R, Csoszi T, Fulop A, Gottfried M, Peled N, Tafreshi A, Cuffe S, O'Brien M, Rao S, Hotta K, et al. Pembrolizumab versus Chemotherapy for PD-L1-Positive Non-Small-Cell Lung Cancer. N Engl J Med. 2016; 375: 1823-33. 11. Taube JM, Klein A, Brahmer JR, Xu H, Pan X, Kim JH, Chen L, Pardoll DM, Topalian SL, Anders RA. Association of PD-1, PD-1 ligands, and other features of the tumor immune microenvironment with response to anti-PD-1 therapy. Clin Cancer Res. 2014; 20: 5064-74. 12. Topalian SL, Hodi FS, Brahmer JR, Gettinger SN, Smith DC, McDermott DF, Powderly JD, Carvajal RD, Sosman JA, Atkins MB, Leming PD, Spigel DR, Antonia SJ, et al. Safety, activity, and immune correlates of anti-PD-1 antibody in cancer. N Engl J Med. 2012; 366: 2443-54. 13. Borghaei H, Paz-Ares L, Horn L, Spigel DR, Steins M, Ready NE, Chow LQ, Vokes EE, Felip E, Holgado E, Barlesi F, Kohlhaufl M, Arrieta O, et al. Nivolumab versus Docetaxel in Advanced Nonsquamous Non-Small-Cell Lung Cancer. N Engl J Med. 2015; 373: 1627-39. 14. Brahmer J, Reckamp KL, Baas P, Crino L, Eberhardt WE, Poddubskaya E, Antonia S, Pluzanski A, Vokes EE, Holgado E, Waterhouse D, Ready N, Gainor J, et al. Nivolumab versus Docetaxel in Advanced Squamous-Cell Non-Small-Cell Lung Cancer. N Engl J Med. 2015; 373: 123-35. 15. Herbst RS, Baas P, Kim DW, Felip E, Perez-Gracia JL, Han JY, Molina J, Kim JH, Arvis CD, Ahn MJ, Majem M, Fidler MJ, de Castro G, Jr., et al. Pembrolizumab versus docetaxel for previously treated, PD-L1-positive, advanced non-small-cell lung cancer (KEYNOTE-010): a randomised controlled trial. Lancet. 2016; 387: 1540-50.
16. (2015) RCT. R: A language and environment for statistical computing. R Foundation for Statistical Computing, Vienna, Austria. URL https://wwwR-projectorg/.
17. Gniadek TJ, Li QK, Tully E, Chatterjee S, Nimmagadda S, Gabrielson E. Heterogeneous expression of PD-L1 in pulmonary squamous cell carcinoma and
28
adenocarcinoma: implications for assessment by small biopsy. Mod Pathol. 2017; 30: 530-8.
18. Ilie M, Long-Mira E, Bence C, Butori C, Lassalle S, Bouhlel L, Fazzalari L, Zahaf K, Lalvée S, Washetine K, Mouroux J, Vénissac N, Poudenx M, et al. Comparative study of the PD-L1 status between surgically resected specimens and matched biopsies of NSCLC patients reveal major discordances: A potential issue for anti-PD-L1 therapeutic strategies. Annals of Oncology. 2016; 27: 147-53. 19. Kitazono S, Fujiwara Y, Tsuta K, Utsumi H, Kanda S, Horinouchi H, Nokihara H, Yamamoto N, Sasada S, Watanabe SI, Asamura H, Tamura T, Ohe Y. Reliability of Small Biopsy Samples Compared With Resected Specimens for the Determination of Programmed Death-Ligand 1 Expression in Non-Small-Cell Lung Cancer. Clinical Lung Cancer. 2015; 16: 385-90.
20. Li C, Huang C, Mok TS, Zhuang W, Xu H, Miao Q, Fan X, Zhu W, Huang Y, Lin X, Jiang K, Hu D, Chen X, et al. Comparison of 22C3 PD-L1 Expression between Surgically Resected Specimens and Paired Tissue Microarrays in Non-Small Cell Lung Cancer. J Thorac Oncol. 2017; 12: 1536-43.
21. Kim S, Koh J, Kwon D, Keam B, Go H, Kim YA, Jeon YK, Chung DH. Comparative analysis of PD-L1 expression between primary and metastatic pulmonary adenocarcinomas. Eur J Cancer. 2017; 75: 141-9.
22. Marchetti A, Barberis M, Franco R, De Luca G, Pace MV, Staibano S, Volante M, Buttitta F, Guerini-Rocco E, Righi L, D'Antuono T, Scagliotti GV, Pinto C, et al. Multicenter Comparison of 22C3 PharmDx (Agilent) and SP263 (Ventana) Assays to Test PD-L1 Expression for NSCLC Patients to Be Treated with Immune Checkpoint Inhibitors. J Thorac Oncol. 2017; 12: 1654-63.
23. Hirsch FR, McElhinny A, Stanforth D, Ranger-Moore J, Jansson M, Kulangara K, Richardson W, Towne P, Hanks D, Vennapusa B, Mistry A, Kalamegham R, Averbuch S, et al. PD-L1 Immunohistochemistry Assays for Lung Cancer: Results from Phase 1 of the Blueprint PD-L1 IHC Assay Comparison Project. Journal of Thoracic Oncology. 2017; 12: 208-22.
29
24. Yearley JH, Gibson C, Yu N, Moon C, Murphy E, Juco J, Lunceford J, Cheng J, Chow LQM, Seiwert TY, Handa M, Tomassini JE, McClanahan T. PD-L2 Expression in Human Tumors: Relevance to Anti-PD-1 Therapy in Cancer. Clin Cancer Res. 2017; 23: 3158-67. ACKNOWLEDGMENTS I would like to thank Prof. Lorenzo Moretta (Immunology research area, Bambino Gesù Pediatric Hospital, Rome) for sharing resources and providing important insights for this work; Dr. Giuseppe Bogina (Department of Pathology, Sacro Cuore Hospital, Negrar – VR) for his fruitful considerations in defining the methodology and Marcella Marconi (Department of Pathology, Sacro Cuore Hospital, Negrar – VR) for her technical support and irreplaceable expertise in immunohistochemistry.