ORIGINAL RESEARCH
Composite Indicators to Measure Quality of Working Life
in Europe: A Systematic Review
Elena Stefana1 · Filippo Marciano1 · Diana Rossi1 · Paola Cocca1 ·
Giuseppe Tomasoni1 Accepted: 15 April 2021 © The Author(s) 2021
Abstract
In the last two decades, Quality of Working Life (QWL) has become a core element of the European social model and the European Employment Strategy. “More and better jobs” is a strategic goal promoted within Europe for emphasising the attention in QWL. However, there is a large debate in the literature on the definition of QWL, its dimensions, and con-sequently on the methods to use for its measurement. To the best of our knowledge, the systematic reviews currently available in the literature on QWL measurement in European organisations investigate only a particular industry and/or working population. Moreover, they do not focus specifically on composite indicators, although they appear promising in facilitating QWL understanding and comparisons for supporting decision-makers and policy makers. To overcome these gaps, we conducted a systematic review to identify com-posite indicators for measuring QWL in European organisations. The review returned 19 studies that are analysed based on a set of factors related to QWL locutions, index name, geographical area, industry or population, level of analysis, dimensions, type of data, inputs, outputs, and test and/or validation. The results highlight a significant heterogeneity among the indicators, confirming the lack of an agreed upon QWL composite indicator for Europe. Such heterogeneity concerns also QWL dimensions. A critical comparison of the different composite indicators is provided, along with a unifying proposal of QWL macro-dimensions. Several gaps in the literature are pointed out suggesting directions for future research.
Keywords Job quality · Good job · Decent work · Employment · European Union · Composite indicator
1 Introduction
Quality of Working Life (QWL) has become subject of growing interest within the eco-nomic, social, sociological, and psychological research (Boccuzzo & Gianecchini, 2015; Díaz-Chao et al., 2016; Simões et al., 2015). An enhancement in QWL can bring benefits * Elena Stefana
to workers and companies, improving working conditions, fostering workers’ health and well-being, increasing work motivation, developing workers’ skills, promoting sustainable work, growing productivity and competitiveness, and reducing unemployment (e.g. Díaz-Chao et al., 2017; Muñoz de Bustillo et al., 2009, 2011a; Santero-Sanchez et al., 2015; Šverko & Galić, 2014).
The literature has not reached a general agreement neither on a comprehensive QWL definition, nor on its measurement (e.g. Bäck-Wiklund et al., 2011; Barroso, 2018; Hurley et al., 2012; Jones et al., 2017; Leschke & Watt, 2014; Muñoz de Bustillo et al., 2011b; Schokkaert et al., 2011). QWL measurement is currently performed through a wide vari-ety of indicators and methods (e.g. Boccuzzo & Gianecchini, 2015; Crespo et al., 2017; Muñoz de Bustillo et al., 2009). Some reviews investigating QWL measurements in a spe-cific work sector or geographical area and/or focusing on a particular scientific database are available in the literature. For example, Muñoz de Bustillo et al. (2011b) provide a critical survey of 19 job quality indicators or systems of indicators developed for differ-ent scopes or contexts (e.g. European Union, developed and developing countries, USA). Phan and Vo (2016) analyse studies about specific tools and scales to assess QWL in medi-cal organisations. Barroso (2018) has recently performed a methodological review of the most-cited articles indexed in the Scopus database to assess progress in the harmonisa-tion of QWL concepts and measurement. However, these reviews do not focus specifically on composite indicators as a possible methodology for QWL measurement, although such approach appears particularly effective. A composite indicator for QWL measurement is “a single aggregate measure synthesizing the information of all the different attributes of job quality” (Muñoz de Bustillo et al., 2011b), and “the mathematical combination of indi-vidual indicators, each of which is related to a particular dimension of the phenomena to be analysed” (Santero-Sanchez et al., 2015). A composite indicator allows a univocal and unidirectional understanding of what QWL is, positioning and ranking the studied subjects or groups within a one-dimensional axis going from bad to good, as underlined by Muñoz de Bustillo et al. (2011b). The interest in composite indicators is largely acknowledged, since they are useful to: summarise complex or multi-dimensional issues for supporting decision-makers; enable users to compare complex dimensions effectively; reduce the size of a list of indicators; plan targets and control their achievement; attract public interest; and provide a transparent way for policy makers and public opinion (e.g. OECD and JRC Euro-pean Commission, 2008; Saltelli, 2006; Tangian, 2005). Composite indicators have gained astounding popularity in all research areas, and can reflect a complex system consisting of numerous components, making it easier to understand in full rather than reducing it back to its spare parts (Greco et al., 2019).
Based on these arguments, the aim of this article is to carry out a systematic review to identify the composite indicators available in the literature for measuring QWL at the indi-vidual worker, job, or company level.
We decided to narrow the scope of our analysis to European organisations. Although the sense of a good job, working conditions, and rights could be slightly different across countries (Burgess & Connell, 2008; Sojka, 2014), through the Community Charter of the Fundamental Social Rights of Workers adopted in 1989 all the European Member States have committed to establish a shared social policy and shape the development of the Euro-pean social model, thus fostering a common understanding also of QWL concept. In the last two decades, QWL has become a core element of the European social model and the European Employment Strategy (e.g. Bothfeld & Leschke, 2012; Dahl et al., 2009; Pena-Casas, 2009; Smith et al., 2008). Indeed, a strategic pillar of the European Employment Strategy and the Lisbon Strategy has been to promote more and better jobs within Europe
(European Commission 2001b), and the improvement of working conditions and job qual-ity continues to be a significant goal in European policies, underpinning Europe’s capacqual-ity to compete (Eurofound, 2017).
The results of our review will allow: (1) summarising the state of the art of the scientific literature concerning the various composite indicators for measuring QWL; (2) identifying similarities and differences among the several approaches; (3) comparing them for support-ing the selection of the most suitable composite indicator for the QWL measurement in a specific European organisation; and (4) revealing possible gaps in the literature that should be addressed thanks to future research for reaching a consensual QWL measure.
2 Theoretical Background
The first important attempts to define QWL were by both Boisvert and Morton in 1977. The former states that QWL is a “set of beneficial consequences of working life for the individual, the organization and society” (Boisvert, 1977), while the latter refers to this concept as “every conceivable aspect of the work ethic and working conditions”, including objective measures of working conditions, workers’ expressions of satisfaction and dissat-isfaction, and broader considerations of social cohesion and stability (Morton, 1977). Over the decades, several researches have emphasised different elements of this topic: according to Efraty and Sirgy (1990), and Sirgy et al. (2001), QWL is a conceptualisation related to satisfaction of various needs, whereas recently it has been linked to workers’ own evalu-ations of job (Burchell et al., 2014) and individuals’ subjective perception of their jobs (Santero-Sanchez et al., 2015).
Besides QWL, a plethora of related terms are used in the literature: “job quality”, “employment quality”, “quality of work”, “quality in work”, “good job”, “quality of life at work”, or “decent work”.
Job quality is related to the set of work-and employment-related factors that have a posi-tive and direct effect on the worker’s well-being (Boccuzzo & Gianecchini, 2015). Accord-ing to Eurofound (2012), it is the utility that a worker derives from his/her job, depending on job features (according to the subjective tradition), and is constituted by the job features and attributes that meet workers’ needs from work (in the objective tradition). All these aspects are well summarised by Díaz-Chao et al. (2016, 2017), and Ficapal-Cusí et al. (2018), who describe job quality as an overall state of satisfaction that includes objective aspects of material well-being, satisfactory relationships with the physical and social envi-ronment, and objectively perceived health; and subjective aspects of physical, psychologi-cal and social well-being. Muñoz de Bustillo et al. (2009, 2011b) consider job quality as a set of employment quality and work quality. The former indicates all the elements poten-tially affecting workers’ well-being related to the employment relation (e.g. type of con-tract, working hours, distribution of working hours, wage, social benefits), while the latter the ways that the activity of work itself and the conditions under which it is undertaken can affect the well-being of workers (e.g. work autonomy, physical working conditions, risk of accidents, social working environment). Steffgen et al. (2015) agree with these definitions, highlighting that quality of work is a concept that bridges the gap between job quality and employment quality. Other authors (Burchell et al., 2014; Santero-Sanchez et al., 2015) quote the terms “job quality” and “quality of work”, referring as a concept focusing on the (objective) job content and work environment.
European Commission (2001a) defines quality in work (better jobs) as a relative and multi-dimensional concept taking into account objective characteristics of employment, worker characteristics, the match between worker characteristics and job requirements, and the subjective evaluation (job satisfaction) of these characteristics by the individual worker. Job satisfaction is contained also in the good job definition provided by Bang and Lee (2006): a good job is a concept related to wages as an economic compensa-tion, to job status as a social status, and to job satisfaction as a subjective psychological criterion.
Job satisfaction can be characterised as “a global feeling about the job or as a related constellation of attitudes about various aspects or facets of the job” (Spector, 1997). Although some researchers (e.g. Diaz-Serrano & Vieira, 2005; Hurley et al., 2012; Simões et al., 2015) propose job satisfaction as a possible proxy of QWL, it is one of many pos-sible outcomes of QWL not sufficient by itself for its complete description, and thus QWL is considered a much broader concept than job satisfaction (Carpita & Golia, 2012; Lawler, 1975; Sirgy et al., 2001; Sojka, 2014).
Another locution frequently mentioned in the literature related to QWL is “decent work”, which refers to the converging focus of all the four strategic objectives of the Inter-national Labour Organization (ILO): promotion of rights at work, employment, social pro-tection, and social dialogue (ILO, 1999). Ferraro et al. (2018) describe it as a concept cre-ated for promoting economic and social human development in the formal and informal economy. In other words, decent work is related to meaningful work and ethics that ensure fundamental values and principles at work through social dialogue among those involved in the decision-making processes regarding that work (Ferraro et al., 2017). The European Foundation for the Improvement of Living and Working Conditions (Eurofound) states that the decent work concept is similar in spirit but broader in the scope of needs that it addresses than job quality (Eurofound, 2012).
The above concise overview highlights the several differences and overlaps among all the QWL-related terms, which are often used interchangeably and indistinctively. For instance, Burchell et al. (2014) point out that expressions such as “quality of working life”, “job quality”, “quality of job”, “quality of employment”, and “decent work” are often used interchangeably and without clear definitions; Steffgen et al. (2015) remark that the terms “job quality”, “quality of job”, and “employment quality” are often used interchangeably, and clearly defining them remains a challenge; and Barroso (2018) states that the concept of “quality of work” is often used indistinctively from notions of “quality of working life” or “job quality”.
The difficulties related to a shared QWL definition arise mainly from its multidimen-sional nature (Schnalzenberger et al., 2014; Schokkaert et al., 2011). This multidimen-sional nature should be captured by any indicator for the QWL measurement: the various dimensions affecting the work and employment should be defined, considered, and aggre-gated based on their impact on QWL (Muñoz de Bustillo et al., 2009, 2011a). Therefore, QWL should be evaluated by means of a multidimensional approach by using a combina-tion of objective and subjective data and informacombina-tion (Díaz-Chao et al., 2016, 2017; Hurley et al., 2012). Indeed, two perspectives can be identified in the literature: (1) an objective one, linked to working environment characteristics and objective features of the job, such as security, ergonomics, technology, management systems, organisation processes, and sal-ary, and (2) a subjective one, relating to employee work preferences and their perceived fulfilment, e.g. satisfaction, attitudes, motivation, commitment, and pride (Díaz-Chao et al., 2016; Holman, 2013). As a consequence, the QWL measurement methods can adopt an objectivist approach, a subjectivist approach, or a multi-faceted approach. Multi-faceted
approaches represent a mix of the two, including both objective facets of the job and sub-jective perceptions of the worker (Boccuzzo & Gianecchini, 2015).
In addition, a combination of dynamic and static interpretations should be adopted (Díaz-Chao et al., 2016, 2017), since the dimensions and conditions establishing QWL may change and evolve over time, varying across locations, countries, organisations, and industries, and among individuals, in terms of preferences and priorities (Burgess & Con-nell, 2008; Jones et al., 2017; Sojka, 2014). In particular, individuals’ evaluations of job quality evolve over time, as an individual’s work experience at any one time determines his/her expectations about future work activities and affect his/her work-related behaviours (Boccuzzo & Gianecchini, 2015).
Consequently, the required wide-ranging data and information, the numerous sets of possible dimensions, and the actual multidimensional nature of QWL make the definition of a QWL indicator a debated topic (Muñoz de Bustillo et al., 2009, 2011a).
To capture all these concepts in their broadest sense, we refer mainly to “quality of working life” locution in this paper, using all the previous locutions (with the exception of job satisfaction) as synonyms in our literature selection and review. We consider “working life” as the employees’ experience of working conditions and work-life balancing issues that can impact their lives. Consequently, QWL is the set of characteristics of work, charac-teristics of working and non-working life balance, and employees’ evaluation of these char-acteristics. Our aim is to obtain the widest spectrum of composite indicators for measur-ing QWL, includmeasur-ing both objectivist and subjectivist approaches, both static and dynamic interpretations, in order to characterise the state of the art of the literature and correlate the several existing locutions with the main features and dimensions of the different composite indicators. Indeed, the provision of a comprehensive overview could allow researchers and practitioners to select the indicator that best suits their needs and/or give them useful infor-mation to build a new indicator.
3 Methods
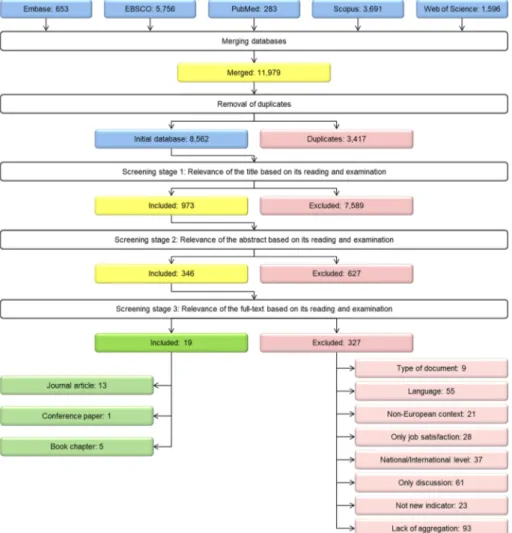
A systematic review allows identifying key scientific contributions to a field, and exploring a clearly specified question (Denyer & Tranfield, 2009; Tranfield et al., 2003). Since our systematic review fits the management and organisation studies, we conducted it according to the principles and guidelines defined by Briner and Denyer (2012), Denyer and Tran-field (2009), Denyer et al. (2008), and Tranfield et al. (2003), following the steps shown in Fig. 1 and described in the next paragraphs.
3.1 Research Question and Eligibility Criteria
The systematic review begins with the research question formulation to establish its focus. Our research question is: “Which composite indicators can be used to measure QWL in European organisations?”. For our review, we adopted the framework based on CIMO logic and concepts (Denyer et al., 2008). In particular, the CIMO keywords have been defined as follows:
• Context (C): Europe; • Interventions (I): QWL;
• Outcome (O): indicator.
To capture all relevant studies and produce a comprehensive review, we defined a set of synonyms and related terms for each CIMO keyword thanks to the conduction of scoping studies. We expressed the Context concept through nouns and adjectives of Europe (polit-ico-economic union), European regions and/or countries: we did not specify more detailed geographical areas (e.g. cities or districts). The defined synonyms are listed in Table 1.
The relevance of each study to the research question was assessed based on the inclu-sion (or eligibility) and excluinclu-sion criteria listed in Table 2.
3.2 Locating Studies
By means of synonyms and related terms of each CIMO keyword, Boolean operators, and simple operators (e.g. truncation characters), we constructed several search strings to adhere to the different search conventions of each database. The following key databases within the field of management were searched, considering studies published before 31 Fig. 1 Search strategy and analysis of the selected studies
Table 1 Synon yms of eac h CIMO k eyw or d CIMO concep t Ke yw or d Synon yms Conte xt Eur ope Aus tria, A us trian, Balk
an, Baltic, Belgium, Belgian, Benelux, Br
itish, Bulg ar ia, Bulg ar ian, Cypr us, Cypr io t, Czec hia, Czec h, Danish, Denmar k, Dutc h, Eng lish, Es tonia, Es tonian, Eur opean, F inland, F inn -ish, F rance, F renc h, Ger man, Ger man y, Gr eece, Gr eek , Holland, Hung ar y, Hung ar ian, Iber ia, Iber ian, Ireland, Ir ish, It aly , It
alian, Latvia, Latvian, Lit
huania, Lit huanian, L ux embour g, L ux embour gish, Malt a, Maltese, N et her lands, P oland, P olish, P or tug al, P or tuguese, R omania, R omanian, R umania, R umanian, Scandina via, Scandina vian, Slo vak , Slo vakia, Slo vakian, Slo vene, Slo venia, Slo
venian, Spain, Spanish,
Sw eden, Sw edish, U nited Kingdom Inter ventions QWL Be
tter job, Decent w
or
k, Em
plo
yment q
uality
, Good job, Good w
or k, Job q uality , Quality at w or k, Quality em plo yment, Quality f eatur e of job, Quality f eatur e of w or k, Quality in w or
k, Quality job, Quality of
em
plo
yment, Quality of lif
e at w or k, Quality of t he em plo yment, Quality of w or k, Quality of w or king lif e, W or k lif e q uality , W or king lif e q uality , W or k q uality , W or k-r elated q uality Outcome Indicat or Anal yse, Anal
ysis, Application, Appl
y, Appr
oac
h, Assess, Assessment, A
udit, Classification, Classify
, Com par e, Com par ison, Cor relate, Cor
relation, Decision, Define, Definition, Demons
trate, Demons tra -tion, Descr ibe, Descr ip tion, Design; De ter mine, De ter mination, Eq uation, Es timate, Es timation, Ev alu -ate, Ev aluation, Ex am, Ex amine, Ex amination, Explor e, Explor ation, F rame wor k, Inde x, In ves tig ate, In ves tig
ation, Map, Mean, Measur
e, Measur ement, Me thod, Me thodology , Model, Pr edict, Pr ediction, Pr og ram, Pr oposal, Pr opose, R ank , R elate, R elation, R evie w, S tudy , Summar ise, Summar y, Sur ve y, Tec hniq ue, T es t, Theor y, T ool, V aluate, V aluation
Table 2 Inclusion and e xclusion cr iter ia Aspect Inclusion (eligibility) cr iter ion Ex clusion cr iter ion Type of document Jour nal ar ticle, conf er ence paper , book c hap ter , case s tudy , and mag azine ar ticle if inde xed b y t he selected dat abases Re vie w, edit or ial, le tter , onl y abs
tract (e.g. Gug
lielmi e t al., 2010 ) Languag e Eng lish full-te xt Ot her languag e (e.g. Pusc h & R ehm, 2017 ) Conte xt Study pr oposing a com posite indicat or specific t o, or declar ed e xplicitl y applicable t o, t he Eur opean conte xt Study pr oposing a com posite indicat or wit hout specifying t he g eog raphical conte xt (e.g. Mar
tel & Dupuis,
2006 ), or onl y applicable f or non-Eur opean conte xts (e.g. Secapr amana & N ug roho, 2017 ) Inter ventions Study pr oposing a com posite indicat or t o measur e QWL Study consider
ing job satisf
action as a pr
oxy of QWL (e.g. Leont
ar idi e t al., 2005 ) Study pr oposing a com posite indicat or measur ing QWL at t he individual wor ker -job or com pan y le vel Study pr oposing a com posite indicat or measur ing QWL at t he national or inter national le vel (e.g. W eink opf, 2014 ), or e xplicitl y declar ed f or cr oss-countr y com par
ison (e.g. Lesc
hk e & W att, 2014 ) Outcome Study pr oposing a ne w com posite indicat or f or measur ing QWL Study solel y f ocused on a q ualit ativ e discussion of some f eatur es of t he concep t (e.g. Simms, 2017 ), or pr esenting measur es t o im pr ov e QWL (e.g. Stepano va e t al., 2015 ) Study pr esenting an application of pr eviousl y defined com posite indicat ors (e.g. V inopal, 2012 ), or r ef er ring t o o ther s tudies f or r ele vant de tails about the indicat or (e.g. Sut her land, 2016 ) Study pr oposing sy stems of indicat ors, consider
ing one or mor
e dimensions
wit
hout agg
reg
ation (e.g. Jones e
t al., 2017 ), or measur ing t he self-ev aluated/self-per ceiv ed QWL t hr ough a sing le q ues
tion (e.g. Dolan e
t al.,
2008
July 2018: EBSCO (all databases, scholarly journals), EMBASE, Emerald, PubMed, Sco-pus, and Web of Science. A starting date was not defined in order not to exclude potentially relevant papers and to extend the search from the date of the oldest indexed paper of each database.
Scoping studies help to assess the relevance and size of the literature and to delimit the subject area or topic (Tranfield et al., 2003). Based on the outcomes of preliminary scoping studies, we searched for keywords and synonyms of the Context and Interventions concepts only in title, abstract, and keywords fields. On the contrary, terms related to the Outcome concept were searched in all the available fields to maximise the results provided by biblio-graphic databases.
We employed Endnote® X9 as a reference management software for recording refer-ences, storing information accurately, removing multiple records, and creating a unique database of references. The subsequent manual removal of other duplicates allowed obtain-ing a unique library representobtain-ing our initial database.
3.3 Study Selection
We performed the study selection through a screening process in a Microsoft® Excel spreadsheet created from the initial database. The screening process consisted of three stages (Stefana et al., 2015): (1) title evaluation, (2) abstract and keywords evaluation, and (3) full-text evaluation. In each stage, three reviewers critically appraised the records in parallel; all the documents selected by at least one reviewer have been promoted to the suc-cessive screening stage to minimise the chance to discard relevant papers.
In particular, irrelevant studies were removed during screening stages (1) and (2), as established by Higgins and Green (2008). For example, we discarded the studies related to the quality of products or tasks performed by workers, and documents identified as reviews or editorials.
During the last screening stage, we examined the full-texts of the remaining documents based on all the eligibility criteria listed in Table 2. As a consequence, we collected the included documents in the final database (i.e. the documents that answer the research ques-tion), and recorded the primary reason for exclusion of the other papers.
The intermediate and final results of the study selection process are summarised in Fig. 2, as recommended by Moher et al. (2009).
Finally, we characterised and analysed the documents included in the final database. These documents provide the answer to the research question, whose main features are described in detail in the following sections.
4 Results
The systematic review returned 19 documents, each one proposing a different composite indicator to assess QWL. The majority are journal articles (13 out of 19), a few book chap-ters (5 out of 19) (Clark, 2005; McClelland & Holman, 2015; Muñoz de Bustillo et al., 2011a; Paugam & Zhou, 2008; Ventegodt et al., 2009), and only one is a conference paper (Addabbo et al., 2007). The journal that published the highest number of papers is “Social Indicators Research” with 3 papers, followed by “Work, Employment and Society” with
2 papers. The most recent papers (i.e. Arranz et al., 2018; Warren & Lyonette, 2018) are published in these two journals.
In order to analyse the documents of the final database, we identified a set of factors use-ful to highlight the distinguishing features of the proposed composite indicators: (1) terms and locutions used for describing the QWL concept; (2) name of the index; (3) geographi-cal area in which the study is carried out; (4) industrial sector or population for which the composite indicator is developed; (5) level of analysis of the QWL composite indicator (individual worker-job/company), (6) QWL dimensions considered by the composite indi-cator; (7) type of data employed for the study (primary/secondary); (8) type of inputs of the composite indicator (subjective/objective); (9) type of composite indicator outputs (quali-tative/quantitative); and (10) composite indicator test and/or validation. Table 3 shows the characterisation and comparison of the 19 documents with respect to such factors.
Table 3 Com par ison of QWL com posite indicat ors Ref er ence QWL locutions Inde x name Geog raphical ar ea Indus try or population Le vel of anal ysis Dimensions Contr ol Economic Er gonomic Com ple xity Social W or k lif e bal -ance Addabbo e t al. ( 2007 ) Quality of w or k Quality of w or k Ital y No t defined Individual wor ker -job × × × × × × Ar genter o e t al. ( 2007 ) Quality of w or k lif e Quality of w or k lif e Ital y Healt h or gani -sations Individual wor ker -job × × × × × Ar ranz e t al. ( 2018 ) Job q uality , Em plo yment quality (no t
focus on intrinsic q
ual -ity of w or k) Em plo yment Quality Inde x (EQI) Ital y, Spain No t defined Individual wor ker -job × × ×
Boccuzzo and Gianecc
hini ( 2015 ) Job q uality
Job Quality Com
posite Indicat or (JQCI) Ital y Young g radu -ates Individual wor ker -job × × × × Clar k ( 2005 ) Job q uality , Good job Job q uality inde x Eur opean countr ies of OECD No t defined Individual wor ker -job × × × × Cr espo e t al. ( 2017 ) Job q uality , Good job Job q uality inde x 27 EU Member St ates No t defined Individual wor ker -job × × × × × × De W aal e t al. ( 2012 ) Quality of w or k Quality of w or k The N et her -lands Insur ance com pan y Individual wor ker -job × × Gor jup e t al. ( 2009 ) Job q uality Job q uality inde x Spain Call centr es Com pan y × Heisk anen and Jokinen (2014 ) Quality of wor king lif e Quality of wor king lif e Finland Social, healt h, education, adminis tra -tion sect ors Individual wor ker -job × × ×
Table 3 (continued) Ref er ence QWL locutions Inde x name Geog raphical ar ea Indus try or population Le vel of anal ysis Dimensions Contr ol Economic Er gonomic Com ple xity Social W or k lif e bal -ance Holman ( 2013 ) Job q uality Job q uality Aus tria, Den -mar k, F rance, Ger man y, Sw eden, United King -dom Call centr es Com pan y × × × × Jones e t al. ( 2014 ) Job q uality , Good w or k, Good job Deutsc her Ge wer k-sc haf tsbund Good w or k Inde x (DGB-Inde x) United King -dom Bus dr iv ers Individual wor ker -job × × × × × ×
McClelland and Holman (2015
) Job q uality ; Quality of job To
tal Job Quality Inde
x (T JQI) 27 EU Member St ates No t defined Individual wor ker -job × × × × ×
Table 3 (continued) Ref er ence QWL locutions Inde x name Geog raphical ar ea Indus try or population Le vel of anal ysis Dimensions Contr ol Economic Er gonomic Com ple xity Social W or k lif e bal -ance Muñoz de Bus tillo e t al. ( 2011a ) 1 Job q uality Job q uality inde x Aus tria, Belgium, Bul -gar ia, Cypr us, Czec h R epub -lic, Denmar k, Es tonia, F in -land, F rance, Ger man y, Gr eece, The Ne ther lands, Hung ar y, Ireland, It aly , Latvia, Lit hu -ania, L ux em -bur g, Malt a,
Poland, Portug
al,
Romania, Slovakia, Slovenia, Spain, Sw
e-den, U nited Kingdom No t defined Individual wor ker -job × × × × × ×
Table 3 (continued) Ref er ence QWL locutions Inde x name Geog raphical ar ea Indus try or population Le vel of anal ysis Dimensions Contr ol Economic Er gonomic Com ple xity Social W or k lif e bal -ance Paug am and Zhou ( 2008 ) Job q uality ,
Quality of job, Quality of w
or k lif e, Quality of wor k, W or k quality Job q uality Denmar k, Fr ance, Ger man y, Spain, Sw e-den, U nited Kingdom No t defined Individual wor ker -job × × × × × × Santer o-Sanc hez e t al. ( 2015 ) Job q uality Com posite Inde x of
Job Quality (CIJQ)
Spain Hospit ality indus try Individual wor ker -job × × × × Simões e t al. ( 2015 ) Job q uality Job q uality inde x 27 EU Member St ates (e xcluded Lux embour g, Malt a, Es to -nia, Slo venia) No t defined Individual wor ker -job × × × × × × Sojk a ( 2014 ) Quality of w or k lif e Quality of w or k lif e Slo vakia No t defined Individual wor ker -job × × × × × Ventegodt e t al. ( 2009 ) Quality of wor king lif e, W or king lif e quality Quality of wor king lif e Denmar k No t defined Individual wor ker -job × × × × × W ar ren and Ly one tte ( 2018 ) Job q uality , Good w or k, Good job Job q uality Br itain No t defined Individual wor ker -job × × × × ×
Table 3 (continued) Dat a In puts Outputs Tes t and/or v alidation Pr imar y Secondar y Subjectiv e Objectiv e Qualit ativ e Quantit ativ e × × 0–1 Tes t on a sam ple × (Semi-s tructur ed inter vie ws) × 0–100 Tes t on a sam ple × (Spanish and It alian Labour F or ce Sur ve y) × 0–100 Tes t on a sam ple, inde x tes ted f or robus tness × (A gor à Sur ve y) × × 0–1 Tes t on a sam ple, v alidation × (Inter
national Social Sur
ve y Pr o-gr amme) × × 0–7 Tes t on a sam ple x (Eur opean W or king Conditions Sur ve y) × × 0–1 Tes t on a sam ple × (Inter ne t q ues tionnair e) × 0–1 Tes t on a sam ple, v alidation × (Mail sur ve y, f ace-t o-f ace q ues tion -nair e) × 0–100 Tes t on a sam ple, v alidation x (W eb-based/paper q ues tionnair e) × × 1–5 Tes t on se ver al sam ples × (Mail/online/telephone ques tion -nair e) × 0–100 Tes t on se ver al sam ples × (Ques tionnair e) × × 0–100 Tes t on a sam ple × (Eur opean W or king Conditions Sur ve y) × 0–100 Tes t on a sam ple, v alidation × (Eur opean W or king Conditions Sur ve y) × × 0–100 Tes t on a sam ple × (Eur obar ome ter sur ve ys) × 1–4 Tes t on a sam ple × (Spanish N ational Labour F or ce) × Real number Tes t on a sam ple, v alidation × (Eur opean W or king Conditions Sur ve y) × × 0–1 Tes t on a sam ple × × × 0–1 No t tes ted
Dat a In puts Outputs Tes t and/or v alidation Pr imar y Secondar y Subjectiv e Objectiv e Qualit ativ e Quantit ativ e × (Self-adminis ter ed ques tionnair e) × 0–90 Tes t on a sam ple, no t full y v alidation × (Skills and Em plo yment Sur ve y) × × × 0–12 Tes t on a sam ple The r esults f or Muñoz de Bus tillo e t al. ( 2011a ) ar e based on Chap ter 5 titled “ The cons truction of a Eur opean job q uality inde x” Table 3 (continued)
4.1 Terms and Locutions for the QWL Concept, and Index Name
More than ten phrases are used to express the QWL concept. The majority of the studies (10 out of 19) refer to “job quality” and/or locutions composed by “quality” and “job”, while 7 papers use “quality” and “work” terms. The other studies adopt various locutions, e.g. employment quality and good job/work. None paper refers to “decent work”, prob-ably because the papers using such wording usually aim to inform policy makers and focus on comparisons among countries using also data on the labour market, which cannot be referred to the individual worker/job or company level. The name of the index usually coin-cides with the locution used to express the QWL concept. Only three papers make explicit the multidimensional nature of the index including in the name terms such as “composite” (Boccuzzo & Gianecchini, 2015; Santero-Sanchez et al., 2015) or “total” (McClelland & Holman, 2015).
4.2 Geographical Area, Industry or Population, and Level of Analysis
The majority of the documents (11 out of 19) focus on only one European country. Three papers are concentrated only on Italy, but on different populations. Specifically, Argentero et al. (2007) concentrate the attention on health workers in seven different operating units, Boccuzzo and Gianecchini (2015) analyse young graduates, and Addabbo et al. (2007) test their model through a sample of employees working in firms of different sizes and belong-ing to different industries. Two articles consider only Spain: Gorjup et al. (2009) examine call centre workers, and Santero-Sanchez et al. (2015) pay attention to hospitality industry. Two studies are carried out in the United Kingdom: Jones et al. (2014) investigate bus drivers, while Warren and Lyonette (2018) women workers in part-time jobs in Britain. One document (Ventegodt et al. 2009) concentrates on Denmark, whereas another (Heis-kanen & Jokinen, 2014) on Finnish municipalities. Lastly, De Waal et al. (2012) examine workflow management system end users in a social insurance company in the Netherlands, while Sojka (2014) studies QWL in Slovakia.
Other documents propose QWL composite indicators applied in multiple countries. For instance, Arranz et al. (2018) provide an index that serves to measure employment quality both in Spain and in Italy. Holman (2013) focuses on call centre agents in Aus-tria, Denmark, France, Germany, Sweden, and UK, whereas Paugam and Zhou (2008) on industry, and retail and hotels in Denmark, France, Germany, Spain, Sweden, and UK. The remaining five documents (i.e. Clark, 2005; Crespo et al., 2017; McClelland & Holman, 2015; Muñoz de Bustillo et al., 2011a; Simões et al., 2015) refer to a larger set of European countries.
In terms of the level of analysis, only two composite indicators are calculated at the company level (Gorjup et al., 2009; Holman, 2013). Both of them focus on call centres. All the other QWL composite indicators are intended to assess the individual worker or job, and can usually be aggregated to compare types of work, group of workers, or labour mar-kets. For example, Arranz et al. (2018) aggregate individual values of their employment quality index to compare workers that hold an open-ended contract, with workers with tem-porary contracts hired directly by companies, and those working through a temtem-porary help agency across different countries. McClelland and Holman (2015) consider job quality of vulnerable workers in growing and declining sectors of the European economy by aggre-gating their Total Job Quality Index by gender, age, and sector for comparison.
4.3 QWL Dimensions
Our review confirms that the number of dimensions considered to calculate QWL is highly variable, ranging from 2 (De Waal et al., 2012) to 22 (Ventegodt et al., 2009). In addi-tion, the different authors refer to dimensions by means of various names, such as dimen-sions, variables, or components. A list of the dimensions considered in each document is presented in Table 4 located in Appendix. To enable a comparison of the proposed com-posite indicators we decided to classify the dimensions considered by each indicator into six macro-categories, namely: control, economic, ergonomic, complexity, social, and work life balance. These categories, adapted from the proposals by Addabbo et al. (2007) and McClelland and Holman (2015), have been selected since they appear to be able to accom-modate the miscellaneous dimensions included in the 19 QWL composite indicators identi-fied in the literature.
The “control” dimension refers to the degree of freedom or discretion the worker has within his/her job, for example in terms of autonomy in managing working rhythms, pos-sibility of direct agreement with colleagues and management/entrepreneur. We include in this dimension also the features of jobs that allow workers to speak up about work-related issues of importance to them, in terms of representation and voice.
In the “economic” dimension we consider the remuneration of the job and its security, for example in terms of earnings, seniority, job security, social insurance, profit sharing, wage, career perspectives, and protection.
The “ergonomic” dimension refers to working conditions and environment, for example in terms of work environment (e.g. individual space, smokes and fumes, dust), pace and intensity, cognitive effort, and stress.
The “complexity” dimension assesses the requirement for workers to use or develop skills within their job, for instance in terms of acknowledgment of one’s capabilities, job variety and richness, effort required, and training.
The “social” dimension deals with the quality of workers’ relationships with colleagues, management/entrepreneur, and subordinates, considering also elements connected to oth-ers’ esteem, acknowledgment of professional abilities, sharing firm’s decision, work life satisfaction, and job satisfaction.
The “work life balance” dimension considers the possibility for the workers to balance their work and life commitments, for instance in terms of maternity protection, paren-tal leaves, management and availability of paid holidays, participation of employees in management of working hours distribution and shifts, and availability of family-friendly policies.
The results show that the dimensions considered by the majority (84%) of the QWL composite indicators are “control”, “economic”, and “complexity”. The less considered are “social” and “work life balance”, respectively in 11 and 12 indicators out of 19. Only 6 composite indicators integrate all QWL dimensions, while 4 indicators focus only on 3 dimensions or less.
4.4 Data, Inputs, Outputs, and Test and/or Validation
One of the main differences among the QWL composite indicators proposed in the lit-erature concerns the data used for their calculation. In 8 cases out of 19 the study relies on primary data (i.e. data specifically gathered for the purpose of that study), whereas in the remaining 11 cases on secondary data (i.e. data collected for other purposes and then
reused). Unfortunately, only for half of the studies collecting primary data the full set of questions/items used is provided (De Waal et al., 2012; Gorjup et al., 2009; Heiskanen & Jokinen, 2014; Ventegodt et al., 2009). The main source of secondary data appears to be the European Working Condition Survey (EWCS), which is used in 4 cases. Three of them also specify the questions of the EWCS providing the data necessary for calculating the composite indicator (Crespo et al., 2017; Muñoz de Bustillo et al., 2011a; Simões et al., 2015). The EWCS has been run every five years since 1990 in European countries sur-veying a random sample of workers, both employees and self-employed. Other sources of secondary data are national labour force surveys (e.g. Arranz et al., 2018; Santero-Sanchez et al., 2015; Warren & Lyonette, 2018), European surveys (e.g. Paugam & Zhou, 2008), and the International Social Survey Programme (Clark, 2005).
The three approaches traditionally employed in QWL measurement (i.e. subjectivist, objectivist, multi-faceted) are well represented in the results of our review. Indeed, the majority of QWL composite indicators adopt either a subjectivist (7 out of 19) or multi-faceted approach (7 out of 19), while only 5 a purely objectivist one. The composite indica-tors adopting a purely objectivist approach mainly use “job quality” locution. Furthermore, it emerges that all the indicators that consider the “social” dimension need to rely on sub-jective inputs. Indeed, it would be difficult to assess the quality of workers’ relationships through objective data. The documents focusing on “work” or “working life” are always subjectivist or multi-faceted, while those focusing on “job” or “employment” are always objectivist or multi-faceted. Among the three documents utilising the terms interchange-ably, two are subjectivists and one multi-faceted.
Regardless the type of input data used, and thus of approach, the output of all composite indicators is expressed in a quantitative way, as a single numerical value. The compos-ite indicator is calculated through aggregation of the scores of the single QWL dimen-sions. The majority of papers employ a weighted arithmetical mean (e.g. Arranz et al., 2018; Boccuzzo & Gianecchini, 2015; Holman, 2013) or sum (e.g. Argentero et al., 2007; Warren & Lyonette, 2018), often followed by normalisation (e.g. McClelland & Holman, 2015). Only Muñoz de Bustillo et al. (2011a) adopt a geometrical mean. In a few cases all dimensions have the same weight (e.g. Crespo et al., 2017; Ventegodt et al., 2009). In other cases, a more complex aggregation approach is adopted. For example, Addabbo et al. (2007) use fuzzy sets and fuzzy rules. The majority of QWL composite indicators range between 0 and 100 (7 out of 19) or are expressed as percentages (6 out of 19). The remain-ing authors adopt other scales, which in one case (Santero-Sanchez et al., 2015) spans also negative values. Only in 3 cases some qualitative outputs are proposed in addition to a numerical index. For example, Jones et al. (2014) classify jobs into good, medium, or poor, while Heiskanen and Jokinen (2014) rank QWL level as low, medium, and high. For appre-ciating the wide spectrum of composite indicators, a brief description of each approach is available in Table 4 located in Appendix.
The majority of the proposed composite indicators (12 out of 19) have only been tested on one or more samples. Only five have been fully validated, while in one case (Arrranz et al., 2018) the index has been tested for robustness. One indicator is only defined, but not tested (Sojka, 2014).
5 Discussion
This systematic review retrieved 19 documents proposing a composite indicator to measure QWL in European organisations. These indicators are considerably heterogene-ous in terms of all the comparison factors we have taken into consideration in our analy-sis. This result confirms that the previous widespread statement regarding the absence of an agreed QWL composite indicator (e.g. Bäck-Wiklund et al., 2011; Green, 2006; Hurley et al., 2012; Mitlacher, 2008; Muñoz de Bustillo et al., 2011b; Santero-Sanchez et al., 2015) remains valid also by narrowing the scope of the analysis to Europe. This suggests that the objective to foster a European common understanding of QWL con-cept is far from being achieved. This calls for further investments on the political level by European institutions.
Our results show that in Europe there is no a unique locution for indicating QWL, and this contributes to increase the confusion about the concept and its measurement. However, it can be observed that terms such as quality of “work” or “working life” are used by those indicators interested at least in the subjective perceptions of the work-ers. On the contrary, “job” or “employment” are preferred by the indicators that aim to assess at least the objective features of the job. Therefore, authors proposing new QWL composite indicators are recommended to use locutions consistently with this dis-tinction. Similarly, the name of the composite index could provide a hint on the type of approach to organisations selecting the composite indicator most suitable for their needs.
This review highlights that there is no consensus on the dimensions to include in QWL and on their names. An attempt to define a comprehensive set of QWL macro-dimensions has been made in this paper, adapting the work by Addabbo et al. (2007) and McClelland and Holman (2015). The proposed set of dimensions has proven able to accommodate the variety of aspects considered by the different authors, and aims to provide a unifying view of such debated issue. The results show that only 6 composite indicators consider all QWL dimensions. The most neglected is the “social” one. This could partially be explained by the fact that it can be assessed only through subjective inputs, which might be more dif-ficult to collect. Ideally, future proposal of QWL composite indicators should provide a wider coverage of all QWL dimensions, trying at the same time not to increase the com-plexity and effort required for their implementation.
The majority of QWL composite indicators found in the literature have been developed and tested only in one European country, usually focusing on a specific population. This means that they tend to be tailored to that specific context, hindering their applicability at the European level, in other industries, or for further worker populations. In addition, they almost neglect Eastern European countries, which would particularly benefit from more attention to QWL, as suggested by their poor performance emerging from recent studies (Simões et al., 2015). This calls for additional comparative studies investigating the differ-ences among European countries and industries, not only in terms of QWL level, but also in terms of understanding of the QWL concept.
In terms of the level of analysis, the large majority of composite indicators are assessed at the individual worker or job level, and can usually be aggregated to compare types of work, group of workers, or labour markets. The indicators focusing on the company level are only two, and specific for call centres. The higher the level of investigation, the less the data and the effort required to carry out the analysis. Indeed, it is enough to interview the managers of the call centre, not all the call centre workers, to get a measure of QWL
performance of the entire centre. The other side of the coin is that such indicators are not able to assess all QWL dimensions, and could adopt only an objectivist approach. For instance, they completely neglect the “ergonomic” and “social” dimensions that are better investigated through individual workers’ perceptions. Therefore, it appears that the indi-vidual worker or job level is the only one enabling the assessment of all QWL dimensions.
One of the main criticalities of QWL composite indicators is the resources required for data collection. For this reason, the majority of studies rely on secondary data. That becomes a necessity if the sample under investigation includes more than one country. Our review has underlined several sources of data available at national, European, and interna-tional level (such as the EWCS) useful to assess QWL and its variation across time, which could be accessed also by other researchers interested in this topic. In addition, 3 out of 4 indicators using the EWCS provide the full list of items used, although different among the studies, thus facilitating the replicability of the studies or implementation of the proposed indicator. On the contrary, only half of the studies collecting primary data offer the full set of questions/items, thus hindering their implementation by other organisations or research-ers. It would be desirable that future proposals of QWL composite indicators provide all the data collection instrument details to enable their actual application.
To facilitate the use of a composite indicator, also the weighting and aggregating pro-cedure, which are often quite complex, should be well documented. However, the possi-bility to assign differentiated importance weights to QWL dimensions raises the question whether the dimensions have the same relevance in every context in order to assess QWL, or if the weights should be context-specific. The uniformity of weights facilitates cross comparisons, but it might be reasonable to suppose that some dimensions may contribute to QWL more than others in different jobs or industries. Therefore, it would be important for QWL composite indicators to highlight the diverse importance of each dimension in characterising a country, an industry, or a working population. Interesting approaches for assigning a relative weight to each dimension are provided by Holman (2013), Muñoz de Bustillo et al. (2011b), and Decancq and Lugo (2013).
The surveyed QWL composite indicators are always expressed in a quantitative way, and only a few authors also propose a scale to label the scores according to qualitative categories. Although the quantitative value is more precise, qualitative categories might be an additional piece of information to facilitate comprehension and interpretation of results also by individual workers or a less specialised audience.
Unfortunately, the majority of the proposed composite indicators have not been fully validated, thus undermining their reliability. Extensive testing and proper validation of the indicators would be highly recommended.
Finally, each indicator could be complemented with recommendations about actions that can be implemented for improving the QWL level, based on the outcome of the assess-ment and analysis of the weakest dimensions in the specific context under investigation.
6 Conclusions
This paper proposes a systematic review of the composite indicators available in the scien-tific literature to measure QWL in European countries. Our research focuses on composite indicators and Europe, not investigating a particular industry and/or working population. Through a rigorous and reproducible methodology, we identified 19 documents and ana-lysed them based on a set of significant factors related to QWL locutions, index name,
geographical area, industry or population, level of analysis, dimensions, type of data, inputs, outputs, and test and/or validation. The results confirm the absence of an agreed upon composite indicator of QWL at the European level, the lack of consensus on QWL dimensions, and the proposal of different kinds of approaches (e.g. objectivist, subjectivist, or multi-faceted).
A critical comparison of the different composite indicators, highlighting their main strengths and weaknesses, is given. We also propose a set of QWL macro-dimensions able to accommodate the variety of aspects considered by the different authors with the purpose to outline a unifying framework for such open dispute.
We believe that this paper has both theoretical and practical contribution. On the theo-retical side, it provides scholars and academics with an overview of the state of the art of scientific literature about composite indicators for evaluating QWL in Europe. It also points out several gaps that suggest possible directions for future research. On the practical side, the critical comparison of QWL composite indicators could support practitioners in the selection of the most suitable indicator for their specific organisation.
Appendix
See Table 4.Table 4 Com posite indicat ors descr ip tion and r elated dimensions Ref er ence Descr ip tion Dimensions (items) Addabbo e t al. ( 2007 ) Multidimensional fuzzy e xper t sy stem in whic h t he dimensions ar e the final in puts (b y means of inter mediate sy stems combining element ar y v ar iables b y giving differ ent w eights t o eac h v ar iable) and ha ve t he same w eight in de ter mining QWL. Differ ent le vels of v ar iables, descr ip tion of se ver al linguis tic attr ibutes f or t he in puts/indicat
ors and inter
mediate v ar iables, r ule bloc ks cont ain -ing t he contr ol s trategy of t he fuzzy sy stem pr ovided Contr ol dimension (R elation wit h colleagues, R elation wit h manag e-ment/entr epr eneur , A ut onom y in managing w or king r hyt hms, P os -sibility of dir ect ag reement wit
h colleagues); Economic dimension
(Ear nings, Senior ity , Job secur ity , Social insur ance, Pr ofit shar ing sc hemes, W ag e/F irm’ s pa y differ entials sc hemes, F ring e benefits, Lear ning and tr aining, Mater nity pr otection, P ar ent al lea ves, Car eer perspectiv es); Er gonomic dimension (W or k en vir onment
pace and intensity
, Cognitiv e effor t, S tress; Com ple xity dimension (A ckno wledgment of one ’s capabilities, Job v ar ie ty and r ichness, Effor t r eq uir ed, T
raining); Social dimension (Ot
hers ’ es teem, A ckno wledgment of pr of
essional abilities, Car
eer perspectiv es, Shar ing fir m’ s decision, W or k lif e satisf
action, Job satisf
action); W or k lif e balance (Mater nity pr otection, P ar ent al lea ves, Manag e-ment and a
vailability of paid holida
ys, P ar ticipation of em plo yees in manag ement of w or
king hours dis
tribution and shif
ts, A vailabil -ity of f amil y-fr iendl y policies) Ar genter o e t al. ( 2007 ) Inter vie w t o identify t he 5 mos t im por tant aspects, e valuate t hese aspects (i.e. t heir satisf action r
ates), and assign a w
eight t o eac h aspect in ter ms of r elativ e contr ibution t ow ar ds QWL. QWL ov er all scor e calculated b y multipl ying t he satisf action r ate of eac h aspect and t he w eight ascr ibed and b y summing t he scor es Relationship (R elationship wit h colleagues, Communication, W or k team, R elationship wit h manag ement); T reatment/T aking Car e of Patients (R elationship wit h patients, Emo tiv e r eactions t o patients); W or k or ganisation (Dis tance fr om home, Bur eaucr acy , Objectiv es, W or k shif t, Or ganisation, T ec hnical ability , W or k en vir onment); Pr of essional g ro wt h (Salar y, Car eer , Pr of essional lear ning); Pr of es -sional g rade (Independence, Pr of essionalism, R ole) Ar ranz e t al. ( 2018 ) Sub-dimensions/com
ponents of 3 dimensions defined t
o de ter mine the v alue of t he dimensions based on w eighted a ver ag es (com -ponents in t he same hier ar chical le vel ha ve eq ual w eights wit hin eac h dimension). Em plo
yment Quality Inde
x (EQI) calculated by multipl ying t he v alue of t he 3 dimensions b y t heir w eights (differ
ent among dimensions, but suc
h t hat t he w eight of eac h com ponent in t he EQI is t he same) W or king conditions (W or king par t-time b y r eason, Usuall y w or king mor e hours t han ag reed or cont ained in t he labour contr act or t he collectiv e ag reement, W ishing t o w or k mor e or f ew er hours t han cur rentl y, W or king in com panies wit h f ew er t han 50 em plo yees / 50 or mor e em plo
yees); Skills and tr
aining (Ha ving under tak en on-t he-job tr
aining activities funded b
y t he com pan y in t he f our week s pr ior t o t he inter vie w, Le vel of q ualification r eq uir ed b y t he
job, Skills mismatc
h); W or k-lif e balance (R egular w eekl y w or king hours in t he main job, W or k in “anti-social” hours, W or king in a shif t sy stem)
Table 4 (continued) Ref er ence Descr ip tion Dimensions (items)
Boccuzzo and Gianecc
hini (
2015
)
Job Quality Com
posite Indicat or (JQCI) measur ed as linear combination of economic, pr of essional, and w or k-lif e balance dimensions. Hybr id s tated-pr ef er ence appr oac h f or w eighting t he se ver al dimensions (i.e. t he w eights der iv ed fr om bo th dat a and the opinions of a r epr esent ativ e g
roup of individuals). Ano
ther
type of h
ybr
id appr
oac
h (i.e. hedonic one) t
o v alidate t he w eights Economic (Hour ly w ag e, Em plo yment r elationship, Contr act dur ation); Pr of essional (Hor izont al educational matc h, V er tical educational matc h, Skill matc h, Car eer adv ancement oppor tuni -ties, T eam wor k, R esponsibility le vel); W or k-lif e balance (W or king hours, Home-w or k dis tance) Clar k ( 2005 ) Tw o measur es of o ver all job q uality : o ver
all job satisf
action and job q uality inde x. The job q uality inde x is a measur e based on 8 job q uality v ar iables: t
he number of aspects out of t
he 8 t hat mak e up a good job ar e counted High income; W ant t
o spend less time on job; W
ant t
o spend mor
e
time on job; Good pr
omo
tion oppor
tunities; Job secur
e; Har
d
wor
k; Good job content
; Good r elations at w or k Cr espo e t al. ( 2017 ) Same eq uation r epor ted in Simões e t al. ( 2015 ), differ ing mainl y in the assignment of eq ual w eights f or all t he 11 consider ed dimen
-sions (i.e. eac
h w eight eq ual t o 1/11) Cor e objectiv e dimensions (P ay , Ph ysical w or
king conditions, Inten
-sity , A ut onom y, Job secur ity); Com plement ar y objectiv e dimen -sions (Healt h, Pr omo tion oppor tunities, Lear ning); Subjectiv e dimensions (W or k-lif e balance, Inter personal r elations, Intr insic re war ds) De W aal e t al. ( 2012 ) Measur e of q uality of w or k in ter ms of w or
kload and aut
onom
y.
Tes
t of t
he r
elationship among user satisf
action, q uality of w or k, and individual c har acter
istics. Dimensions and items c
har
acter
-ised b
y differ
ent loadings der
iv ed fr om t he q ues tionnair e Aut onom y; W or kload Gor jup e t al. ( 2009 ) St andar dised inde x t o de ter mine t he le vel and v ar iability of job quality . S tar ting b
y a number of dimensions and v
ar iables identi -fied in t he liter atur e as being e xtr insic indicat ors of good q uality jobs, obt
ained a bundle of 6 items b
y means of a cor relation anal ysis Salar y (Gr
oss annual salar
y, Benefits no t r elated t o per for mance); Char acter istics of t he contr act (P er cent ag e of tem por ar y em plo yees
who become per
manent, P er cent ag e of per manent em plo yees as a pr opor tion of tem por ar y em plo yees); W or k s tability (A ver ag e s tay of em plo yees in t he com pan y, P er cent ag e of em plo yees wit h mor e than fiv e y ears tenur e in t he or ganisation) Heisk
anen and Jokinen (
2014 ) Ov er all QWL measur e b
y summing 5 dimensions wit
h se ver al items in eac h. R anking of QWL le vel: lo
w, medium, and high.
St atis tical anal ysis t o e xamine s tability or c hang e of o ver all QWL, and r elationship wit h separ ate v ar iables Intr insic r ew ar ds of w or k; W or
k influence; Social openness at
wor kplace; Open w ay s t o sol ve w or k conflicts; Super visor y w or k; (Social capit al)
Table 4 (continued) Ref er ence Descr ip tion Dimensions (items) Holman ( 2013 ) Tw o indices of job q
uality based on 12 measur
es. A w eighted inde x by using w eights der iv ed fr om s tatis tical anal ysis wit h a cr iter ion var iable, i.e. a q uite r ate inde x. Calculation of t he inde x as a mean scor e of t he 12 w eighted measur es pr eviousl y s tandar dised. An un weighted inde x de ter mined t hr ough t he same pr ocedur e, but omitting w eights W or k or
ganisation (Job discr
etion, P er for mance monit or ing, Self-manag ed teams, Offline im pr ov ement teams, T ec hnology); W ag e and pa y sy stems (R elativ e pa y le vel, P er for mance-r elated pa y); Skills and de velopment (Initial tr aining, Ongoing tr aining); Fle
x-ibility and secur
ity (Fle xible w or k ar rang ements, P er manent con -tracts); Collectiv e r epr esent ation and v oice (Collectiv e bar gaining) Jones e t al. ( 2014 ) Re vision of t he DGB-Inde x (Deutsc her Ge wer ksc haf tsbund Good W or k Inde x) used f or measur ing job q uality (made up of resour ces, bur
dens, and income/secur
ity sub-indices) t o tr anslate it and intr oduce additional q ues tions f or be tter addr essing t he ph ysical hazar
d assessment. Classification in good, medium,
or poor jobs based on DGB-Inde
x, q uantified b y combining the r esponses t o a q ues tionnair e t hr ough a s tructur ed scor ing algor ithm Tr
aining and lear
ning (T raining oppor tunities, Skills de velopment oppor tunities); Cr eativity (Oppor tunities t o use o wn ideas); Pr omo -tion (Pr omo tion pr ospects); Contr ol o ver w or k (Oppor tunities t o plan w or k, Influence o ver amount of w or k, Influence o ver ho w wor k time is or ganised); Inf or mation, communication (A ccess t o necessar y inf or
mation, Conflicting or contr
adict or y demands); Manag er (W or k planned w ell b y super visor/line manag er , Appr e-ciation fr om super visor/line manag er , P ersonal de velopment v alued by manag
er); Senior manag
er , cultur e (Cooper ation encour ag ed, Com pe tent manag ement); R
elationships, colleagues (Suppor
t fr
om
colleagues); Meaningful Hours (W
or k useful f or socie ty , Contr ol ov er ho w muc h o ver time w or ked, W or king hours r eliable and pr edict able, P
ersonal needs consider
ed when w or king hours ar e planned); Pr essur e, intensity (U nw anted inter rup tions, W or k wit h high time pr essur e, N eed t o com pr omise w or k q uality); Emo tional demands (N eed t o hide f eelings, R espect fr om o thers); Ph ysical demands (Ph ysicall y har d w or k, W or king under s train/poor pos -tur
es, Loud noise e
xposur
e); Job secur
ity (W or ry about job/w or k futur e); Income (F air pa y, Enough pa y, Enough pension)
Table 4 (continued) Ref er ence Descr ip tion Dimensions (items)
McClelland and Holman (
2015
)
To
tal Job Quality Inde
x (T JQI), a nor malised w eighted scor e whose w eights of job q uality measur es ar e calculated t hr ough a cr iter ion-based appr oac h. The inde x is obt ained b y summing t he weighted agg reg
ate mean scor
es fr om 7 job q uality dimensions and nor malised on a r ang e fr om 0 t o 100 t o aid inter pr et ation W or k or
ganisation (Job discr
etion, V ar ie ty , Social suppor t, W or k in a team, T eam aut onom y, Ph
ysical demands, Ambient demands,
W
or
kload, Cognitiv
e and emo
tional demands, Inter
action demands, Inter dependency , Com ple xity); W ag es and pa yment sy stem (W ag e lev el, F ix ed salar y, P er for mance pa yments, Com pensation pa y, Gr oup pa y); Secur
ity and fle
xibility (Job secur
ity , P ar t-time/ full-time, P er manent contr act, F ix ed contr act, A gency contr act, Appr enticeship, N o contr act, F ix ed-time sc hedules, Shif t w or k, W or king time se t b y or ganisation, Choice of w or king time sc hed -ules, A dap t w or
king time, Night w
or k, Ev ening w or k, Sunda y wor k, Satur da y w or k, T en-hour da
y); Skills and de
velopment
(T
raining, De
velopment oppor
tunities, Skill utilisation); R
epr esen -tation and v oice (Eng ag
ement and consult
ation) Muñoz de Bus tillo e t al. ( 2011a )
Job Quality Inde
x, a w eighted g eome tric mean of t he 5 dimensions, in whic h t he v ar iables ar e s tandar dised t hr ough a me thod t hat respects t heir or iginal v ar
iability and eac
h dimension r eceiv es t he same w eight eq ual t o 20%. A gg reg ation of inf or mation wit hin eac h dimension mos tly done b y ar ithme ticall y a ver aging t he scor es of individual v ar iables f ollo wing t he hier ar chical s tructur e Pa y; Intr insic q uality of w or k (Skills, A ut onom y, P ow er fulness,
Meaningfulness, Social suppor
t, Self-fulfilment); Em plo yment quality (Contr actual s tability , De velopment oppor tunities); Healt h and saf ety (Ph ysical r isk s, Psy chosocial r isk s); W or k-lif e balance (W or
king time, Dur
ation, Sc heduling, Fle xibility , Intensity) Paug am and Zhou ( 2008 ) Summar y inde x of job q
uality based on a scale b
y giving a scor e ranging fr om 1 t o 4 t o eac h item and t aking t he a ver ag e of t he summed scor
es. Classification int
o 2 categor ies accor ding t o respondents ’ scor es on t he inde x: t he 50% of individuals wit h higher scor es on t he inde x ar e w or
kers who hold high q
uality jobs, and t he 50% wit h lo wer scor es ar e holders of lo w q uality jobs
Use of abilities; Discr
etion; P ay satisf action; Lear n; Inter es ting; Skill de velopment ; R espondent de velopment ; W or k pr essur e; P ar ticipa -tion; W or k-f amil y conflict
Table 4 (continued) Ref er ence Descr ip tion Dimensions (items) Santer o-Sanc hez e t al. ( 2015 ) Com posite Inde
x of Job Quality (CIJQ) based on a definition of t
he cr iter ia f or including individual v ar
iables, selection of indica
-tors, per for mance of nor malisation pr ocedur es, de velopment of w
eights, and application t
o eac h indicat or . By calculating the pr incipal com ponents, t heir eig en values, and t he v ar iance explained b y eac h, t he CIJQ is obt ained fr om t he v alues f ound f or the pr incipal com ponents. Pr incipal Com ponent Anal ysis (PC A) when no consensus e xis ts about t he r elativ e im por tance of t he or iginal v ar iables com pounded b y t he CIJQ Job secur
ity (Job dur
ation, T ype of contr act); Em plo yment income and o
ther emoluments (Salar
y or w
ag
es); W
or
king hours and w
or k-lif e balance (F ull/par t-time w or k); Skills and tr
aining (Jobs calling
for subs tantial e xper tise/job categor y) Simões e t al. ( 2015 ) Job q uality inde x wit h differ ent w eights t o t he 11 dimensions: giv en mor e im por tance t o pa y, job secur ity , and intr insic r ew ar ds (i.e. eq ual t o 2/14), wher eas t he o ther w eights ar e se t t o 1/14. The assignment of same w eights t o eac h dimension is per for med f or tes ting t he r obus tness of t heir r esults. Bo th t he s tudies b y Cr espo et al. ( 2017 ) and Simões e t al. ( 2015 ) es timate an econome tric model t o identify t he job q uality de ter minants Cor e objectiv e dimensions (P ay , Ph ysical w or king conditions, Intensity , A ut onom y, Job secur ity); Com plement ar y objectiv e dimensions (Healt h, Pr omo tion pr ospects, Lear ning); Subjectiv e dimensions (W or k-lif e balance, Inter personal r elations, Intr insic re war ds) Sojk a ( 2014 ) Tw o indicat
ors: final objectiv
e QWL le
vel and final per
ceiv ed QWL le vel. The f or mer is de ter mined accor ding t o t he es timation of t he im por tance of eac h job c har acter istic and of t he r eq uir ed, planned, s tandar dised, or con ventional le vel f or eac h c har ac -ter
istic. The latter measur
es t he QWL le vel per ceiv ed b y t he wor kplace holder , whic h is de f act o job satisf action Financial r ew ar d; W or kload (Ph
ysical load, Ment
al load, T ime load); Content of w or k (A ut onom y, V ar ie ty of t ask , F eedbac k, Meaning -ful w or k); Social r elations; W or k position and po tential f or car eer de velopment (W or k position, P otential of ne w higher positions, Possibility f or lear ning); W or king condition (Ph ysical conditions, Saf ety of w or k); Enter pr
ise localisation; Benefits; Cor
por
ate cul
-tur
e (T
angible and int
angible aspects of cor
por
ate cultur
e, Leaders
sty
le, Communication); Enter
pr ise imag e Ventegodt e t al. ( 2009 ) Tw o indicat ors based on t he “self e valuation of w or king lif e q ual -ity” q ues tionnair e (SEQWL): “ W or king-Lif e Quality , Es timated” and “ W or king-Lif e Quality , Self-Assessed”. The f or mer is
the calculated mean (eq
ual im por tance) of t he all consider ed domains, wher e eac h domain is scor ed as a ver ag e of its sub-domains/dimensions; t he latter is t he self-assessed w ell-being used as a contr ol Quality of Lif e (Lif e e xper ience, Satisf action, N eeds); Mas ter y (Skills, Char acter of w or k, Influence, Exper ience of w or king, Commitment t o w or k, Salar y and s tatus, De velopment); F ello wship (Commitment t o or ganisation, Inf or mation, T eam wor k, W or king en vir onment, Manag ement, R elations, Influence in t he or ganisa -tion); Cr eating r eal v
alue (Mission, Quality
, Efficiency , Et hics, Cr eating r eal v alue)
Table 4 (continued) Ref er ence Descr ip tion Dimensions (items) W ar ren and L yone tte ( 2018 ) Anal ysis of 12 measur es mer ged int o one summativ e v ar iable. Eac h measur e dic ho tomised int
o “bad” and “no
t bad” categor ies, wit h v alues se t at 1 and 0, r espectiv ely . The summativ e v ar iable counts ho w man y bad measur es eac h person
’s job had, and w
or k-ers wit h 5 or mor e bad measur es t o t
heir job is defined as ha
ving “v er y bad” job q uality Pa y (W ag es); Skill, tr aining, r
esponsibility (Educational mismatc
h, Lear ning, T raining, Discr etion); T ur no
ver (Job contr
act, Job loss);
Pr omo tion ladders (Pr omo tion); W or k-time (A ut onom y, Speed, Deadlines, Ov er time)