UNIVERSITÀ DEGLI STUDI DI SALERNO
Dipartimento di Farmacia
Dottorato di Ricerca
in
Scienze del Farmaco
Ciclo XXIX — Anno accademico 2016/2017
Tesi di Dottorato in
NMR-based metabolomic analysis of
biological fluids to monitor relevant
unsolved diseases
Dottorando Tutore
Dott. Angelica Palisi Chiar. ma Prof. Anna Maria D’Ursi
Table of contents
Chapter I Introduction to Metabolomics... - 5 -
Metabolic profiling by NMR ... - 6 -
NMR experiments for different sample types ... - 7 -
Data preprocessing... - 8 -
NMR spectral signal assignment... - 8 -
Data processing and statistical analysis... - 9 -
Univariate analysis... - 9 -
Multivariate analysis... - 10 -
Unsupervised analysis ... - 10 -
Supervised analysis ... - 10 -
Model validation... - 11 -
Pathway analysis in disease biomarker discovery... - 12 -
PhD program... - 12 -
Biofluids and investigated diseases ... - 13 -
Saliva... - 13 -
Serum... - 13 -
References ... - 14 -
Chapter II Metabolomic signature of salivary gland tumors ... - 17 -
Abstract... - 17 -
Introduction ... - 17 -
Methods ... - 19 -
Participants... - 19 -
NMR spectroscopy and processing... - 20 -
Data Analysis... - 21 -
Multivariate Data Analysis... - 21 -
Results ... - 23 -
Metabolomic ‘snapshot’ ... - 23 -
Gender Differences in total metabolomic profile ... - 28 -
Discussion ... - 31 -
Conclusions ... - 33 -
Compliance with ethical standards... - 34 -
References ... - 34 -
Chapter III Metabolomic signature of antiphospholipid syndrome... - 37 -
Abstract... - 37 -
Introduction ... - 37 -
Methods ... - 39 -
Participants... - 39 -
Sample collection and preparation ... - 39 -
NMR spectroscopy and processing... - 40 -
Data Analysis... - 41 -
Multivariate Data Analysis... - 41 -
Results... - 42 -
Metabolomic ‘snapshot’ ... - 43 -
Gender Differences in total metabolomic profile ... - 47 -
Discussion ... - 50 -
Compliance with ethical standards... - 53 -
References ... - 53 -
Chapter IV Metabolomic profile in hypercholesterolemic sera ... - 57 -
Introduction ... - 57 -
Methods ... - 58 -
Participants... - 58 -
Sample collection and preparation ... - 59 -
NMR spectroscopy and processing... - 60 -
Results... - 60 -
Data Analysis... - 60 -
Multivariate Data Analysis... - 61 -
Metabolomic ‘snapshot’ ... - 63 -
Discussion ... - 66 -
Conclusions ... - 67 -
Compliance with ethical standards... - 68 -
References ... - 69 -
Pubblications... - 71 -
Chapter I Introduction to Metabolomics
Metabolomics and metabonomics encompass the comprehensive profiling of multiple metabolite concentrations and their cellular and systemic fluctuations in response to drugs, diet, lifestyle, environment, stimuli and genetic modulations, in order to characterize the beneficial and adverse effects of such interactions. Metabolomics detect and quantify metabolites (small molecules <2000 Da) in a biological sample. The metabolome is the ensemble of all metabolites contained in one cell, tissue, organ or organism. [1] [2] It reflects the current biological state (e.g. health or disease) of an organism, because it is the endpoint of all interactions and reactions among the genome, transcriptome, proteome, microbiome; including also the effects of environment, lifestyle, diet, physical exercise and pollutants. Metabolomics investigates the final products (metabolites) of the biological reactions that take part both at the systemic level, biofluids and in specific organs or cell types. In the context of biomedical applications, metabolomics will have a preferential role with respect to the other "Omics" sciences for its ability to detect in real time the response of the organisms to pathological stressors. [3]
Fig. 1 The "Omics" cascade studies [4]
Metabolic profiling by NMR
NMR is widely used in metabolic profiling to identify and quantify metabolites, because it is a non-destructive measurement of a variety of structurally different metabolites. The quantification is based on the peak area of the specific metabolite, related to the peak area of a known concentration of the internal standard. Moreover, NMR exhibits high reproducibility of measurement, and requires minimum sample preparation as compared with other techniques. The drawback of NMR lies in the low sensitivity of detection. The sensitivity is related to the gyromagnetic ratio (γ) of the nuclear spins, experiment acquisition time and the metabolite concentrations that correspond to the number of nuclear spins being observed. Metabolite concentrations ranging from µM to mM can be readily detected by 1D NMR in ~10 min. Increased signal/noise
and spectral resolution can be achieved by the application of a higher magnetic field instrument and crioprobe to reduce thermal noise. [5]
NMR experiments for different sample types
Biofluids such as serum, plasma, urine, amniotic fluid, cerebrospinal fluid, saliva and other digestive fluids may be analysed generally using high resolution NMR spectroscopy with a 1D 1H NMR experiment. Due to the large water signal spectrum, the solvent suppression is required during the measurement. The water suppression can be achieved using presaturation, with the application of a weak radio frequency (RF). Solvent suppression is required during the measurement due to the large water signal dominating the spectrum. Water presaturation by applying a weak radiofrequency (RF) during the relaxation/mixing time and WATERGATE (WATER suppression by Gradient-Tailored Excitation) are the two most frequently used approaches for water suppression. [6] [7] For samples containing proteins and lipids, phosphate buffer in D2O can be added to the sample and measured by a single pulse NMR experiment with water suppression. For biofluids containing macromolecules (serum), T2 relaxation editing by Carr-Purcell-Meiboom-Gill (CPMG) pulse sequence in NMR experiment is utilized to attenuate broad resonances from proteins and lipids which have short T2 relaxation time; deproteinization by organic solvents or ultrafiltration can be used. Non-destructive detection of intact tissues and cells can be achieved using solid state magic-angle spinning (MAS). [8] NMR with CPMG and water suppression pulse sequence to minimize the spectral line broadening. Standard processes for sample preparation are freezing the tissues in liquid nitrogen to quench
the enzymatic reactions, followed by grinding the tissue in a cooled mortar or with an electric homogenizer, then is packed with the addition of D2O, at an angle of 54.7°. [9, 10]
Data preprocessing
The acquired free induction decay (FID) data can be processed using ACD/NMR Processor (ACD/Labs, Toronto, Canada) in which 2x zero-filling and an exponential window function equivalent to 0.3 Hz line broadening is usually applied before Fourier transformation. The spectra will be phased, baseline corrected, referenced to standard compound signal of a specific chemical shift, and exported as an ASCII file. The ASCII file is imported into Excel and the spectral region from -0.02 ppm to 10 ppm is chosen for subsequent statistical analysis. NMRlab, ProMetab, matNMR and MetaboLab can also be applied to process the raw FID data to visualize the spectra. [9, 10]
NMR spectral signal assignment
1D1H-NMR spectra are routinely acquired due to the high NMR sensitivity of the hydrogen nucleus. 1D spectra of samples containing complex mixture of metabolites can be congested due to the resonance appeared at the same chemical shift, making the resonance assignment a challenge. 2D homonuclear / heteronuclear correlation and J-resolved (JRES) experiments can be applied to alleviate the congestion of 1D spectrum. Spectral resonance assignment is usually performed by searching chemical shift lists, for example, in HMDB, BMRB, Chenomx software (Chenomx Inc., Edmonton, Canada), and
published literatures along with the analysis of specific J coupling patters of the metabolite spin systems. This process is more efficient now with the help of MetaboID [11], a graphical user interface that offers comparison of experimental spectra with authentic metabolite spectra to guide assignment. Resonance assignment is achieved by combining the assignment of 1D1H spectra along with the knowledge obtained from the 2D experiments of selected samples. [9, 10]
Data processing and statistical analysis
Normalization is routinely used to account for the dilution effect of each sample as well as variation from different batch of measurement [12]. Scaling is a variable-based processing approach which is performed on the intensity of each metabolite across all samples, and influences the result of the multivariate analysis. [13] For instance, principal component analysis (PCA) which is performed on mean-centered data (e.g. metabolite variable mean is subtracted across all samples) is equivalent to performing PCA on a covariance matrix. Applying PCA on standardized variable requires the data to be scaled with unit variance scaling. [14]
Univariate analysis
To compare each variable in the data containing two groups (for example benign and cancer), Student's t-test based on the comparison of the two samples is commonly used means. It, however, requires that each sample population to have a normal distribution, equal variance of the two data populations that are independent leagues. Two sample
populations with unequal variances "The Welch" t test can be applied. Analysis of variance one-way (ANOVA) can be applied to test the difference between groups, for data that contains more than two groups. [14]
Multivariate analysis
Multivariate analysis can be utilized to account for the impact of all metabolites on the outcome of measurement (e.g. cancer and normal). Multivariate model can be used to determine the metabolites contributing to the result as well as predicting the result. [14] [15] [16]
Unsupervised analysis
Unsupervised analysis is the application of statistical models without the prior knowledge of the sample classification labels and it is usually the first step in data pattern exploration. PCA is representative of the unsupervised method to examine the structure of the data set. Scores plot is generated to assess the clustering of different samples, with the corresponding loadings plot demonstrating the variables accounting for the most. In addition, the cluster analysis, which is useful for the visualization of subgroups of multivariate is also used in metabolomics data analysis. [15] [16]
Supervised analysis
In supervised analysis, information of sample class labels (e.g. disease and control) are also utilized in building the statistic models.
One commonly used analysis is PLS-DA which maximizes the covariance between predictor variables and the response variables (classes of each sample) [17]. It uses variable importance to projection (VIP) scores to demonstrate the contribution of each variable to the model, with metabolites VIP scores> 1 considered important in classification. If class separation is not observed in scores plot of PLS-DA model, orthogonal partial least squares discriminant analysis (OPLS-DA) can be performed [18]. It presents similar prediction ability to PLS-DA. Diagnostic parameters such as the number of misclassifications, cross-validated explained variation Q2 and the Area Under the Curve (AUC) of a Receiver Operating Characteristic (ROC) analysis are commonly used to indicate the model performance. [19]
Model validation
To assess the predictive ability of the multivariate models, cross validation (CV), permutation or bootstrap can be conducted. Cross validation involves separating the data into a training set (e.g. PLS-DA), and the resulting model is used to predict the classes of the test set. A permutation test can assess whether the classification based on true sample class is significantly better than classification based on randomly assigned sample class. In bootstrap method It's generates a new data set the same size as the original by sampling with replacement from the original data set, used to build the prediction model, and the validation is applied on the original data set. [20]
Pathway analysis in disease biomarker discovery
Metabolic pathway analysis is essential for the understanding of cellular processes of specific diseases. After the identification of potential metabolite biomarkers, the particular pathway can be assessed using databases such as KEGG [21] and HMDB [22], or searching in literatures pathway that contain metabolite and disease. The enzymes controlling the metabolite levels in the cell: impact on the biomarker level and promote understanding of mechanisms associated with the specific disease.
PhD program
The research activity of this PhD program included the application of the NMR technique for the metabolomics analysis, of bio-fluids deriving from populations of patients respectively affected by salivary gland tumor, antiphospholipid autoimmune syndrome and altered lipid profile. This NMR metabolomic screening was aimed i) at the definition of a metabolomic profile that may be patognomonic of the disease under scrutiny and ii) at the identification of biomarkers to be used with diagnostic and prognostic scope.
Biofluids and investigated diseases Saliva
Saliva is an important physiological fluid that contains a highly complex mixture of substances, it is easily accessible and contains analytes that, like those present in serum or urine, are sensitive to the overall health status. The Human Saliva Metabolome Database www.salivametabolome.ca) report 1235 possible metabolites in saliva (735 detected and quantified by various techniques). Of these, due to the NMR sensitivity, almost 20 can be detected by NMR spectroscopy. For these reasons, in the future saliva could play a role in the definition of diseases. [23] More interestingly, a recent paper demonstrated that a clear individual metabolic phenotype exists in saliva, although it is slightly less individual-specific than the urinary phenotype, probably because stronger underlying homeostatic processes occur in saliva. [24] During my PhD program I performed a NMR-based metabolomic study of saliva of patients suffering of salivary gland tumors.
Serum
Among the most common biological specimens analysed in metabolomics there is blood serum (or plasma). It is collected with low invasiveness, and is rich in biological information. Blood is the main carrier of small molecules in the body, and it contains all the molecules that are secreted by different tissues in response to different physiological needs or stresses [25]. The Human Serum Metabolome Database, (www.serummetabolome.ca), contains information on about 4500 metabolites, of them 1986 detected and quantified by various techniques. It is very important that metabolomic samples are collected
following rigorous standard operating procedures (SOPs), for the experimental reproducibility and data exchange. [26] [27] During my PhD program I performed a NMR-based metabolomic study of blood sera of patients suffering of antiphospholipid syndrome; hypercholesterolemy; amyotrophic lateral sclerosis.
References
[1] O. Fiehn, Metabolomics - the link between genotypes and phenotypes, Plant Molecular Biology, 48 (2002) 155-171.
[2] J.K. Nicholson, J.C. Lindon, E. Holmes, 'Metabonomics': understanding the metabolic responses of living systems to pathophysiological stimuli via multivariate statistical analysis of biological NMR spectroscopic data, Xenobiotica, 29 (1999) 1181-1189.
[3] C. Ratnasekhar, M. Sonane, A. Satish, M.K.R. Mudiam, Metabolomics reveals the perturbations in the metabolome of Caenorhabditis elegans exposed to titanium dioxide nanoparticles, Nanotoxicology, 9 (2015) 994-1004.
[4] K. Dettmer, P.A. Aronov, B.D. Hammock, Mass spectrometry-based metabolomics, Mass Spectrometry Reviews, 26 (2007) 51-78.
[5] H. Kovacs, D. Moskau, M. Spraul, Cryogenically cooled probes - a leap in NMR technology, Progress in Nuclear Magnetic Resonance Spectroscopy, 46 (2005) 131-155.
[6] M. Piotto, V. Saudek, V. Sklenar, GRADIENT-TAILORED EXCITATION FOR SINGLE-QUANTUM NMR-SPECTROSCOPY OF AQUEOUS-SOLUTIONS, Journal of Biomolecular Nmr, 2 (1992) 661-665.
[7] B.D. Nguyen, X. Meng, K.J. Donovan, A.J. Shaka, SOGGY: Solvent-optimized double gradient spectroscopy for water suppression. A comparison with some existing techniques, Journal of Magnetic Resonance, 184 (2007) 263-274.
[8] E.C.Y. Chan, P.K. Koh, M. Mal, P.Y. Cheah, K.W. Eu, A. Backshall, R. Cavill, J.K. Nicholson, H.C. Keun, Metabolic Profiling of Human Colorectal Cancer Using
High-Resolution Magic Angle Spinning Nuclear Magnetic Resonance (HR-MAS NMR) Spectroscopy and Gas Chromatography Mass Spectrometry (GC/MS), Journal of Proteome Research, 8 (2009) 352-361.
[9] B. Gong, M.D. Morris, Raman spectroscopy monitors adverse bone sequelae of cancer radiotherapy, Chinese Chemical Letters, 26 (2015) 401-406.
[10] N.S. Jain, U.H.N. Durr, A. Ramamoorthy, Bioanalytical methods for metabolomic profiling: Detection of head and neck cancer, including oral cancer, Chinese Chemical Letters, 26 (2015) 407-415.
[11] N. MacKinnon, B.S. Somashekar, P. Tripathi, W.C. Ge, T.M. Rajendiran, A.M. Chinnaiyan, A. Ramamoorthy, MetaboID: A graphical user interface package for assignment of H-1 NMR spectra of bodyfluids and tissues, Journal of Magnetic Resonance, 226 (2013) 93-99.
[12] R.J.O. Torgrip, K.M. Aberg, E. Alm, I. Schuppe-Koistinen, J. Lindberg, A note on normalization of biofluid 1D H-1-NMR data, Metabolomics, 4 (2008) 114-121.
[13] A. Craig, O. Cloareo, E. Holmes, J.K. Nicholson, J.C. Lindon, Scaling and normalization effects in NMR spectroscopic metabonomic data sets, Analytical Chemistry, 78 (2006) 2262-2267.
[14] R.A. van den Berg, H.C.J. Hoefsloot, J.A. Westerhuis, A.K. Smilde, M.J. van der Werf, Centering, scaling, and transformations: improving the biological information content of metabolomics data, Bmc Genomics, 7 (2006).
[15] L.-q. Sun, X.-y. Mu, Z.-h. Sun, X.-w. Tong, Semiparametric analysis of longitudinal data with informative observation times, Acta Mathematic. Applic. Sinica, English Series, 27 (2011) 29-42.
[16] F. Westad, F. Marini, Validation of chemometric models - a tutorial, Anal. Chim. Acta, 893 (2015) 14-24.
[17] M. Barker, W. Rayens, Partial least squares for discrimination, Journal of Chemometrics, 17 (2003) 166-173.
[18] H. Stenlund, E. Johansson, J. Gottfries, J. Trygg, Unlocking Interpretation in Near Infrared Multivariate Calibrations by Orthogonal Partial Least Squares, Analytical Chemistry, 81 (2009) 203-209.
[19] O. Cloarec, M.E. Dumas, J. Trygg, A. Craig, R.H. Barton, J.C. Lindon, J.K. Nicholson, E. Holmes, Evaluation of the orthogonal projection on latent structure model limitations caused by chemical shift variability and improved visualization of biomarker changes in H-1 NMR spectroscopic metabonomic studies, Analytical Chemistry, 77 (2005) 517-526.
[20] P. Golland, F. Liang, S. Mukherjee, D. Panchenko, Permutation tests for classification, Learning Theory, Proceedings, 3559 (2005) 501-515.
[21] M. Kanehisa, S. Goto, M. Hattori, K.F. Aoki-Kinoshita, M. Itoh, S. Kawashima, T. Katayama, M. Araki, M. Hirakawa, From genomics to chemical genomics: new developments in KEGG, Nucleic Acids Research, 34 (2006) D354-D357.
[22] D.S. Wishart, T. Jewison, A.C. Guo, M. Wilson, C. Knox, Y.F. Liu, Y. Djoumbou, R. Mandal, F. Aziat, E. Dong, S. Bouatra, I. Sinelnikov, D. Arndt, J.G. Xia, P. Liu, F. Yallou, T. Bjorndahl, R. Perez-Pineiro, R. Eisner, F. Allen, V. Neveu, R. Greiner, A. Scalbert, HMDB 3.0-The Human Metabolome Database in 2013, Nucleic Acids Research, 41 (2013) D801-D807.
[23] M. Aimetti, S. Cacciatore, A. Graziano, L. Tenori, Metabonomic analysis of saliva reveals generalized chronic periodontitis signature, Metabolomics, 8 (2012) 465-474. [24] S. Wallner-Liebniann, L. Tenori, A. Mazzoleni, M. Dieber-Rotheneder, M. Konrad, P. Hofmann, C. Luchinat, P. Turano, K. Zatloukal, Individual Human Metabolic Phenotype Analyzed by H-1 NMR of Saliva Samples, Journal of Proteome Research, 15 (2016) 1787-1793.
[25] N. Psychogios, D.D. Hau, J. Peng, A.C. Guo, R. Mandal, S. Bouatra, I. Sinelnikov, R. Krishnamurthy, R. Eisner, B. Gautam, N. Young, J. Xia, C. Knox, E. Dong, P. Huang, Z. Hollander, T.L. Pedersen, S.R. Smith, F. Bamforth, R. Greiner, B. McManus, J.W. Newman, T. Goodfriend, D.S. Wishart, The Human Serum Metabolome, Plos One, 6 (2011).
[26] P. Bernini, I. Bertini, C. Luchinat, P. Nincheri, S. Staderini, P. Turano, Standard operating procedures for pre-analytical handling of blood and urine for metabolomic studies and biobanks, Journal of Biomolecular Nmr, 49 (2011) 231-243.
[27] A.-H.M. Emwas, R.M. Salek, J.L. Griffin, J. Merzaban, NMR-based metabolomics in human disease diagnosis: applications, limitations, and recommendations, Metabolomics, 9 (2013) 1048-1072.
Chapter II Metabolomic signature of salivary gland tumors
Abstract
In the present work, we present a NMR-based metabolomic study of saliva of patients suffering of salivary gland tumors. Our data show that individuals suffering parotid tumor have a characteristic metabolomic profile with abnormalities associated to the metabolism of acetate, alanine, lactate, methanol, phenylalanine, propionate, succinate. We have identified for the first time the metabolomic fingerprint characterizing parotid tumor patients disease having potential application to improve timely diagnosis and appropriate therapeutic approaches.
Introduction
Human saliva is secreted from three pairs of major salivary glands, namely, parotid gland, submandibular gland, and sublingual gland lying at the vicinity of oral cavity, and numerous minor salivary glands lying beneath the oral mucosa. [1] Cancers affecting the salivary glands have been an increasing incidence. Etiologic factors are not clear, they can occur at any age, but are more common in people over 50, including impact of gender differences. [2] Nutrition may be a risk factor, as well as irradiation or a long-standing histologically benign tumor that occurs at youth. Adenoid cystic, mucoepidermoid low-grade, acinic cell carcinomas are malignant tumors showing widely different patterns of growth, with a prognosis correlating mainly with histological subtype. [3] Pleomorphic adenoma and Warthin’s tumor, are the most recurrent benign parotid tumors, that may be subjected to malignant
transformation. [3] Warthin's tumors are commonly asymptomatic, affect predominantly men in the 5th and 6th are typical of smokers, in contrast to other salivary gland tumors. [4] Physical examination is the most important tool for diagnosis, and histology allows for the differentiation between malignant tumor and other benign conditions. At present, salivary gland cancer is not detected until it reaches an advanced stage, which would generally result in a poor prognosis and survival rate. Therefore, early detection as well as the screening of high risk populations with precancerous lesions remains to be an unmet need. [3] [5] Metabolomics is the large-scale study of metabolites, within cells, biofluids, tissues or organisms. These directly reflect the biochemical activity and state of cells. In NMR based metabolomic analysis a variety of compounds (charged, neutral, hydrophobic, hydrophilic), are simultaneously qualitatively and quantitatively detected in biologic samples, [6] providing a significant contribution to the understanding of the biochemical pathways involved in many unsolved diseases.[7] Saliva is an attractive diagnostic fluid because it has several key advantages for disease diagnosis and prognosis. For example, low invasiveness, minimum cost, and easy sample collection and processing. Saliva contains a large array of metabolites, many of which can be informative for the detection of diseases. [8] Metabolomic examination of saliva from patients suffering of salivary gland tumor is expected to be high informative of the tumor etiopatogenesis given that saliva represents the bio-fluid surrounding the tumor. Therefore, in these cases, the conventional oral examination, coupled with the integration of the salivary metabolite signatures, may become an applicable strategy for early detection of oral precancerous lesions and cancer. [9] In the present work, using 1H NMR spectroscopy, we analyze the saliva metabolomic profile of
subjects affected by parotid tumor. These data evidence the existence of several metabolites distinctive of pathological state. Salivary gland tumor, as many other cancers, is a complex disease, resulting from an interdependent series of biochemical alterations, rather than a single disruptive event. In this case our approach aimed at the identification of a panel of metabolite markers rather than a single biomarker, will improve the sensitivity and specificity for detection. Integrating the protocols of tumor grading and histological classification. This procedure will enhance the management of the disease in the respect of the precision medicine and a gender oriented medicinal approach.[10]
Methods Participants
One hundred (100) participants were selected from Department of Otolaryngology, DEA III Liv. Nocera-Pagani, Salerno from July 2014 to July 2016. 50 participants (male/female: 30/20) had been previously diagnosed for suspected parotid tumor according to the revised diagnostic protocols, [3] whereas the control group, (50 subjects, male/female: 30/20) comprised healthy volunteers without major illnesses. Inclusion criteria consisted of all salivary gland tumors (SGT) patients and healthy individual who had voluntarily agreed to participate in this study, while exclusion criteria included subjects presenting any medical conditions or with a recent history of drug addiction or alcohol abuse.
Sample collection and preparation
Saliva samples were collected from male and female according to the standard operating procedure (SOP) for metabolomic-grade saliva samples recently defined. [11] Saliva was collected and stored into Sartstedt Salivette® hygienic saliva collection devices at - 80 °C in Greiner cryogenic vials. Before being transferred to a 5 mm heavy-walled NMR-tube, samples were thawed at room temperature and thereafter spin at 3000 rpm using Vivaspin® 6 centrifugal concentrator, to remove proteic and particulate matter. The saliva supernatant was removed. To prepare NMR sample, 425 µL of each saliva sample were added to 25 µL of 1M potassium phosphate buffer (pH 7.4) and 10 µL D2O. Trimethylsilyl propionic-2,2,3,3-d4 acid, sodium salt (TSP 0.1% in
D2O) was used as an internal reference for alignment and quantification of the NMR signals. [11]
NMR spectroscopy and processing
NMR experiments were carried out on a Bruker DRX600 spectrometer, equipped with a 5 mm triple-resonance z-gradient CryoProbe. TOPSPIN, version 2.1 or 3.0, was used for spectrometer control and data processing (Bruker Biospin). 1D NOESY experiments were acquired using spectral with of 14 ppm, 16k data points, excitation sculpting for water suppression, 192 transients, 4s relaxation delay and 60ms mixing time. The pulse sequence used included an excitation sculpting routine for the suppression of the water signal. [12] Due to the effect of excitation sculpting on the signal height of resonances in the region close to the water resonance, [13, 14] the metabolites that have resonances close to this region (ascorbate, glucose, mannose and
pyroglutamate) were quantified using resonances from those metabolites in other spectral regions. A weighted Fourier transform was applied to the time domain data with a 0.5 Hz line-broadening followed by manual phase and baseline correction in preparation for targeted profiling analysis.
Data Analysis
NMR spectra were manually phased and baseline corrected. Quantification of salivary metabolites was achieved using Chenomx NMR-Suite v8.0 (Chenomx Inc.). Briefly, the Chenomx profiler is linked to a database containing more than 250 metabolite NMR spectral signatures encoded at different spectrometer 1H frequencies, including 600 MHz (http://www.hmdb.ca). Comparison of the spectral data obtained for each saliva sample with the Chenomx metabolite library results in a list of compounds together with their respective concentrations based on the known concentration of the added internal reference compound, TSP. Each spectrum was analyzed three times.
Multivariate Data Analysis
Multivariate data analysis based on projection methods was applied for statistical data analysis. Specifically, exploratory data analysis was performed by principal component analysis (PCA) while a projection to latent structures (PLS-DA)-based method was applied to discriminate the samples. While PCA is a well-known technique used in multivariate data analysis, the PLS-based approach is a robust regression
technique used to investigate the relationships existing between two blocks of data, usually called X- and Y-block and has predictive applications. In the present study, discriminant classification was carried out using partial least squares-discriminant analysis, a method based on the PLS regression algorithm. Projection methods in multivariate data analysis were performed by using SIMCA-P+ software (Version 12.0, Umetrics, Umea, Sweden). The entire data matrix, after log transform and Unit Variance scaling, was first analyzed by PCA to define homogeneous cluster of samples (Exploratory data analysis). Following PCA, classification of samples was accomplished through the use of discriminant chemometric classification technique. The aim of classification is to assign a sample to two (or more) categories based on the measured variables [15]. With these basis, discriminant classification techniques divide the hyper-space demarcated by the variables in a number of regions, as the number of classes to be considered, so that if an unknown sample falls in a particular region it is assigned univocally to the corresponding class. [16] In the present study, discriminant classification was carried out using partial least squares-discriminant analysis, a method based on the PLS regression algorithm. In order to use a regression algorithm for classification, the information about the presence of the pathological condition has to be coded in a binary vector, which takes the value 1 for one class (pathological) and -1 for the other (healthy). A PLS model is then built between the experimental matrix X and the coded y (the class), and classification is accomplished on the basis of the predicted response y, which can assume any real value (supervised method). Models were validated by cross-validation techniques and permutation tests according to standardized good practice to minimize false discoveries and to obtain robust statistical models. A small number of metabolites
changing during the experiment was extracted and the behavior of each single metabolite was studied by linear mixed-effects model for longitudinal studies. All the different pretreatments provided good discriminant ability in calibration and cross-validation (above 90%). [15] [16] We submitted our data to MetaboLights database with ID code: MTBLS421.
Results
Metabolomic ‘snapshot’
For each sample, 17 metabolites were identified and quantified.
To identify the metabolomic ‘snapshot’ in salivary gland tumors patients, 1H-NMR data were processed according to multivariate data analysis (MVA) by using both unsupervised and supervised projection methods.
The dataset was log-transformed, unit variance centered and scaled. Normalized data were analyzed by defining a matrix composed of 100 observations and 17 variables. The data collected were then investigated using PCA.
The first component explained the 44% of variance while the second the 10%. The choice of principal components was done considering the fitting (R2X) and predictive values (Q2X), for the PCA model, in our case the second component gave the closest values to 1 for both of them.
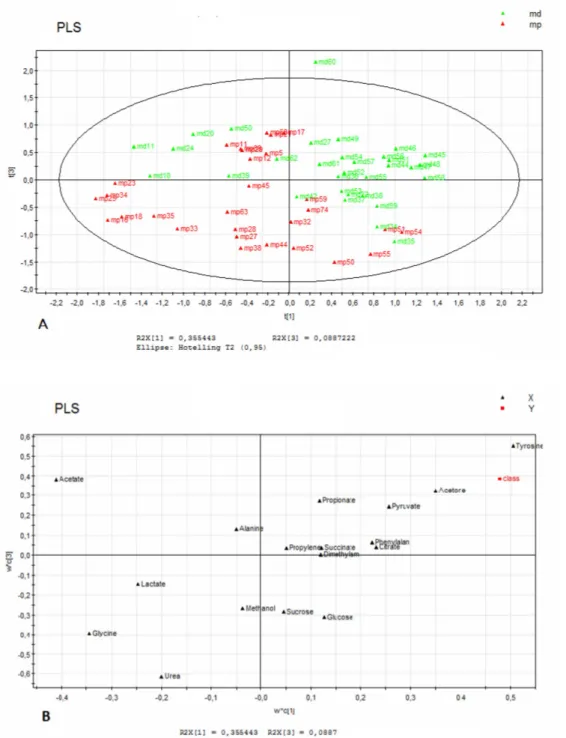
Figure 1 shows the PCA score scatter plot for the 1H-NMR spectra of the salivary gland tumors. Four observations fell outside the confidence ellipse. Visual inspection evidences separation into two groups almost corresponding to patients versus healthy donors. Some data were scattered widely on the left side of the graph with slight overlap between the two groups. The fitting (R2Y) and predictive (Q2Y) values for the PLS-DA model were respectively 59% and 23%. Visualization of metabolites using loading scatter plot PLS-DA was carried out to identify potential metabolites that are responsible for the discrimination showed in PLS-DA score scatter plot. Loading scatter plot showed potentially significant metabolites based on contributions and reliability to the separation observed in score scatter plot. Metabolites in the loading plot that were distant away from the origin and close to the vertical axis (separation based on the first principal component) could be considered responsible for the exhibited separation in PLS-DA score scatter plot (Figure 2A). Inspection of loading scatter plot (Figure 2B) points to acetate, alanine, lactate, methanol, phenylalanine, propionate, succinate as metabolites distinctive of gland tumor pathological saliva.
Fig. 1 PCA score scatter plot for the 1H NMR data collected in 1H NMR spectra of human SGT saliva using 17 measured metabolites from 50 SGT patients and 50 donors. Red and green triangles correspond to data SGT patients and healthy donors respectively.
Fig. 2 PLS-DA score scatter plot (A) and PLS loading scatter plot (B) for the 1H NMR data collected in 1D NOESY spectra of human SGT saliva using 17 measured metabolites from 50 SGT patients and 50 donors. In Fig. 2A Red and green triangles correspond to data SGT patients and healthy donors respectively.
scatter PLS score plot (Fig. 3) reported two groups having limited central region overlap; in particular, circled regions correspond to pleomorphic adenoma (ap) and warthin tumor (tw) histological subtypes.
Fig. 3 PLS-DA score scatter plot for the 1H NMR data collected in 1H NMR spectra of human SGT saliva using 17 measured metabolites from 50 SGT patients and 50 donors. Red triangles correspond to data of SGT patients and green triangles to data of healthy donors. Circled regions correspond to pleomorphic adenoma (ap) and Warthin tumor (tw) histological subtypes.
Gender Differences in total metabolomic profile
To establish metabolomic profile specificities correlated with gender in salivary gland tumor diseases, we performed statistical analysis on the subset of 1H-NMR data separately collected on female and male salivary gland tumors. Two separate data matrices were generated: the first included 17 metabolites for 30 males and the second 17 metabolites for 20 females. The data of each matrix were independently aligned, pre-treated and analyzed using PCA and PLS-DA. In the case of the males the first component explains 36% of variance while the second the 0,8%. In the case of the females the first component explains 61% of variance while the second the 14%. The choice of principal components was done on the basis of for the PCA model. To improve the separation observed with the PCA model, supervised PLS-DA was applied fitting (R2Y) value resulted 53% in and predictive (Q2Y) value resulted 28%, in the case of males, and fitting (R2Y) value resulted 63% in and predictive (Q2Y) value resulted 28%, in the case of females. Even in this case PLS-DA was performed using discriminant analysis as a classifier (Y block). The information about the presence of the pathological condition has to be coded in a binary vector, which takes the value 1 for one class (pathological) and -1 for the other (healthy). PLS-DA (Figure 4A, 4B) statistical analysis confirmed, even for this data set, the metabolites distinguishing pathological and donors saliva. In particular abnormal presence of alanine, glycine, lactate, methanol proved to be characteristic of salivary gland tumors male pathological state.
Fig. 4 PLS-DA score scatter plot (A) and loading scatter plot (B) for the 1H NMR data collected in 1D NOESY spectra of human male SGT saliva using 17 measured metabolites from 30 male SGT patients and 30 male donors. In Fig. 4A red triangles correspond to data of male SGT patients and green triangles to data of male healthy donors.
Fig. 5 PLS-DA score scatter plot (A) and loading scatter plot (B) for the 1H NMR data collected
in 1D NOESY spectra of human female SGT saliva using 17 measured metabolites from 20 female APS patients and 20 female donors. In Fig. 5A red triangles correspond to data of female SGT patients and green triangles to data of female healthy donors.
Abnormal presence of amino acid alanine, glucose, lactate, phenylalanine (f) , pyruvate, proved to be characteristic of salivary gland tumor in female saliva pathological state (Figure 5A, 5B).
Discussion
Cancers affecting the salivary glands have been an increasing incidence especially in male over fifty-age population. At moment, this cancer is diagnosed using physical and histological examination, being almost undetectable until it reaches an advanced stage, which may result in a poor prognosis and survival rate. Early diagnosis as well as the screening of high-risk populations with precancerous lesions is considered an unmet health need.
In the reported work, we performed a NMR based metabolomics analysis of saliva from subjects affected by parotid tumor. We analyzed saliva of 50 patients and 50 healthy donors respectively classified in 30 males and 20 females. PCA statistical analysis, of 1H NMR data collected in 1D NOESY spectra (Figure 1) evidenced that the metabolomic profiles of saliva including male and female samples do not permit a significant discrimination between SGT patients and healthy donors. In this case, we observe only weak evidences of metabolites potentially distinctive of saliva gland tumor; in particular acetate, alanine, lactate, methanol, phenylalanine, propionate, succinate. Among these, propionic acid, methanol, and acetate occur ubiquitously in the gastro-intestinal tract of humans and other mammals, as an end-product of the microbial digestion of carbohydrates. [17]
Gender differences are of interest from a variety of perspectives and have been the focus of a number of studies for many years. The impact of gender differences in the prevalence, manifestation and management of cancer diseases have been widely studied. [2] As previously reported, epidemiological data show that SGT tumor have prevalence in male, [18] considering such differences, it is in general possible to improve the understanding of the epidemiology and the clinical outcome of the diseases. On this basis, we repeated our statistical analysis, considering subsets of data classified according to gender. PCA statistical analysis for 30 human male SGT saliva and 30 male healthy donors evidences a more significant separation of metabolomics profiles (Figure 3). In particular PLS-DA loading scatter plot shows that alanine, glycine, lactate are metabolite distinctive of the pathological state in males. On the contrary considering the female subset of samples, the separation of pathological and healthy metabolomics profiles appears uncertain. In this case we observe weak evidence that alanine, glucose, lactate, phenylalanine, pyruvate, are distinctive of the pathological state.
An outlook to the metabolites distinguishing healthy donors from patients shows that lactate and alanine appear always distinctive of the pathological state in each set or subset of samples. Therefore, for these metabolites we studied the correlation with abnormalities in the biochemical pathways using human metabolome database. This analysis, shows that in distinct tumor types, metabolic profiles vary with respect to metabolites, such as alanine, glycine, lactate. [19] Concerning lactate, it is known from scientific literature that the so called Warburg effect, consisting in increased glucose uptake and accumulation of lactate, is a common feature of cancer cells. In this case, cancer cells produce pyruvate from a high rate of glycolysis, and
subsequently transform pyruvate in lactic acid by fermentation in the cytosol. The Warburg Effect is thought to be the result of mutations to oncogenes and tumour suppressor genes, [20] [21] [22] moreover accumulation of lactate contributes to the immune escape in solid tumors and is a pivotal and early event in the development of malignancies. [23] [24] [25] [26]
Alanine is a nonessential amino acid made in the body from the conversion of the carbohydrate pyruvate. It is an important regulator in glucose metabolism. Altered levels of alanine and phenylalanine were found in surrounding biofluids of several cancers such as breast, pancreatic and oral cancer .[27]
Conclusions
Our NMR-based metabolomic study revealed different metabolomic profiles in saliva of male patients affected by salivary gland tumors compared with the profiles of age, gender, and sampling-date matched control individuals. Our approach provide preliminary data for the identification of metabolites that can be used as metabolomics fingerprint of salivary gland tumor. Determination of metabolomics fingerprint, rather than single metabolic biomarker, may fully reflect the multifactorial nature of oncogenesis and the heterogeneity of oncogenic pathways, providing precious elements to integrate diagnostic laboratory and clinical tests. [18]
Compliance with ethical standards
Conflict of Interest: all authors of this manuscript declare that they have no conflict of interest. Ethical approval: All procedures performed in this study were in accordance with the ethical standards of the Department of Otolaryngology; DEA III Liv. Nocera-Pagani (Salerno- Italy) and with the 1964 Helsinki declaration and its later amendments. Informed consent: Informed consent was obtained from all individual participants included in the study.
References
[1] O.R. Beirne, ADVANCES IN DENTAL RESEARCH, Journal of the American Dental Association, 121 (1990) 672-&.
[2] M. Al-Ghazi, R. Dunia, E. Orlowski, R. Estep, H. Chung, V. Sehgal, E. Radany, J. Kuo, N. Ramsinghani, A conformal parotid-sparing technique for treatment planning of head and neck tumors, Medical Physics, 30 (2003) 1509-1509.
[3] M. Guzzo, L.D. Locati, F.J. Prott, G. Gatta, M. McGurk, L. Licitra, Major and minor salivary gland tumors, Critical Reviews in Oncology Hematology, 74 (2010) 134-147. [4] A. Agaimy, V. Wild, B. Maerkl, D.L. Wachter, A. Hartmann, A. Rosenwald, S. Ihrler, Intraparotid Classical and Nodular Lymphocyte-predominant Hodgkin Lymphoma Pattern Analysis With Emphasis on Associated Lymphadenoma-like Proliferations, American Journal of Surgical Pathology, 39 (2015) 1206-1212.
[5] A.D. Rapidis, N. Givalos, H. Gakiopoulou, G. Faratzis, S.D. Stavrianos, G.A. Viios, E.E. Douzinas, E. Patsouris, Adenoid cystic carcinoma of the head and neck. Clinicopathological analysis of 23 patients and review of the literature, Oral Oncology, 41 (2005) 328-335.
[6] O. Beckonert, H.C. Keun, T.M.D. Ebbels, J.G. Bundy, E. Holmes, J.C. Lindon, J.K. Nicholson, Metabolic profiling, metabolomic and metabonomic procedures for NMR
spectroscopy of urine, plasma, serum and tissue extracts, Nature Protocols, 2 (2007) 2692-2703.
[7] M.E. Dumas, E.C. Maibaum, C. Teague, H. Ueshima, B.F. Zhou, J.C. Lindon, J.K. Nicholson, J. Stamler, P. Elliott, Q. Chan, E. Holmes, Assessment of analytical reproducibility of H-1 NMR spectroscopy based metabonomics for large-scale epidemiological research: the INTERMAP study, Analytical Chemistry, 78 (2006) 2199-2208.
[8] A. Zhang, H. Sun, X. Wang, Saliva Metabolomics Opens Door to Biomarker Discovery, Disease Diagnosis, and Treatment, Applied Biochemistry and Biotechnology, 168 (2012) 1718-1727.
[9] J.E. Wei, G.X. Xie, Z.T. Zhou, P. Shi, Y.P. Qiu, X.J. Zheng, T.L. Chen, M.M. Su, A.H. Zhao, W. Jia, Salivary metabolite signatures of oral cancer and leukoplakia, International Journal of Cancer, 129 (2011) 2207-2217.
[10] C. Leuzzi, G.M. Sangiorgi, M.G. Modena, Gender-specific aspects in the clinical presentation of cardiovascular disease, Fundamental & Clinical Pharmacology, 24 (2010) 711-717.
[11] O. Beckonert, H.C. Keun, T.M. Ebbels, J. Bundy, E. Holmes, J.C. Lindon, J.K. Nicholson, Metabolic profiling, metabolomic and metabonomic procedures for NMR spectroscopy of urine, plasma, serum and tissue extracts, Nat. Protoc., 2 (2007) 2692-2703.
[12] H. Mo, D. Raftery, Pre-SAT180, a simple and effective method for residual water suppression, J. Magn. Reson., 190 (2008) 1-6.
[13] N. Aranibar, M. Borys, N.A. Mackin, V. Ly, N. Abu-Absi, S. Abu-Absi, M. Niemitz, B. Schilling, Z.J. Li, B. Brock, R.J. Russell, A. Tymiak, M.D. Reily, NMR-based metabolomics of mammalian cell and tissue cultures, J. Biomol. NMR, 49 (2011) 195-206.
[14] M. Jupin, P.J. Michiels, F.C. Girard, M. Spraul, S.S. Wijmenga, NMR metabolomics profiling of blood plasma mimics shows that medium- and long-chain fatty acids differently release metabolites from human serum albumin, J. Magn. Reson., 239 (2014) 34-43.
[15] L.-q. Sun, X.-y. Mu, Z.-h. Sun, X.-w. Tong, Semiparametric analysis of longitudinal data with informative observation times, Acta Mathematic. Applic. Sinica, English Series, 27 (2011) 29-42.
[16] F. Westad, F. Marini, Validation of chemometric models - a tutorial, Anal. Chim. Acta, 893 (2015) 14-24.
[17] P.T.C. Harrison, PROPIONIC-ACID AND THE PHENOMENON OF RODENT FORESTOMACH TUMORIGENESIS - A REVIEW, Food and Chemical Toxicology, 30 (1992) 333-340.
[18] S. Espinoza, A. Felter, D. Malinvaud, C. Badoual, G. Chatellier, N. Siauve, P. Halimi, Warthin's tumor of parotid gland: Surgery or follow-up? Diagnostic value of a decisional algorithm with functional MRI, Diagnostic and Interventional Imaging, 97 (2016) 37-43.
[19] J.L. Spratlin, N.J. Serkova, S.G. Eckhardt, Clinical Applications of Metabolomics in Oncology: A Review, Clinical Cancer Research, 15 (2009) 431-440.
[20] V. Gogvadze, B. Zhivotovsky, S. Orrenius, The Warburg effect and mitochondrial stability in cancer cells, Molecular Aspects of Medicine, 31 (2010) 60-74.
[21] I. Samudio, M. Fiegl, M. Andreeff, Mitochondrial Uncoupling and the Warburg Effect: Molecular Basis for the Reprogramming of Cancer Cell Metabolism, Cancer Research, 69 (2009) 2163-2166.
[22] M.G.V. Heiden, L.C. Cantley, C.B. Thompson, Understanding the Warburg Effect: The Metabolic Requirements of Cell Proliferation, Science, 324 (2009) 1029-1033.
[23] F. Hirschhaeuser, U.G.A. Sattler, W. Mueller-Klieser, Lactate: A Metabolic Key Player in Cancer, Cancer Research, 71 (2011) 6921-6925.
[24] D.G. Robertson, M.D. Reily, R.E. Sigler, D.F. Wells, D.A. Paterson, T.K. Braden, Metabonomics: Evaluation of nuclear magnetic resonance (NMR) and pattern recognition technology for rapid in vivo screening of liver and kidney toxicants, Toxicological Sciences, 57 (2000) 326-337.
[25] B.M. Beckwith-Hall, J.K. Nicholson, A.W. Nicholls, P.J.D. Foxall, J.C. Lindon, S.C. Connor, M. Abdi, J. Connelly, E. Holmes, Nuclear magnetic resonance spectroscopic and principal components analysis investigations into biochemical effects of three model hepatotoxins, Chemical Research in Toxicology, 11 (1998) 260-272.
[26] S. Ishikawa, M. Sugimoto, K. Kitabatake, A. Sugano, M. Nakamura, M. Kaneko, S. Ota, K. Hiwatari, A. Enomoto, T. Soga, M. Tomita, M. Iino, Identification of salivary metabolomic biomarkers for oral cancer screening, Scientific Reports, 6 (2016). [27] M. Sugimoto, D.T. Wong, A. Hirayama, T. Soga, M. Tomita, Capillary electrophoresis mass spectrometry-based saliva metabolomics identified oral, breast and pancreatic cancer-specific profiles, Metabolomics, 6 (2010) 78-95.
Chapter III Metabolomic signature of antiphospholipid syndrome
Abstract
Antiphospholipid syndrome (APS) is a rheumatic inflammatory chronic autoimmune disease inducing hypercoagulable state associated with vascular thrombosis and pregnancy loss in women. Cardiac, cerebral and vascular strokes in these patients are responsible for reduction in life expectancy. Timely diagnosis and accurate monitoring of disease is decisive to improve the accuracy of therapy. In the present work, we present a NMR-based metabolomic study of blood sera of APS patients. Our data show that individuals suffering APS have a characteristic metabolomic profile with abnormalities associated to the metabolism of methyl group donors, ketone bodies and amino acids. We have identified for the first time the metabolomic fingerprint characterizing APS disease having potential application to improve APS timely diagnosis and appropriate therapeutic approaches.
Introduction
Antiphospholipid (aPL) syndrome (APS) is a rheumatic inflammatory chronic autoimmune disease characterized by the presence of auto-antibodies circulating in the blood directed against phospholipids (aPLa). [1] The autoimmune reaction induces inflammatory processes on the vessel walls, so that APS patients suffer for a hypercoagulable state associated with vascular thrombosis and pregnancy loss in women. [2] APS is diagnosed based on clinical symptoms of venous or arterial thrombosis, pregnancy morbidity and on laboratory tests
consisting in the detection of lupus anticoagulant (LA) and other autoantibodies directed against cardiolipin (aCL) and β2-glycoprotein I (aβ2GPI). The correlation between the positivity to one or more of these markers and the prognosis of the disease is unclear. Specifically the association with thrombosis is strong with full positive aPL profile (triple positivity), but the risk is uncertain when one or two differently combined test are positive. [3, 4] Cardiac, cerebral and vascular strokes in these patients are responsible for a significant reduction in life expectancy [5] and indeed, the cardiac disease course in APS patients may rapidly progress from asymptomatic to severe life-threatening manifestations difficult to deal with. Timely diagnosis and accurate monitoring of APS course is essential to improve accuracy of therapy, avoiding approaches based on medical empiric protocols. APS, as many other autoimmune diseases, is characterized by a heterogeneous nature that has a dramatic impact on the diagnosis and the treatment of the disease. Moreover APS is a gender specific pathology with a prevalent incidence in women and gender specificities with regard to the clinical and laboratory diagnostic profiles. In recent years, metabolomic studies have provided a significant contribution to identify the biochemical pathways involved in many unsolved diseases as well as great support for the appropriate diagnosis, monitoring and therapeutic approach of these diseases. [6] Nuclear magnetic resonance (NMR) spectroscopy is a robust and reliable technique for metabolomic applications: a variety of compounds (charged, neutral, hydrophobic, hydrophilic) can be simultaneously qualitatively and quantitative detected using several different types of biologic samples, such as isolated cells, tissues or body fluids. [7] In the present work, using proton nuclear magnetic resonance (1H-NMR) spectroscopy, we analyzed the blood sera metabolomic profile of APS patients. Our data
define the first metabolomic dataset useful for an early APS diagnosis and a correct monitoring of disease. The first stratification of APS patients according to the gender offers preliminary indications for the management of the disease according to the gender oriented medicinal approach. [8]
Methods Participants
Fifty-four (54) participants were selected from Clinical Pathology Laboratory of DEA III Liv. Nocera-Pagani, ASL Salerno from July 2014 to March 2015. One-half of the present patients (27/54; 50%, male/female: 10/17) had been previously diagnosed according to the revised diagnostic protocols, [9] whereas the control group comprised healthy volunteers without major illnesses (27 subjects, male/female: 10/17). Inclusion criteria consisted of all APS patients and healthy individual who had voluntarily agreed to participate in this study, while exclusion criteria included persons who already had, or recently had, any medical conditions or with a recent history of drug addiction or alcohol abuse.
Sample collection and preparation
Sera samples were collected from male and female according to the standard operating procedure (SOP) for metabolomic-grade serum samples recently defined. [7] Blood was collected into standard blood collection tubes and allowed to clot at room temperature for 30 to 120 minutes before centrifugation (1,500 g for 10 minutes at 4 °C). Serum
was aliquoted and stored at -80 °C in Greiner cryogenic vials prior to NMR spectrometry measurements. Before being transferred to a 5 mm heavy-walled NMR-tube, samples were thawed at room temperature and thereafter spin at 3000 rpm using Vivaspin® 6 centrifugal concentrator to remove proteic and particulate matter. The serum supernatant was removed. To prepare NMR sample, 425 µL of each sera sample ware added to 25 µL of 1M potassium phosphate buffer (pH 7.4) and 50 µL D2O. Trimethylsilyl propionic-2,2,3,3-d4 acid,
sodium salt (TSP 0.1% in D2O) was used as an internal reference for
alignment and quantification of the NMR signals; the mixture, homogenized by vortexing for 30 seconds, was transferred to five millimeters NMR tube (Bruker NMR tubes) before the analysis started. [7]
NMR spectroscopy and processing
NMR experiments were carried out on a Bruker DRX600 spectrometer, equipped with a 5 mm triple-resonance z-gradient CryoProbe. TOPSPIN, version 2.1 or 3.0, was used for spectrometer control and data processing (Bruker Biospin). 1D NOESY experiments were acquired using spectral with of 14ppm, 16k data points, excitation sculpting for water suppression, 192 transients, 4s relaxation delay and 60ms mixing time. The pulse sequence used included an excitation sculpting routine for the suppression of the water signal. [10] Due to the effect of excitation sculpting on the signal height of resonances in the region close to the water resonance, [11, 12] the metabolites that have resonances close to this region (ascorbate, glucose, mannose and pyroglutamate) were quantified using resonances from those metabolites in other spectral regions. A weighted Fourier transform was
applied to the time domain data with a 0.5 Hz line-broadening followed by manual phase and baseline correction in preparation for targeted profiling analysis.
Data Analysis
NMR spectra were manually phased and baseline corrected. Quantification of serum metabolites was achieved using Chenomx NMR-Suite v8.0 (Chenomx Inc.). Briefly, the Chenomx profiler is linked to a database containing more than 250 metabolite NMR spectral signatures encoded at different spectrometer 1H frequencies, including 600 MHz (http://www.hmdb.ca). Comparison of the spectral data obtained for each serum sample with the Chenomx metabolite library results in a list of compounds together with their respective concentrations based on the known concentration of the added internal reference compound, TSP. Each spectrum was analyzed three times.
Multivariate Data Analysis
Multivariate data analysis based on projection methods was applied for statistical data analysis. Specifically, exploratory data analysis was performed by principal component analysis (PCA) while a projection to latent structures (PLS-DA)-based method was applied to discriminate the samples. While PCA is a well-known technique used in multivariate data analysis, the PLS-based approach is a robust regression technique used to investigate the relationships existing between two blocks of data, usually called X- and Y-block and has predictive applications. In the present study, discriminant classification was
carried out using partial least squares-discriminant analysis (PLS-DA), a method based on the PLS regression algorithm. Projection methods in multivariate data analysis were performed by using SIMCA-P+ software (Version 12.0, Umetrics, Umeå, Sweden). The entire data matrix, after log transform and Unit Variance scaling, was first analyzed by PCA to define homogeneous cluster of samples (Exploratory data analysis). A specific variable, showing significant variation in grouping the classes was selected (urea) as Y in partial least squares discriminant analysis (PLS-DA). Models were validated by cross-validation techniques and permutation tests according to standardized good practice to minimize false discoveries and to obtain robust statistical models. A small number of metabolites changing during the experiment was extracted and the behavior of each single metabolite was studied by linear mixed-effects model for longitudinal studies. All the different pretreatments provided good discriminant ability in calibration and cross-validation (above 90%). [13]-[14] We submitted our data to MetaboLights database with ID code: MTBLS356.
Results
The mean concentrations of serum metabolites of APS patient blood sera together with a representative 1H-NMR spectrum are reported in supplementary material. For each sample, 50 metabolites were identified and quantified. Figure 1 reports a graphical representation of the mean metabolite concentrations of healthy subjects as reported in literature and in our control vs. APS patient blood sera. [15]
Fig. 1 Overview of mean concentrations of serum metabolites as determined by 1H-NMR analysis of human blood serum in APS patients, vs. healthy controls in our samples and in literature.
Metabolomic ‘snapshot’
To identify the metabolomic ‘snapshot’ in APS patients 1H-NMR data were processed according to multivariate data analysis (MVA) by using both unsupervised and supervised projection methods. The dataset was log-transformed, unit variance centered and scaled. Normalized data were analyzed by defining a matrix composed of 54 observations and 50 variables. The data collected were then investigated using PCA. The first component explained the 41% of variance while the second the 0,4%. The choice of principal components was done considering the fitting (R2X) and predictive values (Q2X), for the PCA model, in our case the second component gave the closest values to 1 for both of them. Figure 2A shows the PCA score scatter plot for the
1H-NMR spectra of the APS blood sera. Three observations fell outside
the confidence ellipse. Visual inspection evidences separation into two groups almost corresponding to patients versus healthy donors. Some data were scattered widely on the right side of the graph with several overlap between the two groups. The visualization of variables plot, using loading scatter plot relative to PCA, provides preliminary indications on the metabolites responsible for this separation. Urea appears as the most influent metabolite (Figure 2B). Based on this observation urea was used as variable classifier (Y block) in the construction of PLS-DA model (Figure 3A). The fitting (R2Y) and predictive (Q2Y) values for the PLS-DA model were respectively 0.744 and 0.505. Visualization of metabolites using loading scatter plot PLS-DA was carried out to identify potential metabolites that are responsible for the discrimination showed in PLS-DA score scatter plot. Loading scatter plot showed potentially significant metabolites based on contributions and reliability to the separation observed in score scatter plot. Metabolites in the loading plot that were distant away from the origin and close to the vertical axis (separation based on the first principal component) could be considered responsible for the exhibited separation in PLS-DA score scatter plot (Figure 3A). Inspection of loading scatter plot (Figure 3B) points to 2-hydroxybutyrate, acetoacetate, arginine, betaine, choline, glutamate, glutamine, urea as metabolites distinctive of APS pathological sera.
Fig. 2 PCA score scatter plot (A) and loading scatter plot (B) for the H-NMR data collected in 1D NOESY spectra of human APS sera using 50 measured metabolites from 27 APS patients and 27 donors. In graph 2A Red triangles correspond to data of APS patients and green triangles to data of healthy donors.
Fig. 3 PLS-DA Score scatter plot (A) and PLS loading scatter plot (B) for the H-NMR data collected in 1D NOESY spectra of human APS sera using 50 measured metabolites from 27 APS patients and 27 donors. In Figure 3A red triangles correspond to data of APS patients and green triangles to data of healthy donors.
Gender Differences in total metabolomic profile
To establish metabolomic profile specificities correlated with gender in APS disease, we performed statistical analysis on the subset of 1 H-NMR data separately collected on female and male APS patient sera. Two separate data matrices were generated: the first included 50 metabolites for 17 females and the second 50 metabolites for 17 males. The data of each matrix were independently aligned, pre-treated and analyzed using PCA and PLS-DA. The first component explains 46% of variance while the second the 0,78%. The choice of principal components was done on the basis of for the PCA model. Even in this case PLS-DA was performed using urea variable as a classifier (Y block). To improve the separation observed with the PCA model, supervised PLS-DA was applied (fitting (R2Y) value resulted 0,520 in and predictive (Q2Y) value resulted 0,576. Visualization of metabolites using PLS-DA was carried out to confirm metabolites that are responsible for the discrimination showed in PLS-DA score scatter plot. PCA (Figure 4) and PLS-DA (Figure 5) statistical analysis confirmed, even for this data set, the metabolites distinguishing pathological and donors sera. In particular abnormal presence of amino acid valine, lysine and glycine proved to be characteristic of APS female pathological state.
Fig. 4 PCA Score scatter plot (A) and PCA loading scatter plot (B) for the 1H-NMR data collected in 1D NOESY spectra of human female APS sera using 50 measured metabolites from 17 female APS patients and 17 female donors. In Figure 4A red triangles correspond to data of female APS patients and green triangles to data of female healthy donors.
Fig. 5 PLS-DA Score scatter plot (A) and loading scatter plot (B) for the 1H-NMR data collected in 1D NOESY spectra of human female APS sera using 50 measured metabolites from 17 female APS patients and 17 female donors. In Figure 5A red triangles correspond to data of female APS patients and green triangles to data of female healthy donors.
Discussion
APS is a systemic inflammatory autoimmune disease characterized by the production of autoantibodies against the blood vessel layers. The process targeting the vessel walls increases the risk for vascular atherosclerosis ending in cardiac or cerebral stroke. While the correct APS diagnosis is not straightforward, as based on the non-trivial combination of three laboratory tests and difficult clinical evaluation, timely diagnosis is necessary for an appropriate therapeutic decision-making. Our data provide the first blood sera metabolomic profile of APS patient suitable to integrate diagnostic laboratory and clinical tests. A metabolic differentiation was evident in individuals affected by APS; in particular, we found higher levels of choline, betaine, 2-hydroxybutyrate, acetoacetate, arginine, glutamate, while lower levels of glutamine and valine (Figure 1). It is well known that choline and betaine are found in the metabolic pathway of methyl group donors; 2-hydroxybutyrate and acetoacetate are part of ketone bodies pathways of the lipid metabolism, arginine, glutamate, glutamine amino acid metabolism. Choline is an essential nutrient that serves as a component of phosphatidylcholine (PC), a precursor of the neurotransmitter acetylcholine. It can be oxidized to betaine in humans. Choline and betaine function as methyl donors in pathways involving the re-methylation of homocysteine to methionine to diminish blood homocysteine [16] and in DNA and histone methylation, which may play potential roles in cardio-metabolic diseases. [17,19] Lack of sufficient amounts of choline in the diet can lead to a fatty liver condition and general liver damage. This arises from the lack of very low density lipoproteins (VLDL), which is necessary to transport fats away from the liver. It is worth noting that a metabolomic study of metabolic disturbances that underlies systemic lupus erythematosus
evidenced alteration in all methyl group donors, including cysteine, methionine, and choline, as well as phosphocholines. [20] Betaine insufficiency is associated with metabolic syndrome, lipid disorders and diabetes, and may have a role in vascular and other diseases. [21, 22] Acetoacetate (AcAc) is produced in the liver and serves as alternative energy sources for the brain, heart, and skeletal muscle in mammals during nutrient deprivation and adherence to low carbohydrate diets. [23, 24] It has been correlated with metabolic syndrome and early stage type 2 diabetes, abnormal homocysteine levels. [25] Abnormal concentrations of acetoacetate (AcAc) is also associated with altered immune cell function, highlighting the potentiality of metabolomics approach to unveil the biochemical basis of pathological process.
Arginine, a semiessential amino acid, is taken up by cells using the y+ transport system. Its synthesis occurs from citrulline mainly in the liver and in the kidney. Arginine is metabolized either in ornithine and urea mainly in the liver and the intestine or in citrulline and nitric oxide (NO•) in a large number of cell types. Ornithine derived from arginine can be metabolized in citrulline (in the context of the urea cycle), in glutamate or in polyamines. Arginine dysmetabolism is related to catabolic disease such as sepsis, injury and cancer. [26, 27] Immune cells exhibit the ability to synthesize both polyamines and NO, which are potent immunomodulators. Therefore, evidence from animal and human models point to the immunomodulatory role of L-arginine metabolism in physiological, as well as pathological conditions. [28] Glutamine–glutamate metabolism is an important energetic and biosynthetic nutrient for T and B lymphocytes and its irruption has been observed in different inflammatory, metabolic, and autoimmune pathologies. [29]
![Fig. 1 The "Omics" cascade studies [4]](https://thumb-eu.123doks.com/thumbv2/123dokorg/7206478.76115/6.892.388.522.169.485/fig-the-omics-cascade-studies.webp)