TrueNets
: a Topology Generator
for Realistic Network Analysis
Gabriele Gemmi
University of Trento [email protected]Renato Lo Cigno
University of Brescia [email protected]Leonardo Maccari
University of Venice [email protected]Abstract—The availability of realistic topology generators is a key component in the study of network performance. This work describes a new approach for realistic generation of topologies, named TrueNets, that uses open data provided by public administrations and crowd-sensing efforts for populated areas, maps, altitude of land and buildings; TrueNets estimates link performance with classical propagation models and produces annotated topologies of networks that can actually exist in the selected areas, thus providing not only an abstract tool for performance evaluation, but also a design tool for planning. We use TrueNets to model distributed mesh networks and we show that the generated topologies differ substantially from state-of-the-art synthetic generators.
I. INTRODUCTION
Topology generators are essential in computer science and telecommunication engineering. They enable the evaluation of algorithms, protocols, and distributed systems using topologies that resembles real scenarios. Depending on the area of research, topology generators with different properties were proposed, mostly based on the observation of real world networks. A good example is the study of the topology of the Internet, which started with the measurement of its main features [1], and followed with topology generators [2] mimicking these features. In the context of Wireless Mesh Networks (sWMNs), research went thorugh a similar path, with initial observations followed by topology generators for both mixed wireless-wired [3] and wireless networks [4].
At the height of WiFi novelty, WMNs were a hot topic in research. Today there are large WMNs running in several cities [5], and recent technology trends are refreshing the interest in WMNs also in light of 5G (and beyond) wireless networks evolution. First of all, today WiFi technology enables low-cost gigabit wireless links spanning several kilomenters, which makes large-scale WMNs an effective technology to fight digital divide (which in 2019 still touches roughly 50% of the world population). Second, several other emerging network technologies use a wireless multi-hop network, including the Internet of Things [6] and 5G wireless backhauling [7]. Yet we don’t have realistic topology generators for WMNs to test the design of protocols and applications. The only work that addressed this topic is from Milic and Malek and produced the Node Placement Algorithm for Realistic Topologies (NPART) topology generator [4], which generates a growing spatial graph trying to match the degree distribution and other graph
properties observed in some real networks, namely Commu-nity Networks in the German cities of Berlin and Leipzig.
In this work we describe a new, initial effort to fix this gap. TrueNetsis a topology generator that uses data from the real world to generate network topologies that might actually exist in a specific location, as contrasted to more abstract synthetic topologies. TrueNets uses open data on land surface and buildings height, datasheets from commercial outdoor wireless devices and a realistic way of estimating the network growth from some given starting point. The result is an annotated topology made of nodes that correspond to existing buildings, and edges that connect buildings that are in line-of-sight, with an estimation of the available bandwidth for the final user. We introduced TrueNets in a previous paper [8], where we presented the algorithms used to generate the topology and the architecture of TrueNets1, and we discussed how different
strategies can influence the growth and final properties of WMNs, without comparison with other topology generators.
Here we compare the topologies generated with TrueNets and NPART and we show one key difference due to correlated shadowing. We note that the density (i.e., the ratio of edges to nodes) of networks generated with TrueNets is smaller, due to the fact that edges can not be arbitrarily created between pairs of nodes. This impacts the average shortest path length, which is a key parameter to determine network performance.
II. TOPOLOGYGENERATORS
A. TrueNets
TrueNetsis a tool developed in order to model the growth of a Wireless Community Network in a given environment. By taking advantage of very precise morphological data collected with the LIDAR technology, it is able to predict with high precision whether between two given points in the space there’s Line of Sight (LOS) or not. This allows the tool to overcome the correlated shadowing problem of most topology generator and to model realistic networks in any kind of environment. It is made of three main components:
• A PostGIS database,
• libterrain,
• A network modeling strategy.
The PostGIS database contains the LIDAR measurements of the interested areas with a precision of1 m2 and the data of
all the buildings in the area.
Figure 1: Graphic representation of the elevation profile with LOS and Fresnel area.
These data are used by libterrain to emulate the feasibility of a wireless link between two given buildings. In the case the link is feasible it also gives a rough estimation of the path loss. TrueNets includes technical specifications of real 802.11ac devices from the Ubiquiti equipment manufac-turer.2 For each device we stored the maximum transmission
power, the antenna gain and aperture, the sensitivity for each supported Modulation and Coding Scheme (MCS), and also an average price, extracted from official stores (dated Sept. 2018). Every time a new node is placed in the map, the most price efficient combination of wireless devices is chosen to realize the new link. Figure 1 shows a projection of a wireless link generated with TrueNets. Link feasibility, link length and link performance in TrueNets is thus grounded on real-world physical and technological constraints.
TrueNets includes growth strategies that pick random points in a given area and extend the network. Among them we have a simple greedy strategy, that always tries to maximize the bandwidth available for a new wireless link, or that tries to globally balance traffic. More information on the strategies and the generator structure, as well as pointers to the github repository where it can be retrieved can be found in [8]. B. NPART
NPART is an algorithm for topology generation developed to provide a flexible tool for the generation of topologies. The main characteristics of this generator are:
• Realism: The parameters of the generator come from the
observation or real networks, and the generated topolo-gies resemble the features of the same real networks;
• Randomness: The generator is capable to create random networks preserving the key properties and realism. The idea of the algorithm devised in [4] is that a new node is more likely to join the network if it’s in an area already populated, on the other hand if the node is out of the area of 2Devices of any other manufacturer can be added to the data base, and also
devices with arbitrary characteristics defined by the user.
the actual network it may become a seed for a new larger sub-network. This is implemented by representing the network on a 2-dimensional space and randomly extracting the position of new nodes. Then the candidate nodes are sorted with respect to their distance to the existing nodes and among the candidates, one is chosen so that a user-provided degree sequence is preserved.
III. COMPARINGGENERATORS
NPART has the advantage to be a synthetic generator, valid independently from the geography and population, but as such it also has several limitations. The first one is that it tries to match the degree sequence of two specific networks, but it is not clear how to generalize this approach. The second (which is also analyzed in the original NPART paper), deals with correlated shadowing and emerges while analyzing the number of bridges and articulation points in the resulting graph. In fact, without correlated shadowing, nodes that are physically close to each other tend to form cliques, while in reality there might be obstacles that prevent this from happening. To account for this, NPART introduces an optional pruning of the 20% of the leaves.
In order to generalize NPART we use degree sequences generated from known statistical distributions, and not only the networks of Berlin and Leipzig. Works that analysed several real world mesh networks suggest that a power law distribution withα = 1.55 may fit real networks [3], [8]. We feed NPART with such distribution (empirically truncated atn = 500
7 = 71)
to generate topologies of arbitrary size. A. Results
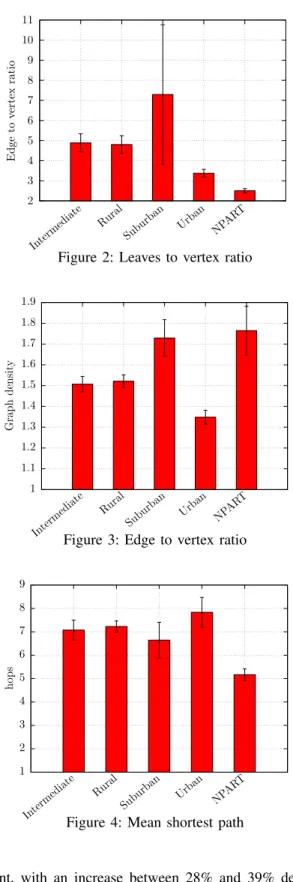
For this analysis we generate 2200 topologies of size 500 nodes with NPART. With TrueNets we collected data from 4 real Italian areas labeled Urban, Suburban, Intermediate and Rural (see [8] for details on this process) and we generate a total of 220 topologies. We stress that these graphs are realistic graphs, i.e., with the most up-to-date information available on the geography of the place and the performance of real devices, we can tell that these networks can actually exist. We report three graph metrics (leaves to vertex ratio, edge to vertex ratio, and mean shortest path) averaged over all topologies that show the difference between NPART and TrueNets in the 4 different scenarios. Figure 2 shows that TrueNets generates a much higher number of leaves compared to NPART, especially in the suburban area (we did not apply the leaf pruning in NPART to avoid to artificially stress the difference). This means that a network generated with realistic constraints tends to have more nodes with a single connection. Figure 3 shows the ratio between edges and vertexes. In this case NPART has an average value similar to TrueNetsin the suburban area and far from TrueNets in the urban area. In a connected network with N vertices the minimum edge to vertex ratio isN −1N , so the difference shown in Fig. 3 changes significantly the network characteristics.
Figure 4 reports the average length of the shortest paths between every couple of node in the network. The effect is
2 3 4 5 6 7 8 9 10 11 Intermediate Rural Suburban Urban NP ART Edge to vertex ratio
Figure 2: Leaves to vertex ratio
1 1.1 1.2 1.3 1.4 1.5 1.6 1.7 1.8 1.9 Intermediate Rural
Suburban Urban NPAR T
Graph
densit
y
Figure 3: Edge to vertex ratio
1 2 3 4 5 6 7 8 9 Intermediate Rural
Suburban Urban NPAR T
hops
Figure 4: Mean shortest path
evident, with an increase between 28% and 39% depending on the area. This is a direct consequence of the decrease in the density of the graph and in the increase of the number of leaves, that together make the average path length longer. The length of the shortest paths has a direct impact on network performance, because it directly influences the end-to-end delay, the probability of packet loss, and the amount of messages generated for an end-to-end communication.
IV. CONCLUSIONS ANDFUTUREDEVELOPMENTS
Networks, and wireless networks as a consequence, are becoming more and more dynamic and integrated with ser-vices. Techniques like network slicing and network function virtualization are key to efficiently use network infrastructure to satisfy the growing need for bandwidth. Unfortunately the problem of network embedding, or the definition of the minimal set of network functions to place in a network can not be solved optimally and need to be treated with heuristic algo-rithms. Heuristics strongly depend on the specific network in which they are tested, so it becomes of paramount importance to use topologies that faithfully describe real networks. Yet, neither we have realistic generators, nor we have sufficient examples of running networks to test algorithms on them . . . specially in the design phase, when networks and services are not deployed yet! We believe that TrueNets can be an extremely useful tool to facilitate future research in this (and other) field, which can help researchers to test their algorithms in realistic scenarios with the necessary variability (such as considering areas with different density of buildings and pop-ulation). As a starting point in this paper we tested TrueNets against NPART, which is the most accurate topology generator for mesh networks in the literature and several differences emerged.
We now plan to keep developing TrueNets in two di-rections: i) we want to extend the number of areas we can model, in order to generalize abstract features of different areas (from urban to rural); and ii) we want to extend TrueNets to other technologies, and not only 802.11ac. Since wireless backhauling is an integral part of 5G, it would be extremely interesting to study how it can be implemented in real cities. Also low-power, long-range communication networks (like LoRaWan networks, to name one popular technology) would be suitable to be modeled with TrueNets.
REFERENCES
[1] M. Faloutsos, P. Faloutsos, and C. Faloutsos, “On Power-Law Relation-ships of the Internet Topology,” in ACM Conf. on Applications, Technolo-gies, Architectures, and Protocols for Comp. Comm. (SIGCOMM), Aug. 1999.
[2] A. Elmokashfi, A. Kvalbein, and C. Dovrolis, “On the scalability of BGP: The role of topology growth,” IEEE Jou. on Selected Areas in Communications, vol. 28, no. 8, 2010.
[3] L. Cerd`a-Alabern, “On the topology characterization of Guifi.net,” in IEEE Int. Conf. on Wireless and Mobile Computing, Networking and Comm. (WiMob), Oct. 2012.
[4] B. Milic and M. Malek, “NPART – Node Placement Algorithm for Realistic Topologies in Wireless Multihop Network Simulation,” in 2nd Int. Conf. on Simulation Tools and Techniques, Mar. 2008.
[5] L. Maccari and R. Lo Cigno, “A week in the life of three large Wireless Community Networks,” Ad Hoc Networks, vol. 24, Part B, 2015. [6] C. Gu, R. Tan, and X. Lou, “One-Hop Out-of-Band Control Planes for
Multi-Hop Wireless Sensor Networks,” ACM Trans. on Sensor Networks, vol. 15, no. 4, 2019.
[7] D. Chen, J. Schuler, P. Wainio, and J. Salmelin, “5g self-optimizing wireless mesh backhaul,” in IEEE Conf. on Comp. Comm. Workshops (INFOCOM WKSHPS), Apr. 2015.
[8] L. Maccari, G. Gemmi, R. Lo Cigno, M. Karaliopoulos, and L. Navarro, “Towards scalable Community Networks topologies,” Ad Hoc Networks, vol. 94, 2019.