The contribution of brittle deformation processes
on improving hydrocarbon carbonate reservoirs:
the Jandaíra Formation (Turonian - Campanian)
as analogue.
by Aline Theophilo Silva
PhD Thesis in Geologia dell’ambiente e delle Risorse
XXIII ciclo
Tutor: Prof. Francesco Salvini
Dipartimento di Scienze Geologiche, Università degli Studi Roma Tre
Co-Tutor: Dr. Paola Ciafarra
Dipartimento di Scienze Geologiche, Università degli Studi Roma Tre
For all the support and love they have always given me.
In memory of João Baptista Filho
João Baptista Filho
João Baptista Filho
João Baptista Filho (1949 - 2009)
My first professor of Geology, an example of love for this
science, and someone that marked my personal development.
I acknowledge Petrobras for allowing me to do this PhD and for the financial support.
I also acknowledge the Roma Tre University, for receiving my PhD project, and my tutor Francesco Salvini.
I am especially grateful to my manager Maria José Resende Oliveira (Petrobras / Cenpes), for the support she always gave me, and to Professor Francisco Hilário Rego Bezerra (University of Rio Grande do Norte, Brasil), who gave me very useful advices and collaborated a lot for the field work. Their support was crucial for the successful completion of this work.
I am thankful to Paola Cianfarra (Roma Tre University), for her patience for teaching me the softwares I used on this thesis, and for her friendship and concern on making me feel that I was not alone in a strange country.
Many thanks to my colleague Anderson Moraes (Petrobras / Cenpes), for the technical discussions, the great help with the numerical models, and for his sense of humor. His contribution was essential for this thesis to reached a good result.
I acknowledge Petrobras / UN-RNCE, represented by Silmara Campos (manager of EXP/ABIG), for authorizing the use of the four seismic lines presented in the thesis and the geophysicist Pedro Xavier Neto, for having recovered the seismic lines sent to me.
I also thank the geophysicist Amin Murad (Petrobras / Cenpes) for the time to depth conversion of the seismic data, and to his manager Eduardo Lopes de Faria, for authorizing Amin to dedicate some of his time to do this conversion. The geophysicist Paulo Eduardo Miranda Cunha for your help on understanding some interference features on the carbonates imaged by the seismic lines, which were interpreted as karstic evidences.
Many thanks to the staff of the Cenpes’ library, who spared no efforts to obtain the articles, books, and public data I requested.
My colleagues Isabella de Oliveira Carmo, Mario Neto Cavalcanti de Araujo and Paulo Cezar Santarém da Silva (Petrobras / Cenpes), who allocated part of their time to read the chapters of the thesis. Thanks for the comments and suggestions.
Thanks to Cláudia Maria Andrade de Sousa and Rafael Duarte (respectively Graduation and M.Sc. students at the University of Rio Grande do Norte) for their assistance on the field work. Special thanks to Cláudia for doing the manual detection of fracture lineaments at the study area scale.
My psychologist Patricia Wasserman (Brasil) and my yoga teachers Flavia Melo Seabra (Brasil) and Patrizia Gelli (Italy) for helping me to maintain my equilibrium.
Thanks to Irene Manino, for her friendship, sincerity, and perspicacity.
Special thanks to all my friends who cheered me, supported me when I was too anxious, shared their own experience with me, and, after all, became happy because I have completed this challenge.
I am grateful to the Buddha Shakyamuni and to the Dalai Lama, whose teachings have helped me keep focus and remember that there still are many others objectives to achieve.
I am deeply grateful to Sri Krishna, Gurudeva, who certainly has been conducting me and will be forever.
unfractured, with the possible exception of extremely ductile rock, such as salt or certain shales, you will not be able to recall any unfractured rocks simply because they don’t exist. (…)”
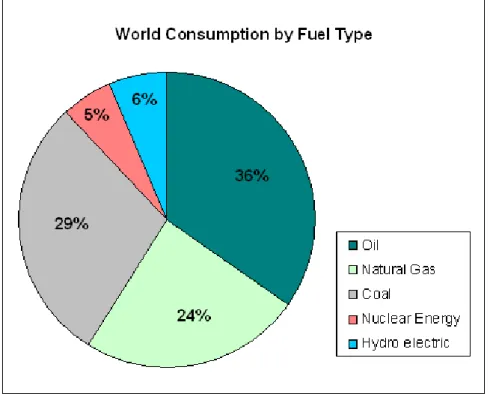
Nowadays, hydrocarbons are the most important source of energy. In 2008 they represented 60% of the main types of fuel consumed worldwide (oil – 36%; natural gas – 24%; coal – 29%; nuclear energy – 5%; hydroelectric – 6%). In this context carbonate reservoirs are significant for the global oil and gas supply, as long as more than 60% of oil and 40% of gas reserves are found in this type of rock. But the knowledge about the key elements controlling the porosity and permeability on these reservoirs is incomplete. What is especially true regarding the understanding of fracturing contribution to secondary porosity creation and permeability increases.
The goal of this thesis was to contribute for the investigation of the actual role of fractures on carbonate reservoirs. To accomplish this commitment were studied a great exposition of Jandaíra Formation carbonates (Potiguar Basin, NE Brasil) where are located a well-developed cavern system named Furna Feia (linear development of 739m, maximum depth of 30m) and other karstic features (e.g. sinkholes; minor caverns), all of them presenting strong evidences of structural control. Such karstic environment was used as analog to investigate the relation between fracturing and high permeability corridors on carbonates, based on the generally accepted concept that caverns on carbonates are mostly formed by erosion due to natural acid in groundwater, which seeps through bedding-planes, faults, joints, etc.
The methods used in this study were: compilation of public data; lineament analysis (regional and local scales); outcrops structural analysis; structural measurements analysis; numerical modeling. Below, the sequence of analysis performed and theirs main results are described.
1. Information about the Potiguar Basin evolution and available data about the nowadays stresses were compiled from the literature. The state of stress operating today on the Basin was understood from earthquakes focal mechanisms, borehole breakouts analysis, and fracturing testes results from wellbores. These data demonstrated that: (i) the nowadays state of stress predominant through the Basin is strike-slip, with some reverse or normal mechanisms; (ii) the orientation of the maximum horizontal stress component ranges from NW-SE to E–W. Given such stress regime, it was considered
oriented to be reactivated as strike-slip faults.
2. Lineament analysis were performed at regional-scale (using SRTM3 data) and at local-scale (using GoogleProTM high resolution satellite images). From the regional-scale analysis, the main azimuth frequency of lineaments obtained that for the Potiguar Basin is oriented NE-SW (N65oE). From the local-scale analysis, the main azimuth frequency of lineaments is oriented NW-SE (N49oW). These two directions are nearly orthogonal (114o divergent), putting into evidence that at the study area some particular structural evolution exists and it could be related or not to the regional tectonic-structural history.
3. From the analysis of outcrops and structural measurements, the NW-SE direction was confirmed as the principal structural trend at the study area. By using specific fault inversion methods included into the Daisy software, two stress tensors that possibly generated the observed deformation were calculated: (i) using the “inversion by rotax analysis” method it was obtained a stress tensor oriented NW-SE (N330oE), compatible with a strike-slip fault regime, which could only explain the observed faults; (ii) using the “Direct Inversion” method it was obtained a stress tensor also oriented NW-SE (N318oE), but compatible with a reverse fault regime, which could explain the whole deformational elements observed through the area (i.e. faults; joints; bedding). Both stress tensors are in conformity with the present day regional state of stress given by the seismology and the borehole data analysis. But the second stress solution was assumed to be the most reliable because the Monte Carlo test included on the algorithm presented a well constrained distribution of the possible stress tensors.
4. A comparative analysis between the azimuth distribution of the Furna Feia principal galleries axis and the statistical analysis (Azimuth by Frequency distribution) of the local-scale lineaments and structural elements (i.e. faults; joints) was done. Such comparison evidenced a clear coincidence between the principal trends obtained for the study area and the cavern’s galleries axis.
5. On the basis of all available information the following tectonic-structural model for the study-area was proposed:
a. A major not outcropping NE-SW normal fault exists somewhere toward NW from the study area;
c. This inversion movement caused the exhumation of the Jandaíra Formation, on the returning hanging wall of the main NE-SW fault;
d. Minor NW-SE strike-slip faults result from the accommodation movements due to the major NE-SW fault activity;
e. Minor NE-SW strike-slip faults constitute conjugated pairs with the NW-SE strike-slip faults, or are related to oblique movements of the main NE-SW fault. f. The fracturing associated to this deformation history was responsible for the creation of oriented high fractured corridors. These corridors control the meteoric water circulation through the Jandaíra carbonates, conducting the dissolution process and the formation of the Furna Feia caverns system.
6. Afterwards a sequence of numerical models was run in order to examine the reasonability of the theory proposed for the permeability increase in the Jandaíra carbonates. Such numerical models are based on mechanical analysis by finite element method for 2D simulation, comprised in the TECTOS program.
At the end of this work it was accepted that the faults and joints observed through the whole study area, associated to a dilatancy effect, led to a porosity increase in the Jandaíra carbonate rocks and controlled the creation of high permeability corridors. Such high permeability zones focalized the water percolation into the carbonate rocks and conditioned the growth of the Furna Feia cavern system.
Keywords:
Carbonate reservoirs; brittle deformation; Jandaíra Formation; Potiguar Basin; karst; lineaments; structural analysis; numerical models.
Petrophysics
md – Millidarcy; unit of measure of permeability equivalent to one-thousandth of Darcy.
A porous medium has a permeability of 1 Darcy when differential pressure of 1 atmosphere across a sample 1 centimeter long and 1 square centimeter in cross section will force a liquid of 1 centipoise of viscosity through the sample at the rate of 1 cubic centimeter per second.
Time
M.y. - million years
Volume
MBOE - Thousands of Barrels of Oil Equivalent MMBO - Million Barrels of Oil
MMBOE - Million Barrels of Oil Equivalent MCF - Million cubic feet
Page Dedicatory……….ii Acknowledgements………..…iii Epigraph……….v Abstract……….vi Units Glossary………..ix Table of Contents………...………...x List of Figures………..………...xii
Chapter 1 – Problem Presentation 1. Introduction ... 1
2. Fractures contribution for reservoirs productivity... 3
3. Problem outline ... 5
4. Thesis objective ... 6
Chapter 2 - The Potiguar Basin 1. Introduction ... 8 2. Tectonic-Structural Development... 9 3. Tectonostratigraphy ... 11 3.1. Supersequence Rift ... 11 3.2. Pos-rift Supersequence ... 12 3.3. Drift Supersequence ... 13 4. Magmatism ... 15 5. Seismology ... 16
6. Present day Stresses on Potiguar Basin ... 18
6.1. Stresses Orientation on Potiguar Basin ... 19
6.2. Stress Regime on Potiguar Basin ... 22
2. The use of lineaments analysis on this thesis ... 27
3. Lineaments detection methods ... 29
3.1. Lighting condition ... 29
3.2. Automatic detection methodology ... 31
3.3. Manual tracing methodology... 35
4. Results for Regional-scale Lineaments ... 37
5. Results for Local-scale Lineaments... 41
6. Partial conclusions... 44
Summary... 44
Chapter 4 - Structural Analysis 1. Introduction ... 45
2. Outcrops structural analysis ... 45
2.1. Measurements analysis ... 48
2.2. Stresses Direction in the study area... 53
3. The Furna Feia cavern system ... 56
4. Seismic line data... 60
5. Tectonic-structural Model ... 62
Chapter 5 – Numerical Modeling 1. Introduction ... 65
2. Preparing the numerical modeling... 65
3. Setting up scenarios ... 67
4. Modeling results ... 69
5. Partial conclusions... 71
Chapter 6 – Conclusions ………..73
References Cited ……….………..76
Chapter 1
Figure 1. 1. Participation of main fuels in the global energy supply... 1
Figure 1. 2. General distribution of carbonate reservoirs worldwide. ... 2
Figure 1. 3. Example of variability in porosity-permeability relationship. ... 3
Figure 1. 4. Oil recovery versus porosity for 5915 pools in Alberta (Canada). ... 5
Chapter 2 Figure 2. 1. Localization and Tectonic Framework of Potiguar Basin... 8
Figure 2. 2. Schematic chart of South Atlantic opening... 9
Figure 2. 3. Potiguar Basin stratigraphic chart. ... 14
Figure 2. 4. Schematic evolution of Potiguar Basin ... 15
Figure 2. 5. Seismicity at Potiguar Basin area... 17
Figure 2. 6. Deformations occurred around the borehole section. ... 20
Figure 2. 7. Four-arm caliper tool and types of borehole section enlargement. ... 21
Figure 2. 8. SHmax orientation at Potiguar Basin area. ... 22
Chapter 3 Figure 3. 1. – San Andreas Fault from aircraft-derived image (1936). ... 25
Figure 3. 2 – Lineaments perception from different scales. ... 26
Figure 3. 3. Karstic fabric at the study area... 28
Figure 3. 4 – Lighting effect on topography image. ... 30
Figure 3. 5 – Young lineaments compared to old lineaments. ... 31
Figure 3. 6 –Routine to create input images to SID3. ... 32
Figure 3. 7 – SID’s parameters describing a standard lineament. ... 33
Figure 3. 8 – Example of automatically detected lineaments from SID3... 34
Figure 3. 9 – Example of ascii output file from SID3. ... 35
Figure 3. 10 – Subdivision of the study area. ... 36
Figure 3. 11 – Outcrops raster image from Area 6. ... 36
Figure 3. 12. – Example of manual tracing of lineaments (Area 6). ... 37
Figure 3. 13 – Automatically detected lineaments for each light condition... 38
Figure 3. 17. Lineament domains distribution for each sub-area. ... 41
Figure 3. 18. Lineament domains obtained by merging all automatically detected data. ... 42
Figure 3. 19. Merging of the manually traced lineaments... 43
Chapter 4 Figure 4. 1. Study area localization. ... 45
Figure 4. 2. An overview of fracturing at the study area... 46
Figure 4. 3. Examples of sinkholes on Jandaíra Formation. ... 47
Figure 4. 4. Examples of cinematic indicators on Jandaíra’s carbonates. ... 47
Figure 4. 5. Distribution of the analyzed outcrops. ... 48
Figure 4. 6. Bedding stereographic diagram and poles contouring. ... 49
Figure 4. 7. Faults stereographic diagram and poles contouring... 50
Figure 4. 8. Joints stereographic projection and poles contouring. ... 51
Figure 4. 9. Azimuths frequency of the more common structural elements. ... 52
Figure 4. 10. Stress tensor according to the method inversion by rotax analysis... 54
Figure 4. 11. Stress tensor according to the Direct Inversion method... 55
Figure 4. 12. Localization of the Furna Feia cavern... 56
Figure 4. 13. The Furna Feia map. ... 57
Figure 4. 14. Mean axis of the Furna Feia Galleries. ... 58
Figure 4. 15. Trends coincidence analysis... 59
Figure 4. 16. Four seismic lines available for the study area. ... 60
Figure 4. 17. Elements identified on the seismic lines. ... 61
Figure 4. 18. Possible caverns observed on the seismic data. ... 61
Figure 4. 19. Tectonic-structural model for the study area. ... 64
Chapter 5 Figure 5. 1. Base for the numerical modeling. ... 66
Figure 5. 2. Basic mesh for the model... 67
Figure 5. 3. Support conditions of the model’s borders. ... 68
C
C
C
C
C
C
C
C
C
C
C
C
hhhh
hhhh
hhhh
aaaa
aaaa
aaaa
pppp
pppp
pppp
tttt
tttt
tttt
eeee
eeee
eeee
rrrr
rrrr
rrrr
1111
1111
1111
P
P
P
P
P
P
P
1. Introduction
Nowadays hydrocarbons are the most important source of energy in the world. Only in 2008 they represented 60% (36% oil and 24% gas) of the main types of fuel consumed (Figure 1.1; BP, 2009). According to the IEA report (2006) fossil fuels will remain the dominant source of energy to 2030, accounting for 83% of overall increase demand. The report also predicts that global oil demand reaches 99MMBO/day in 2015 and 116MMBO/day in 2030. In this context carbonate reservoirs have a great importance, as long as more than 60% of the World’s oil and 40% of the World’s gas reserves are found in this type of rock (Schlumberger, 2007; Montaron, 2008).
(Source: BP Statistical Review, June 2009)
Figure 1. 1. Participation of main fuels in the global energy supply.
According to a C&C Reservoirs[Appendix, 1.1] report (1998), despite their relevance for the global energy supply, during the 80’s and 90’s carbonate plays have not been receiving much attention from the industry and only a few number of discoveries were made in this type of rock. The report points out the complexity of carbonate systems, combined to economic and market aspects and exploration opportunities, as the most possible reason for the avoidance of these exploratory targets.
The complexity of carbonate systems is mainly due to the depositional conditions of carbonate sediments and to the greater chemical reactivity of carbonate minerals. Carbonate sediments have been deposited in shallow warm oceans since the Proterozoic to the Present, and the sedimentation is mostly done by biological activity (e.g. stromatolites; coral reefs; accumulation of shells and skeletal material). Once carbonate deposits are closely related to the evolution of life on Earth, their depositional conditions present a great variability in the space (Figure 1.2) and through the geological time. It results into a wide range of composition, textures, and, consequently, pore-space distribution (Choquette and Pray, 1970; Sarkisyan et al, 1973; Lonoy, 2006; Lucia, 2007).
(Modified from: Ehrenberg and Nadeau, 2005)
Figure 1. 2. General distribution of carbonate reservoirs worldwide.
The blue areas correspond to carbonate reservoirs.
Primary sedimentation environment and postsedimentation process, like dissolution, mineralization, stylolites, and fracturing, are considered the main factors controlling the carbonate rocks porosity. But the relation between porosity and permeability for carbonate reservoirs is actually poorly defined. Therefore, in many carbonate reservoirs predictive models for reservoir-quality distribution are difficult to generate, resulting in significant uncertainty in hydrocarbon reserve calculations or in reservoirs management planning (Choquette and Pray, 1970; Sarkisyan et al, 1973; Lonoy, 2006; Lucia, 2007).
2. Fractures contribution for reservoirs productivity
The reservoir characterization job aims to build a volumetric model of a reservoir that incorporates all its petrophysics characteristics (e.g. grain size; porosity; permeability). This model is the base to simulate the flow of fluids within the reservoir under different sets of circumstances and find the optimal production techniques that will maximize the production.
Regarding carbonate reservoirs characterization the major challenge is to understand the relation between pore type and porosity and permeability. For the industry, this knowledge has a strong impact on the capability of building predictive models for quality distribution of reservoirs and fluids circulation (Ehrenberg and Nadeau, 2005; Lonoy, 2006; Montaron, 2008). It is common that porosity-permeability cross plots for carbonate reservoirs present a significant variability (Figure 1.3), which demonstrates that factors other than porosity are important on modeling permeability (Lucia, 2007).
(From: Lucia, 2007)
Figure 1. 3. Example of variability in porosity-permeability relationship.
For some authors (Ehrenberg and Nadeau, 2005; Peacock and Mann, 2005; Aguilera, 2006; Montaron, 2008), in addition to the pore-space provided by depositional
conditions and postsedimentation process, the fracturing affect significantly the permeability and the flow of fluids and production rates of reservoirs.
Peacock and Mann (2005) affirm that as carbonate reservoirs get mature, it is increasingly evident the significant role of natural fractures[Appendix, 1.2] in controlling hydrocarbon production and water breakthrough[Appendix, 1.3].
Ehrenberg and Nadeau (2005) noticed that although the fundamental depositional and chemical differences between sandstone and carbonate reservoir rocks seem widely accepted and commonly motivate the adoption of distinct treatment for carbonate reservoirs, the actual nature and magnitude of these differences suffer from little or no quantitative documentation. To address this void the authors analyzed the average porosity versus depth and the average permeability versus average porosity available for 30122 siliciclastic reservoirs and 10481 carbonate reservoirs, covering all petroleum-producing countries, except Canada. From this study they stated that: (i) carbonate reservoirs have a greater relative proportion of high permeabilities at low porosities; (ii) both lithologies include a subordinate group of reservoirs with multidarcy permeabilities at porosities below 15%, which the authors suspect to reflect fracture instead of matrix values; (iii) the relative paucity of low-porosity (0–8%) siliciclastic reservoirs at all depths compared with carbonates may reflect the most common occurrence of fractures in carbonates and the effectiveness of these fractures for facilitating economic flow rates in low-porosity rock.
Aguilera (2006) presents the analysis of the cross-plot average porosity versus weighted mean oil recovery for 5915 pools in Alberta Field (Canada). The data presents a wide variation in porosities and recoveries (Figure 1.4), following the same general idea of Ehrenberg and Nadeau (2005). Based upon this analysis and his own experience on studying many other naturally fractured reservoirs around the World, Aguilera (2006) made some important considerations: (i) the presence of natural fractures in lower porosity carbonates, especially when dolomitized, is probably responsible for the larger oil recovery and the lowest values of water saturation; (ii) low porosity intervals in naturally fractured reservoirs should never be neglected - the use of a porosity cutoff can leave as undiscovered a reservoir that, if tested, could prove to be commercial.
(From: Aguilera, 2006)
Figure 1. 4. Oil recovery versus porosity for 5915 pools in Alberta (Canada).
The high oil recovery in low-porosity reservoirs suggests natural fracturing. Without natural fractures the opposite behavior would be expected.
Montaron (2008) affirms that to take fracturing into consideration is very important for reservoir management, because the permeability along major fracture corridors can be a thousand times greater or more than the surrounding rock matrix. The effects of this increasing in permeability can be positive or negative. The author gives as examples of negative effects the risk of earlier breakthrough and the occurrence of problems during drilling, like mud[Appendix, 1.4] losses. Providing highways for draining the reservoirs is indicated by Montaron (2008) as the most positive effect for the presence of fractured zones.
3. Problem outline
Concerning the key elements controlling the porosity and permeability in carbonate reservoirs the number of publications in Structural Geology is really few, principally if compared to Stratigraphy and Sedimentology.
Anyhow, some reputable experts in the petroleum world consider natural fracturing fundamental to improve permeability and productivity in carbonate reservoirs. They assume this rule to be especially true for low permeability rocks (e.g. chalks) and mature reservoirs. But the real relevance of fractures is not completely clear yet, probably due to the so small amount of published quantitative studies as well noticed by Ehrenberg and Nadeau (2005).
4. Thesis objective
The porosity-permeability ration on carbonate reservoirs is a complex subject. The objective of this study is simply to contribute to the investigation about the actual role of fractures on the carbonate reservoirs permeability. To accomplish this commitment some excellent carbonate rocks expositions of the Jandaíra Formation, occurring close to the Baraúna village (onshore Potiguar Basin, Northeast Brasil), were studied. At this area exist a very well developed cavern system (739m of linear development, achieving 30m of depth) and some minor karstic features, all of them presenting strong evidences of structural control.
The term karst designate a general category of landforms, characterized by numerous closed depressions, caves, collapse features, and diversion of drainage underground. These landforms result from the chemical reaction of slightly acidic groundwater with soluble rocks, such as carbonate rocks (limestone and marble), dolomite (magnesium carbonate), gypsum (calcium sulfate), and some evaporites (Easterbrook, 1999; Burcham, 2009). Easterbrook (1999) affirms that the optimum conditions for karst development include more than just the carbonate rocks mineralogy. According to the author secondary porosity produced by intersecting joint sets play an important role in karst formation, because they permit rocks to hold more water and facilitate groundwater circulation through the system by increasing permeability.
Considering the arguments above I assumed that the karst terrain at the study area represents a good analog to investigate the relation between brittle deformation and the creation of high permeability zones on carbonate rocks. The following steps were taken in this investigation:
1. The information available from earthquake focal mechanisms, breakouts and fracturing testes was compiled to estimate the nowadays state of stresses at the Potiguar Basin (Chapter 2);
2. A multi-scalar lineament analysis was performed to determine the principal structural trends at the Potiguar Basin and at the study area (Chapter 3);
3. Outcrops structural analysis, structural measurements analysis, and information from four seismic lines were used to define the structural regime on the Jandaíra limestones at the study area (Chapter 4);
4. The distribution of azimuth by frequency of the galleries axis of the main cavern was compared with the statistical analysis of structural measurements and the study-area lineaments, to verify if there is any coincidence between the structural trends at the study area and the cavern’s galleries (Chapter 4);
5. In light of all information available, a tectonic-structural model for the study area and a theory to explain the development of the main cavern system were proposed (Chapter
4);
6. Numerical models were employed to examine the reasonability of the theory proposed for the permeability increase in the Jandaíra carbonates (Chapter 5).
All these complementary results support the assumption that the faults and joints observed at the study area led to the formation of high permeability corridors, which conditioned the cavern development. If there were a real hydrocarbon reservoir at that place, a superior productivity zone would possibly be found instead of a cavern system.
C
C
C
C
C
C
C
C
C
C
C
C
hhhh
hhhh
hhhh
aaaa
aaaa
aaaa
pppp
pppp
pppp
tttt
tttt
tttt
eeee
eeee
eeee
rrrr
rrrr
rrrr
2222
2222
2222
T
T
T
T
T
T
T
1. Introduction
In this chapter the main tectonic-structural and stratigraphic characteristics of the Potiguar Basin are presented. The objective is to introduce the non-familiarized reader to the depositional and deformational processes involving the Jandaíra Formation (a Turonian to Campanian tide-dominated carbonatic platform) that were taken in this study as analogue to fractured carbonate reservoirs.
The Potiguar Basin is the easternmost basin at the Brazilian Equatorial Margin (Figure 2.1). It comprises an area of 48000Km2, which is divided in 21500km2 onshore and 26500km2 offshore. The basement of the Basin is composed of Archean-Paleoproterozoic terrains (orthogneisses and metamorphosed supracrustal sequences), marked by polyphase deformation events and a large number of plutonic intrusions, that constitutes the Borborema Province (Almeida et al., 1977). The Fortaleza High defines its limit with the Ceará Basin and the Touros High defines its limit with the Pernambuco-Paraíba Basin (Figure 2.1) (Matos, 1992; Araripe and Feijó, 1994; Pessoa Neto et al., 2007).
(Modified from: Bertani et al., 1991; Mattos, 1992)
The first oil discovery at the Potiguar Basin took place in 1973 on the Ubarana Field (offshore). Ever since more than 4000 wells have been drilled (92% onshore) and more than 115000km of seismic lines were acquired (78% offshore). The interpretation of data obtained from these wells and seismic lines was fundamental to build the actual knowledge about the basin’s lithostratigraphy and structural framework (Bertani et al, 1991; Matos, 1992; Araripe and Feijó, 1994).
2. Tectonic-Structural Development
The Potiguar Basin started to be formed during the early Cretaceous, as a result of the South America/African plates breakup and subsequent South Atlantic opening (Figure 2.2) (Françolin and Szatmari, 1987; Matos, 1992; Cremonini et al., 1996). It is part of an intracontinental rift system that opened from South to North in the southern South Atlantic branch, and from West to East in the Equatorial Atlantic branch (Matos, 1992).
(Modified from: Fainstein et al., 1998)
Figure 2. 2. Schematic chart of South Atlantic opening.
Since the Potiguar Basin is located at the corner between the Southern and Equatorial branches of the Atlantic rift system, it contains important registers for the understanding of the opening processes. But this history is not easy of being
reconstructed and several models have been proposed, as illustrated by the examples of tectonic models below. The most controversial subjects among authors are the stresses orientation during the breakup and the relative movement between the two plates at that time.
Françolin and Szatmari (1987) proposed that during the Neocomian (Rio da Serra to Early Aratu local Stages[Appendix, 2.1]) the South American Plate rotated clockwise relative to the African Plate, with respect to an eulerian pole located at 7oS and 39oW (Figure 2.2). This rotation created a singular stress field, divided into two domains: (i) a E-W compression operating at the tip of rotating South America, pressed against the western African margin (actual Republic of Cameroon); (ii) a N-S extension operating where South America pulled away from the northwest African margin (actual Nigeria). According to these authors, this stress field was responsible for the reactivation of numerous NE-SW and E-W preexisting Precambrian shear zones as strike slip faults. They explain the frequent creation of half grabens on Potiguar Basin as a compensation for the imperfect fit between the blocks laterally dislocated and rotated.
Matos (1992) criticises some previous reconstructions and tectonic models, on which were assumed a rigid plate rotation between South America and Africa (Bullard et al., 1965; Rabinowitz and LaBrecque, 1979; Szatmari et al., 1987; Françolin and Szatmari, 1987), or that recognized the importance of major structural discontinuities during the South Atlantic opening but did not consider in detail nonuniform deformations within the intracontinental Northeast Brazilian rift basins (Popoff, 1988; Unternehr et al., 1988, Conceição et al., 1988). He proposes a model in which is assumed that major kinematic changes occurred during the rift evolution and takes in account the role of major discontinuities within the extensively deformed Proterozoic continental crust. The author argues that during the Neocomian-Barremian (Rio da Serra to Buracica local Stages) the early extensional pulses were oriented toward NW-SE, and during the Barremian-Aptian (Buracica to early Alagoas local Stages) the extensional axis rotated counterclockwise toward a general E-W direction. Based on this model, Matos (1992) suggests that the Paleoproterozoic NE oriented structural trends were reactivated as normal faults and the E-W and NW-SE trends become potential sites for transfer faults and/or accommodation zones.
Cremonini (1993) and Cremonini et al. (1996) recognized an important transfer zone oriented nearly WNW-ESE close to the Ubarana Field, named Ubarana Transfer Zone (Figure 2.1). The authors interpreted this transfer zone as being sub parallel to the
maximum extensional effort. The former was responsible for the reactivation of several NE-SW and E-W structural trends on the Borborema Province as ENE-WSW normal faults and WNW-ESE transfer faults - resulting in the Potiguar Rift implementation during the Neocomian. They proposed a second rifting pulse controlled by an extension E-W, operating from the Barremian to the early Aptian (Buracia to early Alagoas local Stages). Such second pulse is recognized just along the submerse portion of the Basin and is associated with the Equatorial Margin breakup, when the rift stage of Potiguar Basin was aborted and the drift stage began.
From the different reconstructions and tectonic models the fundamental common point is the assumption that the Paleoproterozoic structural grain controlled the Potiguar Rift geometry. But it is still being controversial subjects - that will not be discussed in this thesis - the first relative movement between the South America and African plates (rotation or simple drifting), and the principal stresses direction operating during the breakup and initial rift.
3. Tectonostratigraphy
The Potiguar Basin stratigraphic record (Figure 2.3) is deeply related to its tectonic evolution stages and comprehends three Supersequences: Supersequence Rift; Supersequence Pos-rift; Supersequence Drift (Pessoa Neto et al., 2007).
3.1. Supersequence Rift
The Supersequence Rift, mainly composed by continental sedimentation, is sub-divided into two phases: Rift I and Rift II (Pessoa Neto et al., 2007). The phase Rift I (Neocomian) is characterized by a crustal stretching regime with high rates of mechanics subsidence. Major normal faults were developed at this moment (reaching 5000m of offset) defining asymmetric half-graben and internal highs mostly oriented towards NE-SW. The low areas were filled by lacustrine, fluvial-deltaic and fan-delta deposits that constitute the Pendência Formation (Figures 2.3 and 2.4). The occurrence
of Rift I sediments on the offshore portion of the Basin is limited to an elongation of the emersed rift towards NE (Araripe and Feijó, 1994; Pessoa Neto et al., 2007).
At the phase Rift II (Barremian to Aptian) a strike-slip/transform faulting regime was imposed along the future Brazilian Equatorial Margin, causing a significant changing on the rift’s kinematics. This event moved the rift axis to the immersed portion of Basin while induced the elevation of the emersed portion that becomes the new rift’s bulge and source area. At this moment the direction of tectonic transport changes from NNW-SSE toward E-W, what is interpreted as the very beginning of the continental drift process. The sedimentary register at this phase is dominated by alluvial deposits, fluvial-deltaic deposits, lake sediments, and turbidites, that constitute the Pescada Formation (Figures 2.3 and 2.4). This sequence is limited to the offshore portion of Potiguar Basin (Araripe and Feijó, 1994; Pessoa Neto et al., 2007).
3.2. Pos-rift Supersequence
The Pos-rift Supersequence (Aptian-Albian) was deposited under a relative tectonic quietening regime dominated by thermal subsidence, that followed the end of the rift phase (Pessoa Neto et al., 2007). The Alagamar Formation comprises the lithological register of this stage and is characterized by a gradual transition from the continental to a shallow marine environment, with predominant fluvial-lacustrine deposits (Figures 2.3 and 2.4). This formation was deposited directly against to the top of the rift sequence in a strong angular discordance. Black shales, calcarenites and ostracod limestones (CPT layers; Figure 2.3), deposited in a sabkha environment[Appendix,
2.2]
, correspond to the first evidence of marine transgression on Potiguar Basin (Araripe and Feijó, 1994; Pessoa Neto et al, 2007).
Despite being a quiet tectonic period, at the very beginning of the Pos-rift Supersequence (Early Aptian) there are evidences of a strong structural control on the fluvial deposits at Boa Vista and Guamaré grabens (Figure 2.1). This indicates that some faults from the rift phase have been active until that time (Pessoa Neto et al., 2007).
3.3. Drift Supersequence
The Drift Supersequence (Albian to the Recent) corresponds to the end of the Atlantic opening process. This supersequence is subdivided into Marine Transgressive and Marine Regressive Sequences (Pessoa Neto et al., 2007).
During the Marine Transgressive Sequence (Albian to Campanian) the basin had its less significative subsidence rates and the main depocenter was a large fluvial channel oriented toward NE, passing gradually to a shallow siliciclastic platform. On these environment were deposited the Açu Formation (Figures 2.3 and 2.4) which contains the main hydrocarbon reservoir rocks on the onshore basin, composed by medium to coarse sandstones with layers of shales. At the edge of the siliciclastic platform a carbonate sedimentation (Ponta do Mel Formation) was implanted, while a slope/basin system marked by canyons and associated turbiditic deposits (Quebradas Formation), was developing sideward. The transgression achieved its maximum at the Cenomanian-Turonian limit, being marked by the deposition of a continuous shales sequence (Ubarana Formation) at the immersed portion of Basin and the drowning of the fluvial/estuary system on the emersed portion (Araripe and Feijó, 1994; Pessoa Neto et al., 2007).
Between the Turonian to Middle-Campanian was implanted a tide-dominated carbonatic platform/ramp corresponding to the Jandaíra Formation (Figures 2.3 and 2.4). In this environment the lithologies deposited were calcarenites with bioclasts (planktonic foraminifera, green algae, bryozoans and echinoids), calcarenites with miliolids, calcilutites with bioclasts and calcilutites with bird's eyes (Tibana and Terra, 1981). The deposition of these carbonates marks the end of the Marine Transgressive Sequence (Araripe and Feijó, 1994; Pessoa Neto et al., 2007). Nowadays the Jandaíra Formation crops out in almost all the emersed portion of Potiguar Basin, constituting the largest exposed Cretaceous carbonate platform along the Brazilian continental margin. Apart from its wide area of occurrence the Jandaíra Formation commonly presents intense post-rift deformation, frequently associated to karstification processes, in a tectonic context equivalent to other Brazilian reservoirs. In this way the Jandaíra Formation represents an excellent analog to the investigation proposed in this thesis.
The Marine Regressive Sequence (Campanian to Recent) comprises shallow platform systems (Tibau Formation) with carbonatic edge (Guamaré Formation) and slope to basin system (Ubarana Formation), that are limited from the actual coastline to the offshore region (Figures 2.3 and 2.4). From the Miocene to the Pliocene continental
alluvial sediments were deposited along the coast (Barreiras Formation) being replaced by fluvial and eolian/beach sediments in the Holocene.
(Modified from: Pessoa Neto et al., 2007)
(Modified from: Bertani et al., 1991)
Figure 2. 4. Schematic evolution of Potiguar Basin
As previously said the available information from wells (e.g. samples, cores, logs) and seismic lines were fundamental to build the stratigraphic and structural knowledge about the Potiguar Basin. These data are even more important if considering that from the entire stratigraphic register only the Formations Barreiras, Tibau, Jandaíra, and Açu outcrop at the onshore basin.
4. Magmatism
Three main magmatic events (Figure 2.3) are identified on the Potiguar Basin: (i) Rio Ceará Mirim event corresponds to the occurrence of tholeiitic dike swarms, mostly E-W oriented, intruding the Pre-Cambrian bedrock at the southern edge of the
onshore Potiguar Basin. The age of these dikes was estimated by the Ar/Ar method in 132.2 ± 1 M.y.; or ranging between 130 and 125 M.y. by the K/Ar and Fission Track methods, being related to the basin’s opening process. The occurrence of vulcaniclastic rocks interlayered with the basal Pendencia Formation at the emersed portion of Basin is correlated to this event too (Matos, 1992; Pessoa Neto et al., 2007).
(ii) Serra do Cuó event comprises alkali-basalt overflows outcropping on the south portion of the onshore basin. The age of these basalts was estimated by the 40Ar/39Ar method in 93.1 ± 0.8 M.y. (Souza et al., 2004).
(iii) Macau event occurred as volcanic pulses of ages from 70-65 M.y. to 9-6 M.y., with strongest activities from 48.9 ± 2.9 M.y. to 31.4 ± 1.5 M.y. (Eocene/Oligocene). interlayered to the Marine Regressive Sequence sediments and at some specific regions in the bedrock.
5. Seismology
The seismicity at Northeast Brasil is one of the most important in the country. It occurs mainly on the exposed Precambrian basement around the onshore border of Potiguar Basin and between the Potiguar and Parnaíba basins (Figure 2.5). According to the instrumental registers recorded over the last 40 years, the seismic activity on the region is characterized by low magnitude events (maximum instrumental register mb = 5.2, in Cascavel event; Figure 2.5) tending to occur in swarms that continue from several months to some years (Takeya et al., 1989; Assumpção, 1992; Ferreira et al., 1998; Bezerra and Vita-Finzi, 2000).
It must be noticed that, up to the present time, ground-ruptures caused by earthquakes are not known at the region, even if some events have registered magnitudes over 5.0 (instrumental and historical record), serious damage to buildings have been reported in the last 200 years, and several liquefaction features are observed on Pliocene deposits (Barreiras Formation) and Quaternary continental siliciclastic deposits (Assumpção, 1992; Bezerra et al., 2008; Nogueira et al., 2010).
Another characteristic of seismicity at NE Brasil is that the epicenters usually occur confined among 1-5km depth. Events like the João Câmara earthquake sequence
(event a; Figure 2.5), which had its maximum epicenter depth around 8 to 10km, are very rare (Takeya et al., 1989; Assumpção, 1992; Ferreira et al., 1998).
From the available focal mechanisms instrumental register, the Potiguar Basin exhibits a predominant strike-slip stress regime with some reverse and normal events (Figure 2.5). Ferreira et al. (1998) explains the occurrence of focal mechanisms indicating different stress regimes in a same area as a possible result from different orientations of pre-existing fault planes reactivated under the same uniform crustal stress field. The focal mechanisms also furnished the maximum compressive stress orientations[Appendix, 2.3] through the basin, that ranges from NW-SE to E–W, roughly parallel to the coastline (Assumpção, 1992, 1998; Ferreira et al., 1998; Bezerra and Vita-Finzi, 2000).
(Modified from: Ferreira et al., 1998; Nogueira et al., 2010)
Figure 2. 5. Seismicity at Potiguar Basin area.
On the beach ball diagrams the write zones correspond to compression while the black zones correspond to traction. The focal mechanisms refer to the following events: (a) João Câmara, 1986 to 1988; (b) Açu reservoir, 1990 to 1991; (c) Augusto Severo, 1990; (d) Tabuleiro Grande, 1993; (e) Cascavel, 1994; (f) Palhano, 1989; (g, h) Paracajus, 1980; (i, j) Caruaru, 1991.
6. Present day Stresses on Potiguar Basin
The stress tensor acting at any point on the Earth’s crust can be described by three mutually perpendicular components, σ1, σ2, σ3, which refer respectively to the maximum, intermediate and minimum principal stresses (σ1 > σ2 > σ3). To describe the stress tensor at a point is necessary to determine the orientations and magnitudes of the three principal stresses (Hubbert and Willis, 1957; Bell, 1990).
For the oil industry the knowledge of the operating stresses in a given area is an important parameter for several exploitation and exploration activities. On drilling activities it is strongly recommended to consider the in-situ stress condition since the wellbore design phase (e.g. mud drilling weight programming; calculation of ideal inclination and azimuth for directional wells), to avoid stability problems like unexpected formation fracturing or borehole collapse (McLean & Addis, 1990; Peska & Zoback, 1995; Aadnoy & Bell, 1998). To predict which faults or fracture families behave as seal or as conduits for fluids is fundamental on seeking new targets in a basin (exploration activities) and on planning reservoirs management (exploitation activities). This task is also deeply influenced by the knowledge about the in-situ stresses (Barton et al., 1995; Finkbeiner et al., 1997; Wiprut and Zoback, 2000).
The needed information to estimate the in-situ stresses is usually obtained from ordinary tests and logs performed in wellbores. Even if at first these data are acquired for different purposes, they can be used to detect and measure mechanic phenomenon occurring on the borehole walls as a function of the principal stresses. Breakouts and drilling-induced fractures are well known borehole stress-related failures, commonly used by petroleum geologists and engineers to determine stresses orientation (Zoback et al., 1985; Zoback, 1992; Bell, 1990).
However measuring reliable in-situ stress magnitudes is not easy. With certain simplifying assumptions it is possible to estimate the minimum stress magnitude (σ3) from hydraulic fracturing procedures and other usual fracturing tests (Hubbert and Willis, 1957; Bell, 1990; Aadnoy, 1990; Addis et al., 1998; Brudy, 1998). As in sedimentary basins the topography is usually gentle, the vertical stress (Sv) is generally considered equivalent to the overburden pressure and is calculated by the integration of formation density logs data (Bell, 1990). None of the existing tests or logs is able to measure the magnitude of intermediate principal stress (σ2). Its assessment is possible only by using computer algorithms, which calculate the complete in-situ stress tensor
based on information from borehole failures and rock strength, other than fracturing tests, density logs and formation fluid pressure tests (Peska and Zoback, 1995; Zoback and Peska, 1995).
On the Potiguar Basin Lima Neto, 1998, 1999 and Lima et al., 1997 accomplished the most comprehensive efforts to estimate the present-day stresses based on wellbore data. Lima Neto (1998, 1999) contributed very much to the understanding of Potiguar Basin’s stresses regime based on the analysis of approximately 187 leak-off tests results and 69 hydraulic fracturing data, obtained from the onshore and offshore portions of Basin. Lima et al. (1997) performed a regional scale analysis of breakouts, detected from four-arm dipmeter caliper data available for 541 vertical wells distributed on the Brazilian onshore and offshore basins. As for the Potiguar Basin the authors analyzed 129 wells, of which 65 wells presented enlarged intervals due to the occurrence of breakouts.
6.1. Stresses Orientation on Potiguar Basin
The analysis of breakouts is the most usual method to estimate the orientation of maximum and minimum horizontal principal stresses (SHmax and Shmin respectively). Breakouts are shear fractures induced on wellbore walls, resulting from the principal stresses redistribution around a borehole during perforation due to the substitution of rock by drilling mud (Figure 2.6). In such redistribution a maximum stress concentration is naturally localized in two specific regions around the borehole section, parallel to the Shmin direction (Figure 2.6). If at a given depth the rock strength and the pressure induced by the drilling fluid are not sufficient to compensate the shear stress at these regions, a breakout will occur. As breakouts are aligned to Shmin, determining its direction is the same as measuring the Shmin orientation (Zoback et al., 1985; Bell, 1990; Zoback and Peska, 1995). Once the three principal stresses components are assumed to be mutually perpendicular, the SHmax direction can be automatically obtained at 90o from Shmin (Figure 2.6).
Figure 2. 6. Deformations occurred around the borehole section.
SHmax is the maximum horizontal principal stress; Shmin is the minimum principal stress. Breakouts are shear fractures induced when the pressure of the drilling fluid is not sufficient to compensate the shear stress on wellbore walls. Hydraulic fractures are traction fractures that occurs when the pressure of the drilling fluid overcomes the rock strength and the pressure of the Formation’s fluid (i.e. water; oil; gas).
There are two methods for identifying and measuring breakouts orientation: (i) The caliper analysis of four-arm dipmeter tools, which has two pairs of arms orthogonally arranged (Figure 2.7) and maintained in contact with the borehole walls while the tool rotates and is pulled up from the wellbore button. When a breakout is encountered, one pair of arms becomes trapped and the rotation ceases. At this depth interval the orientation of the largest caliper is recorded as the breakout’s orientation (Plumb and Hickman, 1985; Bell, 1990; Zoback, 1992).
(ii) The image logs are a new technology that allows to observe the failures on borehole walls (breakouts or induced fractures) in a direct manner, enhancing significantly the interpreter’s capability to determine the orientation of principal in-situ stresses (Shmin parallel to breakouts and SHmax parallel to induced fractures). The reliability of breakouts data has also improved with this technology, since it made possible to distinguish without a doubt breakouts from other types of enlargement induced by factors not related to in-situ stresses (Figure 2.7) (Zoback et al., 1985; Peska and Zoback, 1995).
(Modified from the World Stress Map site)
Figure 2. 7. Four-arm caliper tool and types of borehole section enlargement.
Bit size is the borehole diameter planed for a given depth. For World Stress Map (WSM) definition consult Appendix [2.4].
The breakouts data analyzed for the Potiguar Basin by Lima et al. (1997) exhibit a NW-SE to E-W general SHmax orientation, roughly parallel to the coastline (Figure 2.8). This is coincident to the direction indicated by several of the earthquake focal mechanism available for the surrounding area of Basin. According to Mastin (1988), in strike-slip stress regimes the breakouts occurrence is more controlled by the far-field tectonic stresses than by the local stresses near the wellbore. As earthquake focal mechanisms indicate a predominant strike-slip regime through the Potiguar Basin, the hypothesis of Mastin (1988) seems suitable for the area and the SHmax orientation
estimated from breakouts can be considered reliable indicators of the direction of maximum compression through the Basin.
(Source: Lima et al., 1997; Ferreira et al., 1998; Nogueira et al., 2010)
Figure 2. 8. SHmax orientation at Potiguar Basin area.
The focal mechanisms refer to the same events of figure 2.5. The green areas correspond to the regions where the earthquakes that furnished the focal mechanisms occurred.
6.2. Stress Regime on Potiguar Basin
Several operations in the petroleum industry involve the formation fracturing at given depth intervals of interest. Fracturing tests (e.g. leak-off test; extended leak-off test) are routinely used in drilling activities, to evaluate the maximum pressure of drilling fluid (mud weight) which can be withstand by the formation in the next hole phase (Ervine & Bell, 1987; Addis et al., 1998). The hydraulic-fracturing is a well-known technique used to enhance the production on low permeability reservoirs (Hubbert and Willis, 1957; Brudy, 1998). All these methods involve isolating a section of the borehole over a known depth interval, with inflatable packers, and then increasing the pressure within the interval by pumping in fluids until they induce a fracture in the
surrounding rocks. The pressure at which this occurs, named instantaneously shut-in pressure, is considered equivalent to the in-situ minimum principal stress (Hubbert & Willis 1957; Ervine & Bell, 1987; Bell, 1990).
The studies performed by Lima Neto (1998; 1999) for the Potiguar Basin show a predominant strike-slip stress regime. The author also observed a secondary reverse stress regime, appraised from the shallowest available data (between 313 and 2500m depth) and from data deeper than 3700m (these obtained offshore). At these depths the registered shut-in values (taken as equivalent to Shmin magnitudes) are very close to the calculated Sv values at the same depth interval.
Again, the results obtained from wellbore data corroborate the nowadays stress pattern indicated by the earthquake focal mechanisms.
Summary
The Potiguar Basin was implemented at early Cretaceous, in the context of the South America/African plates breakup and the subsequent opening of the South Atlantic. The stratigraphic record at Potiguar Basin is deeply related to its tectonic evolution.
The present knowledge about the lithostratigraphy and tectonic-structural evolution of Potiguar Basin results from the analysis of data obtained from petroleum wells and seismic lines. These data were fundamental to build this knowledge, since just the Barreiras, Tibau, Jandaíra, and Açu Formations outcrop in the the onshore portion of the Basin.
Nowadays the stress regime operating through Potiguar Basin is predominantly strike-slip, with some minor reverse and normal events. The maximum compressive stress orientation through the Basin ranges from NW-SE to E–W, roughly parallel to the coastline. This information was obtained from available earthquake focal mechanisms and from specific tests and logs performed on hydrocarbon wellbores.
The Jandaíra Formation is a Turonian to Campanian tide dominated carbonatic platform that crops out in almost all the emersed portion of Potiguar Basin. It presents intense
Post-rift deformation, frequently associated to karstification processes, in a tectonic context equivalent to other Brazilian reservoirs. Because of this it was used on this thesis as analogue to naturally fractured carbonate reservoirs.
C
C
C
C
C
C
C
C
C
C
C
C
hhhh
hhhh
hhhh
aaaa
aaaa
aaaa
pppp
pppp
pppp
tttt
tttt
tttt
eeee
eeee
eeee
rrrr
rrrr
rrrr
3333
3333
3333
L
L
L
L
L
L
L
1. Introduction
For more than a century the observation of linear patterns in the topography has been attracting the attention of geoscientists (Wise, 1982; Wise et al., 1985). At the very beginning of the 20th century “german writers” established the expression “tektonische linien” to describe rectilinear features correlated to planes of faults or joints (Hobbs, 1904; page 485 – author’s note). But this definition was insufficient to explain the origin of all aligned elements observed in the topography, principally considering how difficult it was to establish the correct observation perspective by only using terrain investigation methods. Because of this, Hobbs (1904) opted to use the term lineament to describe “(…) nothing more than a generally rectilinear earth feature”.
The development of the aircraft-derived images between the two World Wars (Figure 3.1) and the development of the satellite-derived images during the 1950’s, revealed how surprisingly frequent and pervasive are the aligned features on the Earth’s surface, achieving lengths of tens to hundreds of kilometers (Wise et al., 1985; Liu, 2007).
Figure 3. 1. – San Andreas Fault from aircraft-derived image (1936).
This image shows the Elkhorn Scarp, San Andreas Fault Carrizo Plain, close to San Luis Obispo Co., CA. (http://web.whittier.edu/fairchild/san_andreas.html).
With the improvement of imagery technology the concept of lineaments improved too. Today the term lineament is applied to any mappable linear topographic features which constitute the expression of tectonic-structural processes and/or crustal stresses
on the Earth’s surface (Wise et al., 1985; Jordana & Schottd, 2005; Pradhan, et al., 2006; Rahiman & Pettinga, 2008).
Despite the significant amount of satellite images available nowadays, attesting unequivocally the lineaments’ existence, the analysis of lineaments is still one of the most controversial subject on the modern structural geology. The main reason for such controversy is the inefficiency of traditional field methods in matching at outcrop scale the aligned features observed on images. It is due to a natural limit imposed by the scale variation, that produces different perception about the existing elements (Figure 3.2). Furthermore, unequivocal information about the lineaments’ age, tectonic settings, and stress fields responsible for their origin are usually lacking (Wise et al., 1985).
Figure 3. 2 – Lineaments perception from different scales.
These images refer to the Andes Range central part, in Bolivia, at the Pacific Margin of South America. In the image (a) it is possible to observe many topographic aligned features but it is not possible to individualize any specific structure, which can be described as the original Hobbs’ concept of lineament: “(…) nothing more than a generally rectilinear earth feature”. The yellow rectangle indicates the area from which was obtained the image (b). On (b) it is already possible to individualize several geomorphologic, structural and stratigraphic aligned elements (e.g., valleys; drainage channels; faults; beddings). Despite the high resolution image allows us to see perfectly the regional structures, it is not certain that it will be possible to identify all single elements on the terrain.
On the other hand the detection and analysis of lineaments and lineament domains (i.e. clusters of lineaments oriented along preferential directions) is an ongoing subject of interest for science, industry, and society. It has been considered a practical and economically advantageous tool when investigating large areas, or regions where conventional field mapping techniques of structural geology are impractical due to difficult approach conditions or limited amount of outcrops. In these circumstances the use of lineaments information can reduce significantly the risks, costs, and time involved in a given project (Solomon & Ghebreab, 2006; Rahiman & Pettinga, 2008).
Several studies using lineament data derived from multiple sets of remote sensing imagery, mapping them at local and regional scales, as well as linking lineaments to detailed field mapped structures, have been providing a better comprehension about the structural and tectonic evolution in many areas worldwide (Jordana & Schottd, 2005; Solomon & Ghebreab, 2006; Rahiman & Pettinga, 2008). The results of these studies find useful applications on: (a) improving hazard analysis on landslide prone areas (Pradhan, et al., 2006); (b) seismic or volcanic active regions (Arellano-Baeza et al., 2006); (c) groundwater exploration (Onyedim & Norman, 1986; Masoud & Koike, 2006; Gleeson & Novakowski, 2009); (d) mineral exploration (Onyedim & Norman, 1986; Balaji & Ramasamy, 2005; Masoud & Koike, 2006); (e) oil and gas exploration (Babcock & Sheldon, 1976; Onyedim & Norman, 1986; Guo et al., 1999; Masoud & Koike, 2006).
2. The use of lineaments analysis on this thesis
As it was explained on Chapters 1 and 2, the Jandaíra Formation was adopted in this thesis as the analogue to fractured carbonate reservoirs for its plenty exposition on the Potiguar Basin and its tectonic context equivalent to other carbonate reservoirs along the Brazilian margin. However, the common occurrence of karstic processes on Jandaíra Formation (Figure 3.3) often makes the structural analysis a very complicated task. The principal problems caused by the karstic framework are: (i) the access to the outcrops is difficult, exhausting, and moderately danger; (ii) the high density of non-tectonic fractures associated to the karst usually obliterate the tectonic fractures, making it
difficult to observe the continuity and relationship of structures from the terrain point of view.
Figure 3. 3. Karstic fabric at the study area.
Great part of the blocks seen on the image is mobile - they easily rotate and tilt when a person step on -, making difficult to walk and increasing the risk of serious injures in case of tumble. It is possible to distinguish long and aligned holes, but is very difficult to individualize joint or fault plains to measure.
Due to these adverse conditions for fieldwork, the structural analysis of outcrops has become a very difficult task. To overcome this difficulty a multi-scale analysis of lineaments was done: (i) outcrop-scale lineaments (i.e. local-scale) were extracted from satellite high resolution images, available in Google Earth Pro (resolution 0.6 m); (ii) basin-scale lineaments (i.e. regional-scale) were extracted from SRTM3[Appendix, 3.1] data (resolution 90 m). The objective was to obtain a broad perspective about the distribution of structural trends in local and regional scales. From this understanding was possible to verify the interdependence between the deformational events imprinted on the Basin and the study area.
3. Lineaments detection methods
The most usual method to detect topographic lineaments is the manual tracing, based on human interpretation. However this technique is not completely reliable due to conditional factors like experience, knowledge about the area, and mood. These factors may affect the interpreter’s capability on detecting lineaments, resulting in the introduction of bias in the database (Wise et al., 1985). This risk is another source of disagreement involving the use of lineament data in studies of structural geology.
To overcome this problem, with the increasing use of synthetic images, in recent years some computer programs have been developed to automatically detect lineaments. These algorithms allow to obtain lineaments exempted from the interpreter’s influence and save time when the study area is too large or contains too many details (Wise et al., 1985; Raghavan et al., 1995).
Another technique that improves significantly the work of lineaments detection in both manual and automatic methods is the variation of lighting condition. On synthetic images this is done by the variation of the azimuth and elevation angles of the simulated (i.e. numerical) illumination source (Wester and Lundén, 1996).
3.1. Lighting condition
The lighting applied to a given image affects the orientation and the area of the shadow zones as a function of the topography represented in this image. Basically the shadow technique (Wise, 1969) allows to decrease the variation of the grey levels according to the simulated light azimuth and elevation angles, resulting in a pronounced minimum in the strike diagram of the recognizable lineaments (Wise et al., 1985).
The fundamental effect of this technique is the relative enhancing or attenuation, up to vanishing, of the lineaments directions. This means that the aligned features on a synthetic image became more evident as more perpendicular they are to the light direction (Figure 3.4). On the other hand, the features aligned parallel or nearly parallel to the direction of illumination became less evident on the image (Figure 3.4).
Figure 3. 4 – Lighting effect on topography image.
The pale blue line represents the general limit of the Basin’s onshore portion. The yellow sun and arrow symbols show the light direction applied on each image: (a) azimuth N0o and elevation 10o; (b) azimuth N45o and elevation 10o; (c) azimuth N90o and elevation 10o; (d) azimuth N135o and elevation 10o. The orange rectangle individualizes a linear NE topographic feature, that is evident on images (a), (c) and (d) but almost disappears on image (b) where the light is nearly parallel to this aligned element.
Another interesting piece of information that can be estimated when varying the light condition on a same image is the relative age of tectonic activity. Assuming that active or recent tectonics usually creates relief faster than erosion smooths it, lineaments related to the youngest tectonic pulse are supposed to be longer and narrow than the previous (P. Cianfarra and F. Salvini oral communication). The result is a reduced scattering on lineaments azimuth measurements (Figure 3.5).
In this way the most frequent lineaments direction appearing under different lightings for the same image is considered indicative of the more recent or more penetrative tectonic activity.