UNIVERSITA DI BOLOGNA
SCHOOL OF ENGINEERING AND ARCHITECTURE
Department of Civil, Chemical, Environmental and Materials
Engineering
(DICAM).
MASTER’S THESIS DEGREE IN CIVIL ENGINEERING
THE IMPACT OF THE COVID-19 PANDEMIC ON
TRANSPORTATION IN METROPOLITAN CITIES AND OUTLINING
MEASURES THAT COULD HELP BUILD RESILIENCE AND
SUSTAINABILITY: A CASE STUDY – BOLOGNA.
Supervisor: Professor Joerg Schweizer Candidate: Sam Kwabena Asamoah
Yeboah
Student ID: 0000901847
i
ACKNOWLEDGEMENT
I wish to express my profound gratitude to God, who throughout this entire degree has been my rock and solid foundation. I would not be at this point in my life if not for Him.
I am excited to acknowledge my supervisor, Professor Joerg Schweizer for his patience and support for me during the entire preparation of this thesis. The entire academic staff on the Transportation unit under the Department of Civil, Chemical, Environmental and Materials Engineering (DICAM) are also well acknowledged.
A special thanks to Prof. Alberto Montanari and Prof. Cesare Sangiorgi as well as my mentor Olukayode Alao for their continuous support and guidance. My sincere gratitude to my family especially for all the love and support throughout this journey. I thank my friends for their continued love, support and encouragement during my stay in Italy.
I finally dedicate this work to my late father, Prof. Sam Kwesi Yeboah who would have wished that I obtained this degree.
ii
ABSTRACT
One of the most impacted sectors of the COVID pandemic was the mobility industry, with passenger and freight transport being adversely affected. This dissertation investigates the impacts of the COVID-19 pandemic on mobility considering a study case of Bologna by analysing readily available data of public transportation (buses), vehicle and cyclist flows collected from manual passenger counts, automatic traffic and cyclist counters respectively. The timeline of the study was split in to four phases covering periods before the pandemic occurred, during the first lockdown, immediately after lockdown restrictions were lifted and post-lockdown stages. Additional data was obtained from the open access data provided by Moovit app on the usage of mobility options during the timeframe of the study. Analysis on data for the modes considered included weekly trip comparisons from 2019 and 2020, comparisons of usage during phases of the study, modal comparisons considering modal shares and percentage changes observed. Measures (policy and infrastructure wise) enacted by local government authorities in Bologna prior and during this pandemic are also examined considering the role of sustainability and resilience building. Results obtained from the case study as well as policies being employed are compared to other metropolitan cities to identify some similarities and differences to establish conclusions with recommendations suggested. It is found that Bologna experienced an overall mobility reduction of 76%, 18% and 0.5% during the phases 2, 3 and 4 respectively. Additionally, cycling was the only mode to surpass its initial levels from Phase 1 in Phase 3, showing 31% and 40% increases in usage in Phases 3 and 4. Public transportation (buses) was the most impacted during Phase 2 experiencing about 90% decrease in usage. Private transport (vehicle use) showed the most resilience reaching figures (101.4%) in Phase 4 almost identical to that recorded before the lockdown. This study recommends that policymakers should direct attention to improving active travel modes since they would play a significant role in the transport choice of users.
iii
TABLE OF CONTENTS
CHAPTER 1 – INTRODUCTION ... 1
1.1. BACKGROUND ... 1
1.2 RESEARCH GOAL AND OBJECTIVES ... 3
1.2.1 Research Questions ... 4
1.3. THESIS STRUCTURE/OVERVIEW ... 4
CHAPTER 2 - LITERATURE REVIEW ... 6
2.1 INTRODUCTION ... 6
2.2 TRANSPORTATION AND PANDEMICS ... 7
2.3 IMPACTS OF COVID ON TRANSPORTATION (A METROPOLITAN CITY CONTEXT) ... 10
2.3.1 Effects on Mobility ... 10
2.3.2 Effects (Metropolitan city context) ... 12
2.4. SUSTAINABILITY AND RESILIENCE BUILDING POST-COVID ... 13
2.5. RESEARCH GAP ... 16
CHAPTER 3 – METHODOLOGY ... 18
3.1. STUDY AREA ... 18
3.2. DATABASES ... 20
3.2.1 Bicycle Flow Count ... 21
3.2.2 Passenger Count in Buses ... 23
3.2.3 Vehicle Traffic Count ... 25
3.2.4 Auxiliary Data ... 26 3.3. TIMEFRAMES... 27 3.4. RESEARCH APPROACH ... 28 3.4.1 Cyclist Flows ... 28 3.4.2 Bus Flows ... 30 3.4.3 Vehicle Counts ... 33 3.4.4 Moovit ... 34 3.5. MODAL COMPARISONS ... 34 CHAPTER 4 – RESULTS ... 38 4.1 BICYCLES ... 38
4.1.1 Weekly Trips Comparisons ... 38
4.1.2 Timeframe Comparison ... 41 4.2 BUSES ... 42 4.2.1 Line 13 ... 42 4.2.2 Line 20 ... 44 4.2.3 Line 27 ... 46 4.3 VEHICLES ... 48 4.4 MODAL COMPARISONS ... 51 4.4.1 Modal Share ... 51 4.4.2 Percentage Change ... 52
CHAPTER 5 - DISCUSSIONS AND ANALYSIS ... 55
iv
5.2 COMPARISONS WITH OTHER STUDY CASES ... 58
5.2.1 Stockholm Case Study ... 58
5.2.2 Santander Case Study ... 60
5.2.3 Other Study Cases ... 61
5.3 URBAN MOBILITY PLANS AND COVID ... 65
5.3.1 Phase 1 (PRE COVID) ... 65
5.3.2 Phases 3 & 4 (Post Lockdown Measures) ... 67
5.4. FUTURE OF URBAN MOBILITY (POST-COVID) ... 71
5.5 LIMITATIONS OF THE STUDY ... 76
CHAPTER 6 - CONCLUSIONS AND RECOMMENDATIONS ... 77
REFERENCES ... 80
ANNEX ... 88
ANNEX 1 – BUS COUNTS AND FIGURES. ... 88
ANNEX 2 – VEHICLE COUNTS AND FIGURES ... 92
v
LIST OF TABLES
Table 3.1 Number of COVID-19 cases recorded in provinces of Italy………18
Table 3.2 Number of COVID-19 cases recorded in cities in Emilia-Romagna Province. ………..19
Table 3.3 Yearly total bicycle lane length……….20
Table 3.4 Pathways of bus lines considered for study. ………..23
Table 3.5 Sums of daily flow counts for each phase. ………..30
Table 3.6 Comparisons of sums of passenger counts on count days. ……….32
Table 3.7 Comparison of vehicle counts from selected traffic counters during timeline of the study. ………33
Table 3.8 Relative change of mobility trendline during timeline of the study (MOOVIT APP)….34 Table 3.9 Sum of daily cyclist counts during timeframe of study. ……….35
Table 3.10 Sum of bus counts for each phase in the timeframe of the study. ………35
Table 3.11 Sums of counts for vehicles during the timeline of the study. ……….36
Table 3.12 Comparisons of sums of counts recorded for each mode with respect to the timeline of the study. ……….37
Table 4.1 Weekly comparison of sum of bicycle counts in last weeks of April for 2019 and 2020. ………38
Table 4.2 Weekly comparison of sum of bicycle counts in second weeks of June in 2019 and 2020. ……….39
Table 4.3 Weekly comparison of sum of bicycle counts in the first weeks of September in 2019 and 2020. ………40
Table 4.4 Weekly comparison of sum of bicycle counts in the second weeks of October in 2019 and 2020. ………40
Table 4.5 Sum of flow counts during the timeframe of the study………..41
Table 4.6 Bus line 13 with the averages of the number of people who boarded on the respective dates. ………43
Table 4.7 Averages of passengers who boarded on count days……….43
Table 4.8 Averages of the number of people who boarded Bus line 20 on the respective count dates. ………45
Table 4.9 Averages of passengers who boarded on count days. ………45
Table 4.10 Bus line 27 with the averages of the number of people who boarded on the respective dates. ………47
Table 4.11 Averages of passengers who boarded on count days………..47
Table 4.12 Selected counters and the flows recorded during the timeframe of the study……. 49
Table 4.13 A summary of the sum of the counts recorded by selected counters during the phases. ……….49
Table 4.14 Variations in modal splits during the timeline of the study. ………51
Table 4.15 Trendline changes in usage of mobility options across the different phases……….52
Table 4.16 Overall mobility usage reduction in subsequent phases with respect to Phase 1…53 Table 4.17 Percentage changes recorded for each phase with respect to the previous phase. ………..………..……….53
vi
Table 5.1 The correlation between distance and possible transportation choices ………..………..………..………..73
vii
LIST OF FIGURES
Figure 3.1 A map showing the various types of transportation infrastructure in Bologna. .... 19
Figure 3.2 Instruments used for monitoring bike flows in Bologna (2017). ... 21
Figure 3.3 Instruments used for monitoring bike flows in Bologna. ... 22
Figure 3.4 An example of a counting device. ... 22
Figure 3.5 Locations of permanent counting stations owned by the commune of Bologna (Google Maps). ... 23
Figure 3.6 Pathway of bus line 27(Google Maps). ... 24
Figure 3.7 Pathway for bus line 13(Google Maps)... 24
Figure 3.8 Pathway for bus line 20(Google Maps) ... 25
Figure 3.9 Geographical locations of traffic counters in central Bologna. ... 26
Figure 3.10 Research methodology ... 28
Figure 3.11 Number of weekly cyclist counts recorded from April 2019 to October 2020. ... 29
Figure 3.12 A comparison of the first weeks in September for 2019 and 2020. ... 29
Figure 3.13 Counts for passengers boarding bus line 27. ... 30
Figure 3.14 Counts for passengers remaining on board using bus line 27 ... 31
Figure 3.15 Trendline of mobility usage in Bologna during the 2020 year (MOOVIT APP). .... 34
Figure 4.1 Weekly comparison of sum of bicycle counts recorded in fourth weeks of April in 2019 and 2020. ... 39
Figure 4.2 Weekly comparison of sum of bicycle counts recorded in first weeks of June in 2019 and 2020. ... 39
Figure 4.3 Weekly comparison of sum of bicycle counts recorded in first weeks of September in 2019 and 2020. ... 40
Figure 4.4 Weekly comparison of sum of bicycle counts recorded in second weeks of October in 2019 and 2020. ... 41
Figure 4.5 Average bicycle counts recorded during the timeframe of the study. ... 42
Figure 4.6 Number of passengers who boarded the bus line at each bus stop on the count days for Line 13. ... 44
Figure 4.7 Number of passengers who boarded the bus line at each specific bus stop on the count days. ... 46
Figure 4.8 Number of passengers who boarded the bus line at each specific bus stop on the count days. ... 48
Figure 4.9 Trendline of vehicle counts along timeline of study... 50
Figure 4.10 Comparison of vehicle counts recorded by selected counters on chosen dates. .. 50
Figure 4.11 Modal share of mobility in Bologna (2007). ... 51
Figure 4.12 Modal share during timeline of the study. ... 52
Figure 4.13 Graphical illustration of the percentage changes of mobility choices during the study. ... 53
Figure 5.1 Modal split and percentage change of bicycle use during the study... 55
Figure 5.2 Modal split and percentage change of bus use during the study. ... 56
viii
Figure 5.5 Road traffic recorded in some sections in Stockholm in 2020. ... 59
Figure 5.4 Bike flows recorded in Stockholm in 2020, relative to that recorded in 2019. ... 59
Figure 5.6 Public transport usage in Stockholm recorded in 2020 relative to averages recorded in 2019 ... 59
Figure 5.7 Public transport usage before and after lockdown restrictions.. ... 60
Figure 5.8 Modal share in Santander before and after the lockdown measures ... 61
Figure 5.9 Modal share of mobility in Bologna before and after the lockdown measures. .... 61
Figure 5.10 Change in Traffic of transportation modes in the UK, relative 2019/2020. ... 62
Figure 5.11 Mobility trends in Italy (Teralytics). ... 63
Figure 5.12 Usage of long-distance transport modes. ... 64
Figure 5.13 Average trip distance. ... 64
Figure 5.14 Targets outlined to be achieved according to the SUMP... 66
Figure 5.15 Measures employed in Bologna according to the Emergency Plan. ... 68
Figure 5.16 Safety and Affordability of Different Modes. ... 69
Figure 5.17 Metropolitan of Bologna cycling plan in 2020. ... 70
1
CHAPTER 1 – INTRODUCTION
1.1. BACKGROUND
The COVID-19 (also known as coronavirus) outbreak started in December 2019 in Wuhan, China, and rapidly spread in many countries all over the world (e.g., Jiang et al., 2020; Lipistch et al., 2020). In March 2020, the World Health Organization declared the outbreak as a pandemic, with countries such as China, Italy, Spain and the US being hit hardest. The virus's incubation period of 2–10 days afforded ample opportunity for infected but asymptomatic travellers to export infection undetected across international borders and propagate transmission in receiving communities. By the end of May 2020, the virus (and the COVID-19 disease it causes) had spread to most countries on earth. By June 1st 2020, the WHO reported that over 6 million people had been infected worldwide and over 371,000 had died with COVID-19 (WHO, 2020).
Passenger transport within the EU Member States and between the European Union and the rest of the world were partially or entirely closed. On March 17, 2020, for the first time in its history, the European Union closed all its external borders to prevent a further spreading of the virus (European Commission 2020). This decision to temporarily restrict all non-essential travel was by no means uncontroversial, although it was very much in line with the mitigation strategies of most of the local governments: Italy introduced a national lockdown on March 9, Germany implemented school and border closures starting March 13, Spain followed on March 14, and France on March 16. By 18 March, 2020, more than 250 million people in Europe were in lockdown (European Commission 2020). Overall, the transport sector has been hit hard by the impact of COVID-19. Both passengers transport and freight suffered severe setbacks from the COVID19 crisis.
Many countries took drastic steps, such as closing schools, stores, restaurants and bars, restricting public gatherings, and stimulating or forcing work from home, to avoid social interaction and slow down the spread of the virus. These measures could all be labelled as “social distancing”, and are especially efficient for diseases (such as COVID-19) which are transmitted by respiratory droplets and require a certain proximity of people (Wilder-Smith and Freedman, 2020). Transportation systems which allow the physical movement of, and enable contact among, many different people provide an enabling environment for contagion spread (Browne, A. et al, 2016). Hence in effect, travel restrictions were implemented. Several
2
papers have looked to quantify the impact of these travel restrictions on transmissibility reductions of the virus (Fang, Wang, & Yang, 2020; H. Liu et al., 2020a). Almost immediately, people changed their daily routines and altered their household mobility and consumption patterns.
Travel demand consequently dropped due to an increased amount of working from home, e-learning, and a reduced number of public activities and events. This resulted in less car traffic – and less congestion during peak hours – and in reduced public transport ridership as well as influenced travel mode choice. Restrictions on transport also coincided with record temporary reductions in noise, road accidents and air pollution (Mahato et al. 2020, Tobias et al. 2020, Liu et al.). In Europe, passenger air traffic fell by as much as 90% (Eurocontrol, 2020) while the number of passengers using public transport declined by 80% in some cities as commuter demand evaporated and transport operators reduced their services (Bernhardt, 2020). Road transport faced several problems as well, and its efficiency plumbed. In the UK, road traffic volumes fell by as much as 73% to levels not seen since the mid-1950s as private cars remained on driveways and people adhered to government advice to remain indoors (Carrington, 2020).
In Italy, restrictions were initially applied more restrictively than other states except for China. The northern regions of Italy implemented these restrictions through the creation of limited zones called Red Zones (Zona Rossa). These measures were subsequently extended nationwide on 9 March. In these areas, movement to and from places was banned except for work, needs, and health emergencies. All sporting events and public meetings were banned, and schools, universities, and recreational facilities were closed. During the first weeks of the pandemic, Italy registered over 7300 confirmed infections, of which 366 resulted in deaths. On 11 March, restaurants and bars were closed. After 12 March, the Italian government banned all travel and forced people to stay at home. On 20 March, parks, gardens, and playgrounds were closed as well. Industries producing essential goods as well as non-essential services were closed on 22 March.
Lockdown measures were gradually lifted in Europe member state countries in the period from May till July of 2020; with each member country adapting specific measures to fit their situations internally. Post the pandemic, social distancing looks likely to be a part of measures in place till the near future. In terms of mobility, the role of active travel has gained prominence concurrent with the change in individual travel behaviour. Policymakers and
3
transport planners are attempting to meet this demand by permanently (and in some cases temporarily) allocating less-used street space to cyclists and pedestrians (King and Krizek, 2020), especially at places that were previously affected by traffic congestion and did not have adequate walking and cycling infrastructure. Cities in Europe (e.g., Berlin, Vienna), North America (e.g., Philadelphia, Vancouver), and Latin America (e.g., Bogota, Mexico City) are examples of such government led interventions (Laker, 2020).
This study investigates the effects of the COVID pandemic on mobility in metropolitan cities using a case study of Bologna, the capital of the Emilia Romagna province in Italy. Public transportation data from passenger counts in buses, cyclist counts and traffic counts from major parts of the city would be analysed. Further analysis would be conducted to look at a how the pandemic has influenced the modal choices of people post COVID. It compares COVID-19 with other health risks, examines and compares policy and infrastructural changes which have been put into effect post COVID. It also recommends ways by which metropolitan cities could shape mobility plans for the future while prioritising resilience.
1.2 RESEARCH GOAL AND OBJECTIVES
The focal goal of this thesis is to research the impacts of the COVID pandemic on transportation in metropolitan cities by analysing data using a study case of Bologna. The following objectives are the driver of this thesis:
i. an analysis of data obtained from passenger in buses counts, traffic counts and bicycle count before and after the pandemic to demonstrate empirical evidence of the impacts, ii. a background study would be conducted via a literature review into the pandemic and it’s impacts in other places in the world (Italy, Europe and worldwide),
iii. The scope of this study would extend beyond a look at the obvious negative impacts of the pandemic on transportation but would also be focus on resilience and sustainable building going forward
iv. This study would also look at post-pandemic measures that are being implemented in Bologna in the transportation sector and make a comparison with other metropolitan cities (infrastructure and policy wise), and
v. outlining suggestions that could be implemented to improve efficiency and safety in the transportation sector at the metropolitan level.
4
1.2.1 Research Questions
To successfully meet the research objectives, suitable research questions must be asked and answered. These questions would further be grouped respectively according to a timeframe with respect to the pandemic. Below are the research questions for this study:
PRE
a. What was the outlook of the transportation prior to the pandemic? DURING
a. How did the pandemic affect transportation/mobility in Bologna? b. What were the impacts; on modes of transportation?
POST
a. What kind of data do we have access to indicate the impacts of the pandemic on transportation?
b. What kind of analysis can we conduct on the data and what can we infer from the results?
c. If possible, can there be access to data which indicates the shift of personal choices towards specific transportation modes?
d. What kind of measures are being taken in specific modes of transportation (case study and globally)? For example, in public transportation
e. How effective have these measures been? A look at both the good and bad examples f. How economic and environmentally viable are these measures?
g. How are these measures equating to building resilience and sustainability going forward?
1.3. THESIS STRUCTURE/OVERVIEW
To meet the set objectives of this research, different tasks were undertaken. These tasks are grouped according to chapters as shown below:
Chapter 1: Introduction
The background of the research, objectives and an overview of the thesis are covered in this chapter.
Chapter 2: Literature Review
The extensive literature study that was carried out on the effects of the COVID-19 pandemic globally, impacts socially, economically and environmentally globally. with. This section
5
begins with an overview of the pandemic, a look at its timeline and background and then discusses its effects. The impacts on mobility/transportation on a metropolitan city context is highlighted, and an in-depth review of literature on measures (on an infrastructure and policy level) that are being implemented globally in metropolitan cities post-pandemic in the transportation sector. It concludes with a summary of the research gap this study seeks to address.
Chapter 3: Methodology
The preferred method for obtaining data, process followed for data collection, and techniques for analysing data are discussed in this chapter.
Chapter 4: Results
Data generated from the research is presented in this chapter.
Chapter 5: Analysis and Discussion of Results
This chapter comprises detailed analysis and explanations of the results obtained from the chosen research methods. The basis for the recommended framework is discussed as well.
Chapter 6: Conclusions and Recommendations
The research effort is summarized in this chapter. Conclusions that can be drawn from the study are presented as well. The limitations of the research, recommendations, and areas for further study are also discussed.
6
CHAPTER 2 - LITERATURE REVIEW
2.1 INTRODUCTION
The COVID-19 (also known as coronavirus) outbreak officially started in December 2019 in Wuhan, China, and rapidly spread in many countries all over the world (Jiang et al., 2020; Lipistch et al., 2020, Wang et al.,2020). In March 2020, the World Health Organization declared the outbreak as a pandemic, with countries such as China, Italy, Spain and the US being hit hardest. By the end of May 2020, the virus (and the COVID-19 disease it causes) had spread to most countries on earth. By June 1st 2020, the WHO reported that over 6 million people had been infected worldwide and over 371,000 had died with COVID-19 (WHO, 2020). Earlier studies related to pandemics are more commonly seen in regard to the spread of flu or flu-like diseases such as the outbreak of Ebola in west Africa (Kucharski & Edmunds, 2014; Valencia et al., 2017) and the SARS pandemic (Graham, Donaldson, & Baric, 2013; Stadler et al., 2003). However, a study examined the national pandemic plans of some countries in Europe and evaluated how each of them were prepared for a potential outbreak of a pandemic influenza (Mounier-Jack & Coker, 2006). The following studies have also considered different aspects of the COVID-19 virus during its emergence such early transmission dynamics (Li et al., 2020), epidemic in other countries outside China (Holshue et al., 2020), the impact assessment (Munster et al., 2020), the forecasting of the spread (Wu, Leung, & Leung, 2020) as well as the genomic characterization (Lu et al., 2020).
On March 17, 2020, for the first time in its history, the European Union closed all its external borders to prevent a further spreading of the virus (European Commission 2020). The decision to temporarily restrict all non-essential travel was by no means uncontroversial, although it was very much in line with the mitigation strategies of most of the local governments: Italy had introduced a national lockdown on March 9, Germany had implemented school and border closures starting March 13, Spain followed on March 14, and France on March 16. By 18 March, 2020, more than 250 million people in Europe were in lockdown (European Commission 2020). These non-pharmaceutical interventions (NPIs) such as travel bans, school, and public transport closure, restriction on public gathering, stay-at-home order) were widely adopted by governments all over the world as this seemed to be the only way to slow down the spread of the virus(Ferguson et al., 2020).
7
Italy, as the first country in Europe to be infected as well as one of the most severely impacted by the pandemic, had studies conducted into the transmission of this virus. A study conducted by Murgante et al., attempted to investigate why the reasons why Italy was the first to be infected in Europe and what conditions could have influenced the quick spread of the virus throughout the country(Murgante, Borruso, Balletto, Castiglia, & Dettori, 2020). In another study, the epidemic risk was assessed by identifying the most vulnerable areas using a historical data series on air pollution, human mobility, winter temperature, housing concentration, health care density, population size, and age (Pluchino et al., 2020). By comparing the spatial distribution and mortality model associated with COVID-19 in Italy with various geographical, environmental, and socioeconomic variables at the provincial level, a correlation was found between the number of COVID-19 cases and the associated pollutants nitrogen and soil, especially in the Po Valley area. Both studies revealed that the highest risk occurred in some northern regions compared to central and southern Italy. Although the COVID-19 epidemic started almost simultaneously in both the north (Lombardy and Veneto) and in Lazio (central Italy) when the first cases were officially certified in early 2020, the disease spread more rapidly and with more serious consequences in regions with a higher epidemic risk.
As expected, the impacts of COVID-19 on the global economy have been unrivalled in history and researchers have investigated this (Abodunrin, Oloye, & Adesola, 2020; Igwe, 2020). Globally, stock markets collapsed by 50%. For example, in the US, COVID-19 resulted in massive unemployment rate with millions out of work soaring to 14.7% in April 2020, which was the highest rate since the Great Depression (Trading Economics, 2020). With the COVID-19 outbreak, a massive freeze in the industrial and logistical infrastructure caused a devastation throughout the global economy with an accompanying recession. Global annual GDP is expected to contract by 3-4% for 2020 (Abodunrin et al., 2020).
2.2 TRANSPORTATION AND PANDEMICS
Past studies have highlighted that human mobility and interaction patterns directly contribute to the spread of infectious diseases, particularly during pandemics (Funk et al., 2010; Rizzo et al., 2014; Yan et al., 2018; Peixoto et al., 2020). As studies have shown, persons infected with the novel coronavirus COVID-19 are contagious before showing any symptom (Javid, Weekes,
8
and Matheson 2020; Ferretti et al. 2020). The nature of 21st century transport networks, including high-speed and high-capacity rail and intercontinental air travel are amongst the most critical platforms for the rapid spread of the infection in high-density and mixed-use urban environments (Musselwhite, Avineri, & Susilo, 2020). Thus, in general, travel restrictions are imposed during emergence of pandemics (Zhang et al., 2011; Cooley et al., 2011; Peak et al., 2018; Muley et al., 2020).
The first case of COVID-19 was reported in Wuhan, China, at the beginning of Dec. 2019, and has then quickly spread to the rest of China through airlines and high-speed rail networks during the Spring Festival travel season(Wu et al., 2020). The virus's incubation period of 2– 10 days (WHO, 2020) afforded ample opportunity for infected but asymptomatic travellers to export infection undetected across international borders and propagate transmission in receiving communities. A review of previous studies suggested that air transport could accelerate and amplify the propagation of respiratory viruses, e.g.,influenza, MERS, SARS, coronavirus, (Browne et al., 2016). Consequently, in response to pandemic threats many countries would typically impose measures that restrict human mobility flows internally and externally as one of their response plans (Bajardi et al., 2011; Wang and Taylor, 2016; Charu et al., 2017). People also typically avoid public transport as these can be considered a breeding ground for viruses and places where it might be difficult to avoid contact with other passengers (Troko et al., 2011). These measures to prevent social contact and to slow down the spread of the virus, such as closing schools, shops, restaurants and bars, prohibiting public events and stimulating or imposing working from home can all be labelled as “social distancing”, and are especially efficient for diseases (such as COVID-19) which are transmitted by respiratory droplets and require a certain proximity of people (Wilder-Smith and Freedman, 2020). A comparative analysis of the relationship between severity of the pandemic and lockdown measures in 88 countries using a SEM (Structural Equation Modelling) method revealed that lockdown measures have significant effects to encourage people to maintain social distancing with socioeconomic and institutional factors of urbanity and modernity also having much influence (Rahman, Thill, & Paul, 2020).
Fear of infection and perceived risk also significantly influence travel behaviors, particularly for transit use, and the influence varied based on the infected area and demographic characteristics of the people (Kim et al., 2017; Cahyanto et al., 2016). During pandemics, people perceive a higher risk for all types of trip types and avoid traveling to places where
9
they perceive medium to high risk (Hotle et al., 2020). It therefore becomes imperative to attempt to model how the virus is spread and a number of studies have done this using different methodologies. The spreading of infectious diseases through public transportation (PT) system could also be modelled using a time-varying weighted PT encounter network (Mo et al., 2021). Results from this study supported policies which implement partial closure of public bus routes and limiting the capacity of buses could be effective in curbing the spread of the disease. Additionally, using a human movement model and data from a case study of Berlin, simulation results were presented on the infection dynamics of the virus considering various containment strategies such as relying on active transport as the only mode of transportation and shutting down work and leisure activities (Müller, Balmer, Neumann, & Nagel, 2020). The results revealed none of the containment strategies could be effective alone but would require varying combinations to slow down the rate of the spread of the virus.
Alternatively, the exogenous variations in human mobility created by lockdowns of Chinese cities during the outbreak of the Novel Coronavirus (2019-nCoV) were studied as well as the effectiveness of human mobility restrictions in the delaying and the halting of the spread of the COVID-19 pandemic examined (Fang et al., 2020). Furthermore, Lui et al. in their study indicated the effectiveness of synchronised travel restrictions in controlling the spread of the pandemic in China (H. Liu et al., 2020b). Similarly, Chinazzi et al. in their study, use a global metapopulation disease transmission model to project the impact of travel limitations on the national and international spread of the epidemic (Chinazzi et al., 2020). By analyzing a de-identified, large-scale dataset from smartphone users in Italy before and after the lockdown provided by a location intelligence and measurement platform, Cuebiq Inc, results were able to indicate the mobility trend changes during this timeframe (Pepe et al., 2020). This study provides an alternative means of measuring the impact of the lockdown on the transmission of the virus as well as offering useful insights to policy makers when required. However, as explained by Epstein et al. (2007), only international travel restrictions would not control a disease outbreak, but this could delay the spread or flatten the curve. Kraemer et al. (2020) also stated that when the outbreak is spread widely, travel restrictions are less effective. In addition, mobility restrictions might not be effective when the overall epidemic size is considered, and therefore, high‐ and low‐risk communities should be identified (Espinoza et al., 2020). Recent studies have explained that working from home (i.e., limiting home‐based
10
work trips) and reducing consumption (i.e., limiting home‐based shopping trips), limiting community contacts, and restricting international travel are effective mitigation policies (Jones et al., 2020; Yilmazkuday, 2020). Another study proposed cyclic exit strategies as another strategy to curb the spread of the virus as well as the impacts of a complete lockdown on the economy (Karin et al., 2020). Results indicate that when combined with other epidemiological measures such as contact tracing, hygiene and physical distance would help recovery of economic activities.
2.3 IMPACTS OF COVID ON TRANSPORTATION (A METROPOLITAN
CITY CONTEXT)
2.3.1 Effects on Mobility
The COVID-19 pandemic has produced several unprecedented effects around the world and has adversely affected the transport sector, which has experienced a drastic reduction in passenger traffic across all different modes of transport. Both passengers transport and freight suffered severe setbacks from the COVID19 crisis.
Air transport has been one of the sectors which suffered most, as it has been one of the vehicles for the virus outbreak. The International Civil Aviation Organization predicted global passenger numbers could be 80% lower in 2020 than they were in 2019 (Air Transport Bureau, 2020) and some airlines are indicating they do not expect passenger demand to return to 2019 levels until 2022 or 2023 at the earliest (Jolly, 2020). Several airlines grounded nearly all their fleet whiles some deployed passenger aircraft as freighters. Nevertheless, even though freight forwarding was still possible in most regions in the world, it suffered from extremely limited connections. Overall, in fact, the crisis has limited the airfreight capacity between China and Europe to 40% of its original capacity (Eurocontrol, 2020). Passenger transport within the EU Member States and between the European Union and the rest of the world were partially or entirely closed as part of lockdown restrictions. In Europe, passenger air traffic fell by as much as 90% (Eurocontrol, 2020) while the number of passengers using public transport declined by 80% in some cities as commuter demand evaporated and transport operators reduced their services (Bernhardt, 2020). Road and railway transport faced several problems as well, and its efficiency plummeted due to imposed restrictions by member countries of the EU (IRU, 2020). An example was in February and March when the Brenner
11
pass was closed to passengers’ transport and health controls were put in place, queues of up to 90 kilometres in length formed on the Italian side of the border (DW, 2020).
As a result of lockdown restrictions imposed, travel demand dropped due to an increased amount of working from home, e-learning, and a reduced number of public activities and events(De Vos, 2020; Hu, 2020). People also changed their daily routines and altered their household consumption patterns. Panic buying in supermarkets was quickly replaced with overwhelming (and, in many cases, unrealised) demand for online shopping and home grocery deliveries as consumers tried to avoid going outside (Hanbury, 2020). Spill over effects included less car traffic – and less congestion during peak hours – and in reduced public transport ridership as well as influences to travel mode choice (Klein et al., 2020). In the UK, road traffic volumes fell by as much as 73% to levels not seen since the mid-1950s as private cars remained on driveways and people adhered to government advice to remain indoors (Carrington, 2020).The fear of infection and perceived risks also significantly influence travel behaviours, particularly for transit use, which is also influenced by variations based on the infected area and demographic characteristics of the people (Kim et al., 2017). During pandemics, people perceive a higher risk for all types of trip types and avoid traveling to places where they perceive medium to high risk (Hotle et al., 2020). A study conducted in Turkey concluded that one of the most adopted preventive behaviours during COVID‐19 was the avoidance of public transportation (Yildirim et al., 2020). Another study conducted in Hong Kong during the early phase of COVID‐19 reported that 40% of the online survey respondents answered that they would avoid public transportation (Kwok et al., 2020). Commuters that do not have other options than using public transport might try to avoid crowded buses and trains by travelling during off-peak hours. Whiles there was also a significant shift from public transport to private and non-motorized transport, a study revealed that gender, car ownership, employment status, travel distance, the primary purpose of traveling, and pandemic‐related underlying factors during COVID‐19 were the main influencing predictors of mode choice by commuters (Abdullah, Dias, Muley, & Shahin, 2020). Also in China, by using online surveys the phenomena of people being inclined towards using private transport was also observed as well as a growing inclination to buy new cars for those who don’t already own cars (Chui, 2020).
The shutdown in industrial activity and the associated reduction in transport emissions that resulted from the COVID-19 pandemic resulted in notable improvements in local air quality
12
in towns and cities worldwide (Monks, 2020). Huang et al. in their study also examined the effects of enhanced secondary pollution offset reduction of primary emissions during COVID-19 lockdown in China using comprehensive in-situ measurements and chemical transport modelling(Huang et al., 2020).
2.3.2 Effects (Metropolitan city context)
With respect to investigating the spread of the corona virus pandemic in a metropolitan city context, a couple of studies have been conducted in recent times. For example, a study was conducted examining the fundamentals of the factors that may affect the spread of the novel coronavirus (COVID-19) in cities (L. Liu, 2020). It revealed that distance subway, wastewater and residential garbage are positively connected with the virus transmission while distance to the epicentre is a huge factor. This study was able to provide a highly precise estimation of the number of COVID-19 infection in Wuhan city which was very close to the officially reported number using a regression model. There remained some uncertainty on how some of these factors directly influence the transmission rate. The results, however, could be informative to policymakers on approaches to predict the local transmission of the virus. Other studies attempt to quantify the impacts of the pandemic have had directly on various modes of mobility using different sources of data which were available. In the severely affected cities, mobility was reduced by up to 90% (Muhammad et al., 2020). In the USA, population mobility was reduced by 7.87% due to official stay‐home orders. Further, a rise of the local infection rate from 0% to 0.0003% lowered the mobility by 2.31% (. A shift towards active transport from public transport is observed as a trend in most of these studies. A study conducted in in Budapest, Hungary reported that the demand for public transport decreased by approximately 80% while the car usage increased from 43% to 65% (Bucsky, 2020). Moreover, another study examined the impacts of the lockdown measures and COVID-19 related deaths on human mobility in the United Kingdom (Hadjidemetriou, Sasidharan, Kouyialis, & Parlikad, 2020). The data used was associated with human mobility trends of walking, driving and using public transport provided by Apple mobility trends reports (Apple Maps, 2020) was compared to a baseline volume of the previous year. Results indicated that human mobility was found to be reduced drastically during lockdown measures and until the end of May 2020 did not show any major fluctuations, with driving, transit and walking
13
remaining 60%, 80% and 60% reduced compared to the same period of the previous year (i.e. 2019). Additionally, a study conducted in Switzerland revealed that the number of trips perweekday and average kilometres travelled reduced up to around 60% during the second week of March in 2020. This study further mentioned that males continued to travel more compared to females (Molloy et al., 2020).
Using datasets based on ticket validations, sales and passenger counts data, the impact of the COVID pandemic on transportation modes in the three largest regional public authorities in Sweden, namely Stockholm, Västra Götaland and Skåne was analyzed (Jenelius & Cebecauer, 2020). Results indicated a decline in public transport usage during the lockdown period and as restrictions were gradually lifted whiles cycling had increased in Stockholm relative to averages recorded in 2019. The impacts of the restrictions on city bus network in Corona in Spain were analysed (Orro, Novales, Monteagudo, Pérez-López, & Bugarín, 2020). Using data from automatic vehicle location, bus stop boarding, and smart card use, this study investigated the changes in transit ridership by line, the use of stops, the main origin– destination flows, changes in transit supply, operation time, and reliability of the city bus network. Results revealed the impact on transit ridership during the lockdown process was more significant than that on general traffic. Additionally, after restrictions were lifted, the general traffic and the shared bike system recovered a higher percentage of their previous use than the bus system. These impacts are not uniform across the bus network.
Alternatively, in a study of Sicily (Campisi et al., 2020), a city in Southern Italy, the influence of COVID-19 on changes in the use of sustainable travel modes with a comparative analysis between before and during the pandemic was also explored. The methodology involved using an online survey on a representative population of 431 individuals which was carried out during the period from March to May 2020 in the case study area. Results showed that respondents who were skeptical about safety issues with using public transportation were likely to increase their use of either walking or cycling as a mode of mobility.
2.4. SUSTAINABILITY AND RESILIENCE BUILDING POST-COVID
The COVID-19 pandemic has raised some questions about the vision of infrastructure, changing everyone’s viewpoint. Prior to the pandemic, transportation policy making faced
14
some challenges such as the negative externality effects of transport noise, emissions, congestion and accidents(Goetz, 2019).This was to be achieved by using combinations including policy instruments, pricing mechanisms, technological interventions mainly focusing on ‘top-down’ Transport Demand Management, Smart Mobility, Intelligent Transport and Mobility Management approaches to transport policy (Faure & Partain, 2018).There was also growing effort by metropolitan cities all over the world to shift towards more sustainable modes of transportation (Gallo & Marinelli, 2020). Policies made were therefore likely aimed at mitigating (as far as possible given budgetary constraints and political considerations) these challenges whiles attempting to modify individual and corporate travel behaviour and simultaneously making mobility more environmentally sustainable. However, with the advent of the pandemic with its long-lasting effects, these approaches alone might be inadequate in a post-COVID world.
The priority now for most metropolitan cities would be modifying existing policies to also formulate appropriate set of policies and interventions which should emphasize on safety, resilience, efficiency and economic viability post COVID-19 (in the short term and long term) (Gallo & Marinelli, 2020). Long term impacts of COVID-19 would demand the process of making permanent changes related to smart working and other daily activities, thus reducing mobility needs and overall fossil energy consumption which would accelerate sustainability transitions in transportation. Several studies have examined resilience and sustainability in the transport sector.
CIVITAS defines sustainable transport as a set of strategies in a transportation system that have a net positive effect on the three dimensions of sustainability, namely economy, environment and society(Faure & Partain, 2018). Alternatively, the process of achieving more sustainable transportation is defined as requiring suitable establishment of four pillars: effective governance of land use and transportation; fair, efficient, stable funding; strategic infrastructure investments; and attention to neighbourhood design(Kennedy, Miller, Shalaby, MacLean, & Coleman, 2005). Urban transportation systems are always exposed to different types of disruptions such as natural events such as floods or pandemics, human-made events such as terrorist attacks and general failures as a result of system errors. The COVID-19 pandemic is a stark reminder of this. The concept of resilience in transportation infrastructure systems therefore becomes a pertinent point of discussion. Its definition is quite a broad one with different researchers with different backgrounds, perspectives and understanding
15
offering varying definitions. However, a general definition is described as the ability of a system to resist, reduce and absorb the impacts of a disturbance (shock, interruption, or disaster), maintaining an acceptable level of service (static resilience), and restoring the regular and balanced operation within a reasonable period of time and cost (dynamic resilience) (Gonçalves & Ribeiro, 2020). In conclusion, D’Adamo et al. reported that the implementation of circular and green strategies is not explicitly aimed at improving resilience (D’Adamo & Rosa, 2020). However, their impacts are significant in terms of response and recovery, and one benefit is their positive effect on the environment and climate change, reducing the likelihood of environmental disasters. Through long-term planning, instruments such as the acquisition of public funds, and public–private partnerships, this could be achieved.
The potential effectiveness of non-pharmaceutical interventions (NPIs) such as stay-home restrictions or social distancing have already been examined by many studies as highlighted before and proven to be viable in the short-term to long-term whiles pharmaceutical interventions are to be introduced. Active transport seems to be clearly on the rise as surveys and studies highlighted previously have shown. People whiles reducing their travel trips due to COVID-19 would temporarily prefer to use active modes or cars over public transport. This will reduce the traffic volumes and affect people’s well‐being (De Vos, 2020). During lockdown restrictions, policymakers and transport planners stimulated walking and cycling by (temporarily) allocating less-used street space to cyclists and pedestrians (King and Krizek, 2020), prioritising places which experienced traffic congestion and did not have adequate walking and cycling infrastructure. Also, cities in Europe (e.g., Berlin, Vienna), North America (e.g., Philadelphia, Vancouver), and Latin America (e.g., Bogota, Mexico City) decided to temporarily turn car lanes into sidewalks and bike lanes (Laker, 2020). Some cities in Australia, for instance, have already started implementing automatic pedestrian crossings, so that people do not have to press a button (Laker, 2020). The desire is to implement such measures permanently where these measures turn out to be successful (i.e., resulting in large flows of active travellers). Further plans such as restricting cars from certain local streets, placing additional (pop-up) cycling parking, and reducing waiting time for pedestrians to cross roads have been suggested and being implemented by government authorities all over the world in an attempt to promote active transport (Barbarossa, 2020; Lozzi et al., 2020).
16
Additionally, a solution proposed in an attempt to solve the limitations of some existing transport policies was the concept of Responsible Transport in which individual citizens are aware of the effects their mobility and travel behaviour have on themselves, other people and environment, and act accordingly (Budd & Ison, 2020).For example, the study suggests ways of achieving ideal situations where an individual would consider trip purposes, consider the suitable modes of transportation and possibly substitute in-person meetings for video calls if possible.
In as much as studies and surveys have shown a growing trend towards active transport by commuters, public transportation has a huge role to play in the vision of a more sustainable transportation system. For example, a survey which was conducted in May 2020 by the UK independent transport group Transport Focus revealed that 4 in every 10 people surveyed said they were likely not to use public transport again until they felt it was safe to do so. Additionally, only 18% of respondents stated that they would be happy to resume using public transport when restrictions are lifted by the government (Transport Focus, 2020). It therefore becomes clear that public transport operators would need to reassure passengers of the safety of their operations, with measures taken such as reconfiguring the internal layout of seats and circulation spaces on buses and trains, and installing contactless door sensors, hand sanitizer dispensers and clear screens between seats to provide a physical barrier to airborne aerosols (Paton, 2020). This measures have been taken all over the world as observed in many studies (Barbarossa, 2020; Hynes & Malone, 2020; Lozzi et al., 2020; Megahed & Ghoneim, 2020).
2.5. RESEARCH GAP
There have been a lot of reports on the impacts of the pandemic on transportation modes in metropolitan cities (Aloi et al., 2020; Bucsky, 2020; Campisi et al., 2020; Jenelius & Cebecauer, 2020). Additionally, there is emerging literature considering the impacts and comparing plans for transforming mobility and transportation systems globally using similar methods however there remains a dearth in literature which combines these issues and examines them in an aggregated perspective. This study proposes to look at the specific case study of a metropolitan city (Bologna), examine the impacts of the pandemic during varying phases,
17
compare with other study cases to identify trends or differences with these effects and critically examine policies and measures being enacted by local government authorities to build resilience in their transportation system.
18
CHAPTER 3 – METHODOLOGY
3.1. STUDY AREA
The case study area is Bologna which is a regional capital of the Emilia-Romagna province in North-Central Italy. It has a population of around 390,000 inhabitants and the seventh most populous city in Italy. Its metropolitan area is home to more than 1,000,000 people (Provincia di Bologna). Bologna is home to the Guglielmo Marconi International Airport, and according to statistics, the seventh busiest Italian airport for passenger traffic, about 8 million passengers handled in 2018 (www.bologna-airport.it).Additionally, Bologna Centrale railway station is one of Italy's most important train hubs thanks to the city's strategic location as a crossroad between north–south and east–west routes.
Emilia-Romagna is currently ranked third in the number of infections by regions in Italy. Bologna as well, leads in number of infected cases in the provinces in the Emilia-Romagna region (Minestero della Salute, 2020). The following tables 3.1 and 3.2 show the statistics of number of cases recorded in each province (Data accessed on 12 October, 2020 @12:55pm).
Table 3.1 Number of COVID-19 cases recorded in provinces of Italy (Data accessed on 12 October, 2020 @12:55pm). Region Number of infected cases Lombardia 113024 Piemonte 38503 Emilia-Romagna 37681 Veneto 31503 Lazio 19890 Campania 18530 Toscana 18160 Liguria 15269 Puglia 9512 Sicilia 9294
19
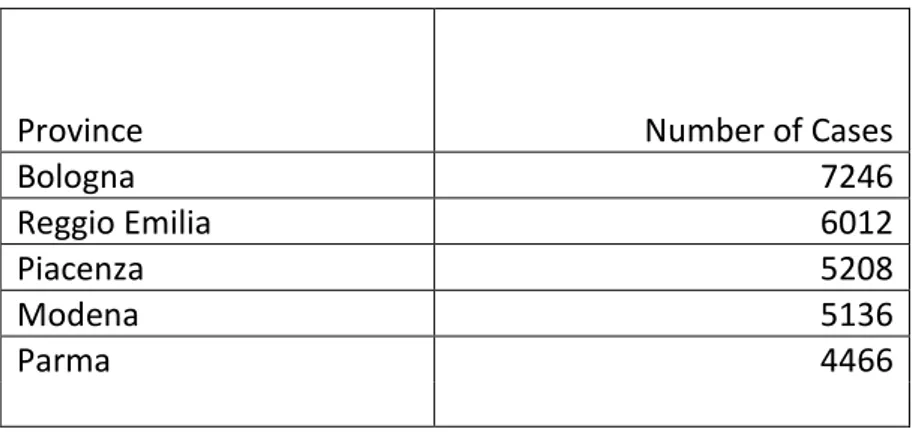
Table 3.2 Number of COVID-19 cases recorded in cities in Emilia-Romagna Province (Data accessed on 12 October, 2020 @12:55pm).
Province Number of Cases
Bologna 7246
Reggio Emilia 6012
Piacenza 5208
Modena 5136
Parma 4466
The city of Bologna has widely varying transportation infrastructures (neighbourhood streets, arterials, separated path non-adjoining the roadway, separated by a non-continuous barrier path, cycle track obtained from the sidewalk). The Figure 3.1 below shows a map of Bologna and the different transportation infrastructures.
Figure 3.1 A map showing the various types of transportation infrastructure in Bologna (Biciplan di Bologna, 2018).
For example, there are 128.5 km of bicycle facilities in the city with about 43 km being off-street paths (Rupi, Poliziani, & Schweizer, 2019). The cycle network layout is composed of 13 main radial bicycle paths, connecting the suburbs to the city centre, and many other bicycle lanes linking the radials ones. Table 1 shows the length of bicycle lanes divided from roadway
20
(in km) from 2009 to 2017 (Commune di Bologna, 2017). It can be observed that the length of bike network has increased by about 50% between the period of 2009 to 2017 as shown in the Table 3.3 below.
Table 3.3 Yearly total bicycle lane length in Bologna
The public bus operator of the city of Bologna is TPER (Transporti Passegeri Emilia Romagna). It has to run 2.2 million services every year, which cover a total of 18 million kilometers and transport 92 million passengers (Lodi, Malaguti, Stier-Moses, & Bonino, 2016). The regional government entrusts the supervision of the local transportation to a government-owned agency called SRM (http://www.srmbologna.it) which supervises the activities of TPER. TPER has a fleet of buses which serve the metropolitan area of Bologna with a number of bus lines serving areas within the city both internally and externally (https://www.tper.it/orari). These buses consist of natural gas vehicles, hybrid vehicles and electric vehicles.
3.2. DATABASES
The study in this paper aimed to investigate the frequency of use of the different modes of transport before and during the COVID-19 lockdown period and the impacts of the COVID pandemic on the mobility trends of people living in Bologna. To achieve this, it explores and analyses available mobility data from the following databases with respect to defined timeframes.
bicycle lane divided from roadway (km) 2009 86,0 2010 91,5 2011 96,5 2012 102,0 2013 107,5 2014 112,0 2015 120,5 2016 126,4 2017 128,5
21
3.2.1 Bicycle Flow Count
Generally, in Italy, traffic monitoring of bicycles is rarely performed. Although several techniques and instrumental monitoring systems have been developed, few Italian cities carry out periodic and consistent monitoring of bicycle volumes. In Bologna, data are collected through manual counts of cyclists during peak commuting periods and also with automatic traffic counters.
The University of Bologna (DICAM) also performs some monitoring of the cycling flows on the main sections of the Bologna bicycle network. The monitoring period has normally been between the 15 September to 15 October each year from 2009 to 2019 (Iperbole Rete Civica, 2020). The figure shows the locations where these counts were conducted:
Figure 3.2 Instruments used for monitoring bike flows in Bologna (2017).
For many sections both manual and instrumental counts are conducted. The manual monitoring is normally conducted in each section for at least 2 days, from 8.30 A.M. to 10.30 A.M. and from 4.30 P.M. to 5.30 P.M. so as to include the peak hour of the morning and afternoon. Therefore, data is also collected using two kind of instruments: pneumatic and radar traffic counters, which are placed each year in different sections for at least 7 days to
22
ensure a complete coverage from 0:00 to 24:00. However, this data was not readily made available during the time this study was conducted.
Figure 3.3 Instruments used for monitoring bike flows in Bologna.
Additionally, the commune of Bologna has over the past two years provided three permanent measuring stations with magnetic induction systems for counting cyclists passing along the tracks where they are located. Two of these devices are accompanied by a totem equipped with a display, which highlights the number of daily and annual passages on the spot. They are located along the Via Ercolani, Via Sabotino and Via San Donato with data available from the 8th of January,2018, 18th December, 2019 and 19th April, 2019 respectively
(www.comune.bologna.it). For this study, data representing cyclist flows would be obtained from this source since it is open access data.
An example of the device for measuring these flows is shown in the Figure 3.4 below:
23
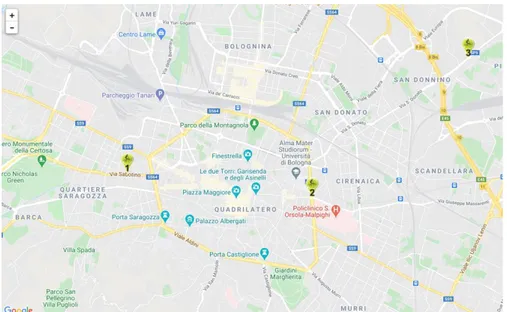
Figure 3.5 Locations of permanent counting stations owned by the commune of Bologna (Google Maps).
The data for the cyclist flows along these sections are readily made available on an online portal (https://www.eco-public.com/ParcPublic/?id=6082).
3.2.2 Passenger Count in Buses
Passenger counts in buses are rarely conducted by the transport agency and when they are done, the data is privy to the internal use of the agency. To be able to obtain this data for our case study, these counts had to be conducted manually by the students of the University of Bologna. There was some data available from previous counts conducted on 3 of the principal bus lines in the city. Counts therefore had to be scheduled to be able to establish a timeframe for comparison. The pathways for each bus line considered are illustrated in the figures 3.6, 3.7 and 3.8 below.
Table 3.4 Pathways of bus lines considered for study.
Busline Origin Destination
27 Corticella Stazione Longo
13 Scala San Ruffilo
24
Figure 3.6 Pathway of bus line 27(Google Maps).
25
Figure 3.8 Pathway for bus line 20(Google Maps)
The counts are conducted by counting the number of passengers in the bus at the origin and then simultaneously recording those who board and descend from the bus at successive stops till the destination. It is important to note that children who were seemingly below the ages of 7 were not included since they were accompanied by their guardians. The counts could not be conducted during the lockdown phase since mobility was restricted to solely purposes of necessity. To ensure consistency with the collection of data, counts were counted on the first buses after 8 am at each origin point of the bus line.
3.2.3 Vehicle Traffic Count
The car counting devices are an integral part of the traffic light system. The counters are magnetic detectors under the road surface used to adapt the traffic light phases to the traffic flows i.e. if there are many cars on a specific branch of the traffic light then the green phase of the respective route would be prolonged. These counters are owned by the
Commune of Bologna.
Figure 3.9 shows the geographical positions on the Bologna road network of inductive loops installed by the local municipality to monitor the traffic dynamics. The area under evaluation has 187 detectors that record traffic flow data in terms of the constant presence of vehicles passing over each detection site on a specific road branch. The Municipality of Bologna provides datasets containing inductive loops data, aggregated into hourly time periods and referring to 24 hours of a typical workday. The road traffic count data give a good coverage
26
of the main city roads, including the fast-transit ringway, the main entry/exit roads to/from downtown and other several roads crossing the city centre (Caiati et al., 2016).
Figure 3.9 Geographical locations of traffic counters in central Bologna.
3.2.4 Auxiliary Data
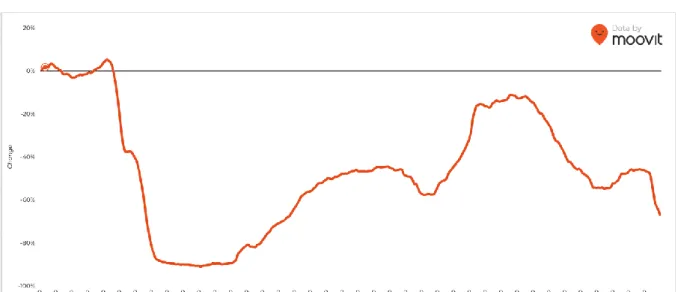
Mobility service providers have published data based on geographical location data (e.g., Google COVID-19 Community Mobility Reports1), travel planner queries (e.g., Apple Mobility Trends2) or app usage (e.g., Moovit Public Transit Index).
• MOOVITAPP
This is one of the various apps which use the location of a user to give real-time arrival information for nearby public transportation services (and even docked and dockless bikeshare, ride-hailing like Uber and Lyft, and car rentals like car2go). It assists in planning trips and works in most major cities while accessing real-time arrival information on the home screens without inputting a destination, unlike Google Maps or Apple Maps. It allows open access to its data, which is updated daily, on its usage and compares it to a typical week before the outbreak began (the week prior to January 15). This study would consider the data available for the app’s usage in the city of Bologna.
27
3.3. TIMEFRAMES
Italy had a nationwide lockdown starting on the 9th of March, 2020 with measures being
loosened according to state legislation in the subsequent months of May and June, 2020. Bologna, under the Emilia-Romagna province also followed this timeline, however in order to establish some congruity based on the data available for this study, the timeframes were characterized into the following phases:
• Phase 1 - pre-lockdown (data from 2019 or before the lockdown),
Data obtained from the various modes before the effects of any restrictions imposed by the Italian government were realized. Schools, workplaces, entertainment facilities and all other services were all running normally.
• Phase 2 - during the lockdown (data from March and April, 2020)
On 11 March, restaurants and bars were closed. After 12 March, the Italian government banned all travel and forced people to stay at home. On 20 March, parks, gardens, and playgrounds were closed as well. Industries producing essential goods as well as non-essential services were closed on 22 March. All modes of public transportation were brought to a halt.
• Phase 3 - immediate post lockdown (data from May and June, 2020),
The Italian government launches the “Fase 2” in May which was characterized by the return to work of essential services and the ability to visit closely-related family residing in the same municipal area. “Fase 3” follows in June where non-essential services such as cinemas and museums were reopened with restrictions placed on their capacities (http://www.governo.it/it/coronavirus-misure-del-governo).
• Phase 4 - post lockdown (data from September and October,2020)
Restrictions are gradually lifted in subsequent months with schools and workplaces reopened. However, educational facilities are being run with a shift system having restrictions placed on maximum capacity. Similar schemes are applied at workplaces and varying restrictions are enforced on the opening of non-essential facilities depending on the rate of infection of the virus (http://www.governo.it/it/coronavirus-misure-del-governo).
28
3.4. RESEARCH APPROACH
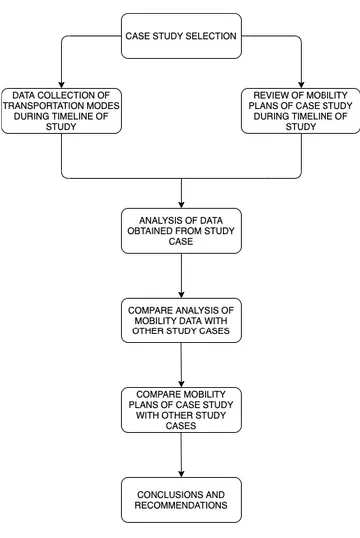
The datasets were obtained from the various databases as discussed in .csv file formats and were analysed. The following steps in Figure 3.10 describes the general methodology applied in this study.
Figure 3.10 Research methodology
3.4.1 Cyclist Flows
The separate counts from the three automated counts were merged on one sheet. The date range of the data obtained was from the 22nd of April, 2019 to the 25th of October, 2020. The
flows from each counter in both directions were summed for each location and a total sum of all flows was obtained for each hour of count.
1. A simple comparison of the flows with respect to the timeframe of the obtained dataset was made and the graph shown in Figure 3.11 below.
29
Figure 3.11 Number of weekly cyclist counts recorded from April 2019 to October 2020.
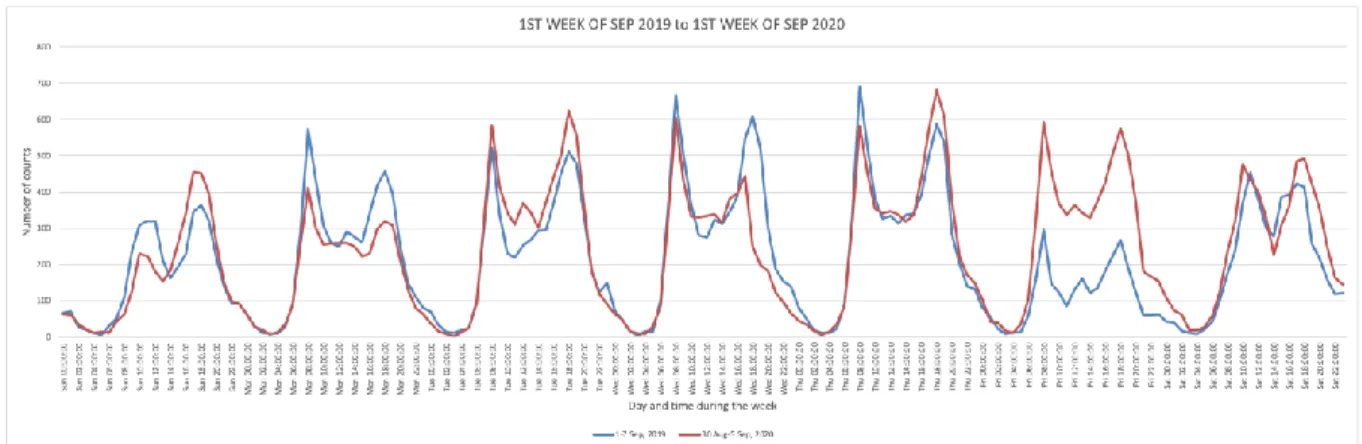
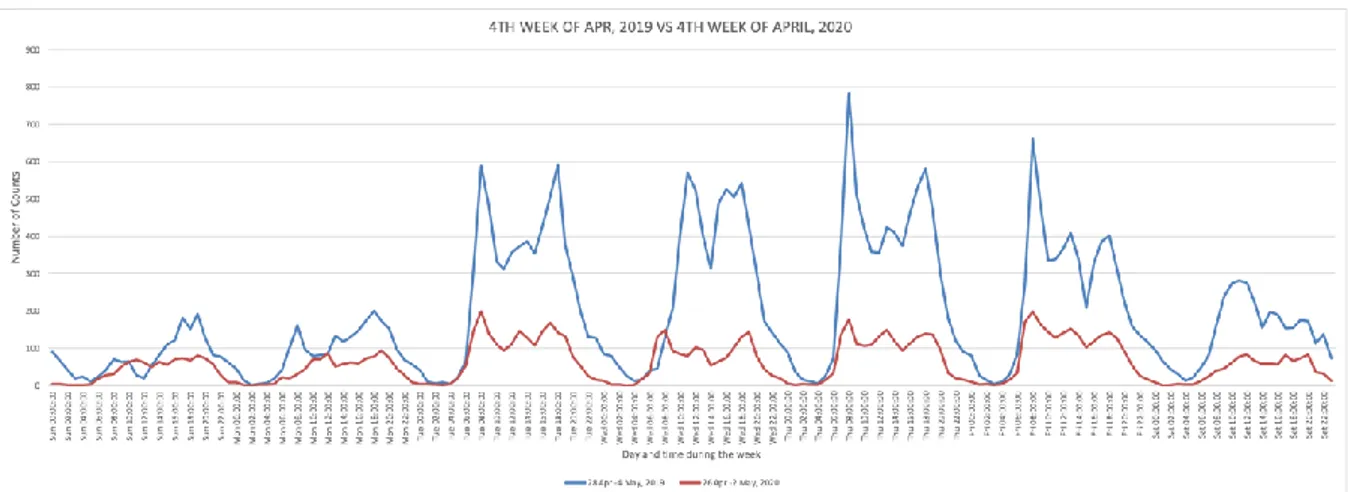
2. Secondly, a selection of the counts of weeks of the previous year (2019) were compared to the same of the current year (2020) as shown in Figure 3.12 below. An important condition to be met was that the weather conditions for that week were first checked to ensure the absence of rainy days in the data which could affect its validity.
Figure 3.12 A comparison of the first weeks in September for 2019 and 2020.
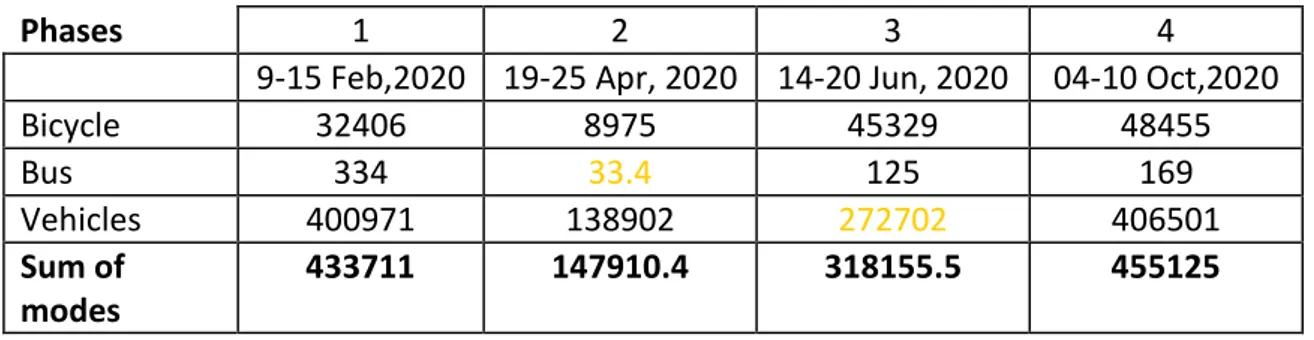
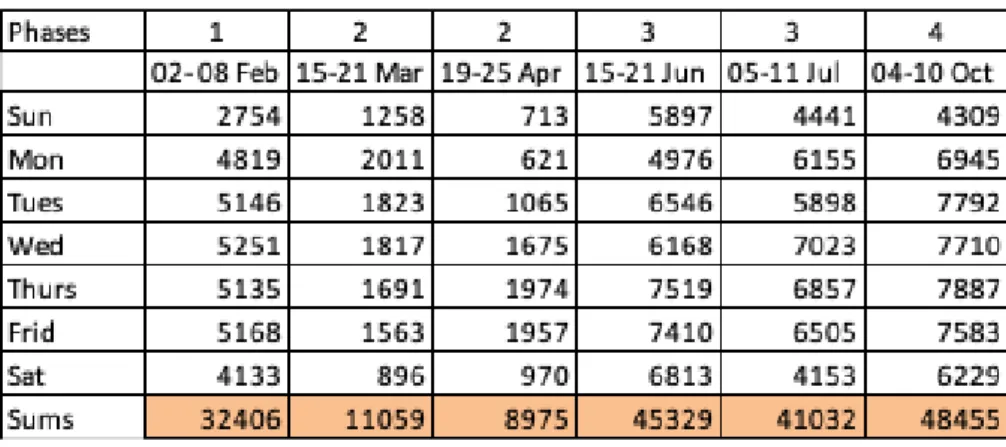
3. Thirdly, a comparison of flow counts was made for the already established time frames for all modes. The sum of counts for each phase were obtained as shown in Table 3.5 and a modal comparison could be made subsequently.
30
Table 3.5 Sums of daily flow counts for each phase.
Phases 1 2 2 3 3 4
02- 08 Feb 15-21 Mar 19-25 Apr 15-21 Jun 05-11 Jul 04-10 Oct
Sun 2754 1258 713 5897 4441 4309 Mon 4819 2011 621 4976 6155 6945 Tues 5146 1823 1065 6546 5898 7792 Wed 5251 1817 1675 6168 7023 7710 Thurs 5135 1691 1974 7519 6857 7887 Frid 5168 1563 1957 7410 6505 7583 Sat 4133 896 970 6813 4153 6229 Sums 32406 11059 8975 45329 41032 48455
3.4.2 Bus Flows
The available datasets were recorded on the following dates: • 25th, 26th and 27th and 28th of February, 2019
• 4th and 11th of March 2020
• 15th, 16th and 18th of June, 2020
• 7th and 9th July, 2020
• 5th, 8th and 9th of October, 2020
The following comparisons of the counts for each bus stop on the respective days were made:
1. Graphs showing the counts of passengers boarding at each stop were made for each line as shown in Figure 3.13 below.
Figure 3.13 Counts for passengers boarding bus line 27.
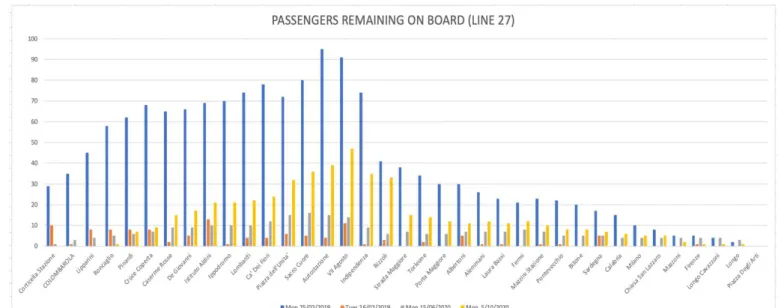
2. Graphs showing the counts of passengers remaining onboard the bus at each stop were made for each line as shown in Figure 3.14 below.
31
Figure 3.14 Counts for passengers remaining on board using bus line 27
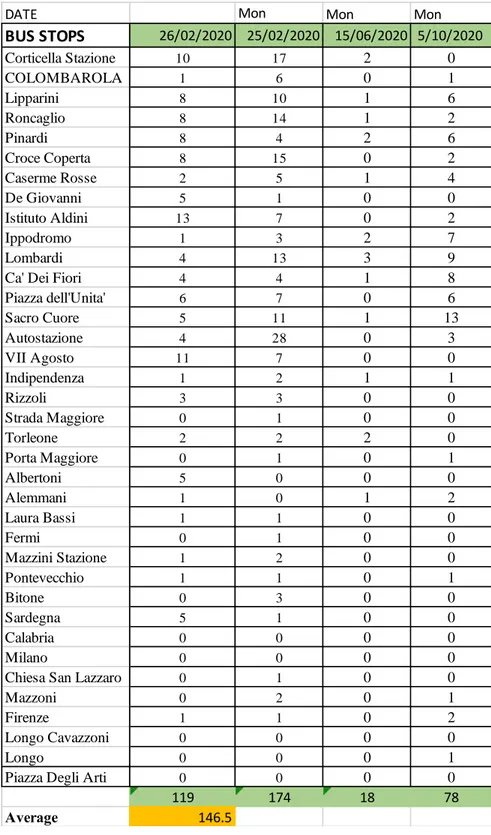
3. The sums of the number of passengers boarding each bus stop on the count days were compared as shown in Table 3.6 below.
32
Table 3.6 Comparisons of sums of passenger counts on count days.
DATE Mon Mon Mon
BUS STOPS 26/02/2020 25/02/2020 15/06/2020 5/10/2020 Corticella Stazione 10 17 2 0 COLOMBAROLA 1 6 0 1 Lipparini 8 10 1 6 Roncaglio 8 14 1 2 Pinardi 8 4 2 6 Croce Coperta 8 15 0 2 Caserme Rosse 2 5 1 4 De Giovanni 5 1 0 0 Istituto Aldini 13 7 0 2 Ippodromo 1 3 2 7 Lombardi 4 13 3 9
Ca' Dei Fiori 4 4 1 8
Piazza dell'Unita' 6 7 0 6 Sacro Cuore 5 11 1 13 Autostazione 4 28 0 3 VII Agosto 11 7 0 0 Indipendenza 1 2 1 1 Rizzoli 3 3 0 0 Strada Maggiore 0 1 0 0 Torleone 2 2 2 0 Porta Maggiore 0 1 0 1 Albertoni 5 0 0 0 Alemmani 1 0 1 2 Laura Bassi 1 1 0 0 Fermi 0 1 0 0 Mazzini Stazione 1 2 0 0 Pontevecchio 1 1 0 1 Bitone 0 3 0 0 Sardegna 5 1 0 0 Calabria 0 0 0 0 Milano 0 0 0 0
Chiesa San Lazzaro 0 1 0 0
Mazzoni 0 2 0 1
Firenze 1 1 0 2
Longo Cavazzoni 0 0 0 0
Longo 0 0 0 1
Piazza Degli Arti 0 0 0 0
119 174 18 78