©2012
Landes
Bioscience.
Do
not
distribute.
Autophagy 8:12, 1-13; December 2012; © 2012 Landes Bioscience
BAsic ReseARch PAPeR BAsic ReseARch PAPeR
*Correspondence to: Maria Rosa Ciriolo; Email: [email protected] Submitted: 12/05/11; Revised: 08/27/12; Accepted: 08/31/12
http://dx.doi.org/10.4161/auto.22037
Introduction
Thiol-containing compounds play a central role in many physi-ological reactions due to their capability to undergo redox cycles between reduced and oxidized status. Cellular response to stress often involves changes in thiol content that are first consumed in reactions aimed at protecting cellular component from oxida-tive insults, and subsequently restored by sulfur reduction, or by de novo synthesis. Two of the main molecules belonging to this class of compounds are glutathione (GSH), the most abundant nonproteic sulphydryl, and thioredoxin (TXN/TRX), a small
protein containing two vicinal cysteine residues.1,2
GSH is a thiol-containing tripeptide (γ-glu-cys-gly), whose concentration is in the millimolar range (1–10 mM) within cells. It is synthesized by two ATP-dependent reactions: the first,
Glutathione (γ-L-glutamyl-L-cysteinyl-glycine, Gsh) is the most abundant low molecular weight, thiol-containing compound within the cells and has a primary role in the antioxidant defense and intracellular signaling. here we demonstrated that nutrient deprivation led to a significant decrease of intracellular Gsh levels in three different carcinoma cell lines. This phenomenon was dependent on ABcc1-mediated Gsh extrusion, along with GcL inhibition and, to a minor extent, the formation of Gsh-protein mixed disulfides that synergistically contributed to the modulation of autophagy by shifting the intracellular redox state toward more oxidizing conditions. Modulation of intracellular Gsh by inhibiting its de novo synthesis through incubation with buthionine sulfoximine, or by maintaining its levels through Gsh ethyl ester, affected the oxidation of protein thiols, such as PRDXs and consequently the kinetics of autophagy activation. We also demonstrated that thiol-oxidizing or -alkylating agents, such as diamide and diethyl maleate activated autophagy, corroborating the evidence that changes in thiol redox state contributed to the occurrence of autophagy.
Glutathione participates in the modulation of
starvation-induced autophagy in carcinoma cells
enrico Desideri,1,† Giuseppe Filomeni1,2,† and Maria Rosa ciriolo1,2,*
1Department of Biology; University of Rome “Tor Vergata”; Rome, italy; 2Research centre iRccs san Raffaele Pisana; Rome, italy †These authors contributed equally to this work.
Keywords: glutathione, redox state, ABCC1, peroxiredoxins, diamide, diethylmaleate, BECN1
Abbreviations: ABCC1, ATP-binding cassette, sub-family C (CFTR/MRP), member 1; ATG4, autophagy-related 4; ATG5,
autophagy-related 5; BCL2, B-cell CLL/lymphoma 2; BECN1, Beclin 1; Atg, autophagy-related; BSO, buthionine sulfoximine; C12orf5, chromosome 12 open reading frame 5; CASP3, caspase 3, apoptosis-related cysteine peptidase; CASP9, caspase 9, apoptosis-related cysteine peptidase; CCCP, carbonyl cyanide m-chlorophenylhydrazone; CQ, chloroquine; DEM, diethylmaleate;
DMTU, dimethylthiourea; DON, 6-Diazo-5-oxo-L-norleucine; EGFP, enhanced green fluorescent protein; GAPDH, glyceraldehyde-3-phosphate dehydrogenase; GCL, glutamate-cysteine ligase; GGT, gamma-glutamyltransferase; GSR, glutathione
reductase; GSS, glutathione synthetase; HA, hemagglutinin; HBSS, Hank’s Balanced Salt Solution; HPLC, high-performance liquid chromatography; MAP1LC3B, microtubule-associated protein 1 light chain 3 beta; LDH, lactate dehydrogenase; MFN1,
mitofusin 1; MK571, 5-(3-(2-(7-Chloroquinolin-2-yl)ethenyl)phenyl)-8-dimethylcarbamyl-4,6-dithiaoctanoic acid; MTOR, mechanistic target of rapamycin (serine/threonine kinase); NAC, N-acetyl cysteine; NADPH, nicotinamide adenine dinucleotide
phosphate; PARK2, parkinson protein 2, E3 ubiquitin protein ligase (parkin); PRDX, peroxiredoxin; RNS, reactive nitrogen species; ROS, reactive oxygen species; TXN, thioredoxin
catalyzed by glutamate-cysteine ligase (GCL, formerly known as γ-glutamylcysteine synthetase, EC 6.3.2.2), allows the formation of γ-glutamylcysteine from L-glutamate and L-cysteine; the sec-ond relies upon the activity of glutathione synthetase (GSS, EC 6.3.2.3), which catalyzes the synthesis of GSH by the addition of
glycine to γ-glutamylcysteine.3 GSH can be found in three
dif-ferent states inside cells: reduced (GSH), intramolecular disulfide (GSSG) or as mixed disulfide with proteins (GS-R). Under phys-iological conditions, oxidized forms of glutathione are less than 1% of total glutathione. Stress conditions can result in transient increases of GSSG, which is rapidly reduced back to GSH by means of the NADPH-dependent glutathione reductase (GSR). GSSG can also exchange with protein thiols to form GS-R. Since the oxidation of several thiol-containing proteins involved in sig-naling alters their structure and function, trans-glutathionylation
©2012
Landes
Bioscience.
Do
not
distribute.
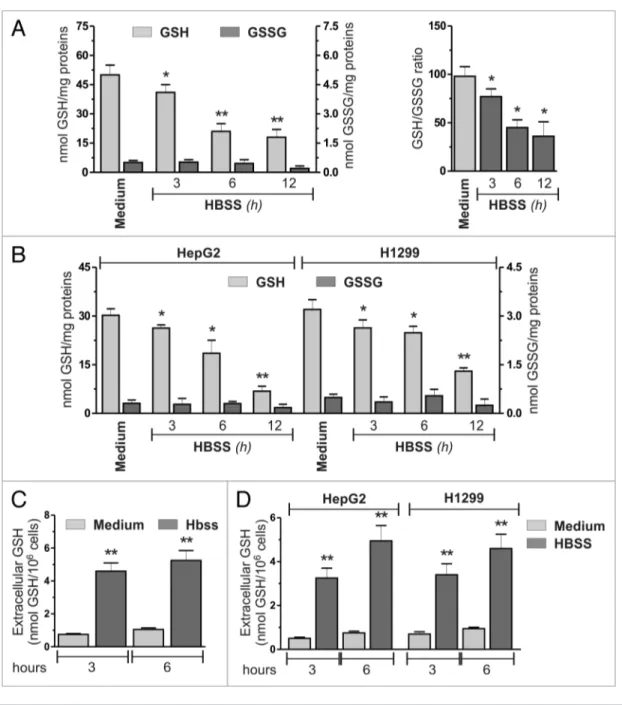
GSSG levels, thus resulting in a progressive decrease in GSH/ GSSG ratio. To assess whether this phenomenon was cell-line specific, we measured intracellular GSH levels in conditions of nutrient starvation in other carcinoma cell lines: hepatocellular carcinoma, HepG2 and non-small cell lung carcinoma, H1299. As shown in Figure 1B, starvation induced a significant decrease of GSH levels in both cell lines, indicating that this phenom-enon could be a general response for carcinoma cells. To evalu-ate whether GSH decrease was associevalu-ated with ROS generation, we incubated HeLa cells with 5 mM N-acetyl-l-cysteine (NAC) or 20 mM dimethylthiourea (DMTU) to increase their antioxi-dant capacity. Figure S1A and S1B show that both compounds were able to scavenge ROS and, at the same time, to prevent the accumulation of the lipidated form of MAP1LC3B/LC3 (MAP1LC3B-II), which represents a well-established marker of autophagy. However, NAC and DMTU did not affect the kinetics of GSH decrease (Fig. S1C), indicating that such a phe-nomenon is not directly related to ROS production. Similarly, as shown in Figure S1D, knockdown of ATG5, which encodes a protein required for the early steps in autophagosome forma-tion, did not prevent GSH decrease, indicating that this phe-nomenon is not a consequence of autophagy activation. To verify whether GSH decrease was a unique response to nutrient star-vation or it was a common phenomenon occurring upon other proautophagic stimuli, we monitored GSH levels upon treatment with rapamycin in HeLa cells. As depicted in Figure S2A and
S2B, rapamycin-induced autophagy was not associated with any
alteration in intracellular GSH levels. We also tested the possibil-ity that alteration of GSH levels could occur upon the canonical induction of selective mitophagy. PARK2/Parkin-HA-expressing HeLa cells were treated with 20 μM carbonyl cyanide m-chloro-phenylhydrazone (CCCP), a well-known mitochondrial uncou-pler and mitophagy inducer. As previously reported, western blot analysis of MFN1/mitofusin 1 in PARK2-HA-expressing HeLa cells showed that CCCP incubations induced a decrease of MFN1, which represents a driving event of mitophagy (Fig.
S2C).16 However, CCCP failed to induce any alteration in GSH
levels (Fig. S2D), suggesting that the decrease of GSH levels is a specific feature of starvation-induced bulk autophagy.
Starvation induced ABCC1-mediated GSH efflux. To
unravel the causes of GSH decrease in the absence of GSSG increase, we evaluated whether this phenomenon was due to an augmented efflux of the tripeptide toward the extracellular space by measuring the presence of GSH in the cell medium. Figure
1C shows that nutrient starvation produced a significant increase
in extracellular GSH levels after 3 h of starvation in HeLa cells, as well as in HepG2 and H1299 cells (Fig. 1D). The absence of any significant lactate dehydrogenase activity in cell medium (Fig. S3A) indicated that this process was not the result of plasma membrane alteration or necrotic cell death events, but should depend on an active extrusion of GSH from a cellular com-partment. This result became more evident when the cells were treated with 1 mM 6-diazo-5-oxo-L-norleucine (DON), a spe-cific inhibitor of gamma-glutamyltransferase (GGT), an exofa-cially located enzyme that is involved in the degradation of GSH. As expected, DON treated cells showed higher levels of GSH process underlies the pivotal role of GSH in cell signal
transduc-tion pathways.4,5 Total GSH differs among cell types and can
be modulated by environmental factors, such as the presence of heavy metals, glucose concentration and exposure to reactive
oxygen and nitrogen species (ROS and RNS, respectively).6,7
Therefore, GSH has a primary role in antioxidant defense,
xeno-biotic metabolism and cell signaling.4
Autophagy is a well-conserved mechanism consisting of the sequestration of a portion of the cytoplasm that contains pro-teins and organelles into a double-membrane structure, called the autophagosome, and the subsequent delivery to lysosomes for degradation. Autophagy is essential for the maintenance of cel-lular homeostasis during nutrient starvation, being able to pro-vide substrates for ATP production and macromolecule synthesis
by means of degradation of nonessential cellular components.8
Autophagy also contributes to the removal of damaged organ-elles and misfolded or aggregate-prone proteins. Defects in the autophagic machinery can lead to several pathologies such as
neurodegenerative diseases and cancer.9,10 In the last few years
a growing body of evidence has been emerging indicating that
autophagy can be regulated by ROS. Scherz-Shouval et al.11
have demonstrated that ROS are essential for starvation-induced autophagy and specifically target ATG4, a thiol-containing pro-tein involved in the initial step of autophagosome formation, thus affecting its proteolytic function. More recently, it has also been indicated that C12orf5/TIGAR, a protein involved in the glyco-lytic pathway, can limit starvation-induced autophagy by means
of its ability to indirectly suppress ROS production.12 In line with
these observations, we have hypothesized that intracellular redox state of the thiol pool, which strongly depends on GSH, could
drive autophagic response at multiple levels.13 Indeed, a role for
GSH in the regulation of mitochondrial autophagy (mitophagy)
has been discovered in yeast by Daffieu et al.,14 but knowledge is
lacking about the interplay between GSH thiol redox state and the induction/execution of autophagy in mammalian cells. In this work we aimed at clarifying whether intracellular thiols, in particular glutathione, may be implicated in the activation and progression of autophagy.
Results
Starvation-induced autophagy caused a decrease of intracellular GSH levels. A pivotal role for ROS is emerging in the induction
of autophagy, possibly by modulating the redox state of specific
cysteine residues, such as in the case of ATG4.11,13,15 In accordance
with this assumption, it has also been found that mitochondrial autophagy (mitophagy) in yeast relies upon the modulation of
intracellular GSH.14 On the basis of these pieces of evidence, we
investigated whether GSH could be modulated during autophagy and if this can have a role in the self-digestion process under con-ditions of nutrient starvation. As the main experimental model we selected cervix carcinoma HeLa cells grown in HBSS (to mimic nutrient starvation) and analyzed GSH levels by means of HPLC technique. As depicted in Figure 1A, a significant time-dependent decrease in GSH concentration occurred as soon as 3 h from nutrient removal, without any significant changes in the
©2012
Landes
Bioscience.
Do
not
distribute.
caused by cells undergoing apoptosis, we analyzed the activation levels of caspase 9 (CASP9) and caspase 3 (CASP3), two markers of caspase-dependent apoptosis. Figure S4A, S4B and S4C show that no significant caspase activation was detected before 24 h of starvation in HeLa and H1299 cells, and 48 h in HepG2 cell, suggesting that GSH decrement/extrusion was not due to apop-totic cells. To investigate the possibility that other events could contribute to GSH decrease, we analyzed the extent of GSH-protein mixed disulfide (GS-R) by western blot, with a specific antibody directed against S-glutathionylated proteins. As shown in cell medium (Fig. S3B). Interestingly, DON treatment also
led to a decrease of intracellular cysteine (Fig. S3C) and caused an earlier induction of apoptotic cell death, as demonstrated by western blot analysis of caspase activation (Fig. S3D). These results led us to hypothesize that the extrusion of GSH could take place in order to supply the cell with amino acids derived from the GGT-catalyzed degradation of GSH, and could stand for a protective mechanism against nutrient withdrawal. GSH extrusion has been characterized to be a hallmark of apoptosis induction. To exclude the possibility that GSH extrusion was
Figure 1. Nutrient starvation induced Gsh decrease. (A) heLa cells were starved with hBss. At indicated times, cells were harvested and intracellular Gsh and GssG were determined by hPLc analysis. Data are expressed as nmol of Gsh or GssG/mg of proteins and represent the mean ± sD of n = 5 independent experiments (left panel). intracellular Gsh/GssG ratio. *p < 0.05 against medium. **p < 0.01 against medium (right panel). (B) hepG2 and h1299 cells were starved and intracellular Gsh and GssG determined as in (A). Data are expressed as nmol of Gsh or Gssh/mg of proteins and rep-resent the mean ± sD of n = 5 independent experiments. *p < 0.05 against medium. **p < 0.01 against medium. heLa (c), hepG2 and h1299 (D) cells were starved with hBss. At indicated times, 500 μl of cell medium was collected and Gsh determined by hPLc. Data are expressed as nmol Gsh/106 cells and represent the mean ± sD of n = 5 independent experiments. **p < 0.01 against medium.
©2012
Landes
Bioscience.
Do
not
distribute.
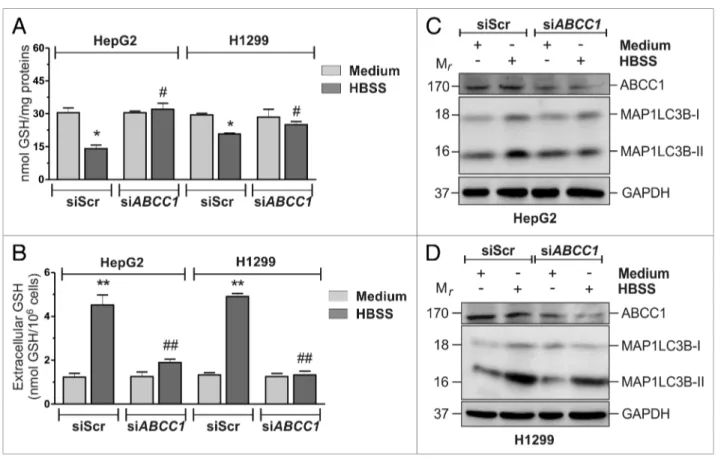
targeting ABCC1 (siABCC1) or a nontargeting siRNA (siScr). Twelve hours after transfection cells were grown in HBSS and intracellular/extracellular GSH levels were measured by HPLC. As shown in Figure 2A and B, ABCC1 knockdown was able to significantly block GSH extrusion. Moreover, results obtained upon western blot analysis of MAP1LC3B (Fig. 2C) and fluo-rescence microscopy detection of EGFP-MAP1LC3B punc-tate distribution, which corresponds to the lipidated form of MAP1LC3B (Fig. 2D), indicated that the activation of autoph-agy was significantly reduced in these conditions, suggesting that intracellular GSH could play a role in the modulation of in Figure S5A, nutrient starvation induced only a slight and
tran-sient increase of GS-R, which could reasonably contribute to the observed GSH decrease in a limited extent. We then analyzed spectrophotometrically the activity of glutamate-cysteine ligase (GCL), the rate-limiting enzyme of GSH de novo synthesis, and we found that starvation induced a time-dependent drop of GCL activity starting from 3 h of nutrient removal (Fig. S5B).
In the search for the mechanisms underlying GSH extrusion, we focused on plasma membrane translocators, such as ABCC1/ MRP1, which have been already identified to mediate GSH
extrusion.17,18 HeLa cells were transfected with either an siRNA
Figure 2. ABcc1-mediated Gsh efflux modulated autophagy in heLa cells. (A) heLa cells were transfected with either a nontargeting siRNA (siscr) or an siRNA targeting ABCC1 (siABCC1). Twelve hours after transfection cells were starved with hBss for 6 h, harvested and intracellular Gsh was determined by hPLc analysis. Data are expressed as nmol of Gsh/mg of proteins and represent the mean ± sD of n = 5 independent experiments. *p < 0.05 against medium. #p < 0.05 against siscr hBss. concomitantly, (B) 500 μl of cell medium was collected and Gsh determined by hPLc. Data are expressed as nmol Gsh/106 cells and represent the mean ± sD of n = 5 independent experiments. **p < 0.01 against medium. ##p < 0.01 against siscr hBss. (c) heLa cells were transfected as in (A). After 3h of starvation, 50 μg of total protein extract were loaded onto each lane for detection of MAP1Lc3B. GAPDh was used as loading control. ABcc1 antibody was used as knockdown control. Western blots are from one experiment representa-tive of three that gave similar results (upper panel). Densitometric analysis of MAP1Lc3B3-ii levels normalized to GAPDh. *p < 0.05 against siscr hBss (bottom panel). (D) heLa cells were seeded onto coverslips, cotransfected with an eGFP-MAP1Lc3B-containing plasmid and with either a nontargeting siRNA (siscr) or an siRNA targeting ABCC1 (siABCC1). Twelve hours after transfection, cells were starved with hBss. After 3 h cells were fixed with 4% paraformaldehyde, images were digitized with a Delta Vision Restoration Microscopy system equipped with an Olympus iX70 fluorescence micro-scope and the percentage of MAP1Lc3B-ii-positive cells were quantified. cells presenting more than 5 dots were considered positive. At least 100 cells per sample were counted from 3 independent experiments. *p < 0.05 against medium. #p < 0.05 against siscr hBss.
©2012
Landes
Bioscience.
Do
not
distribute.
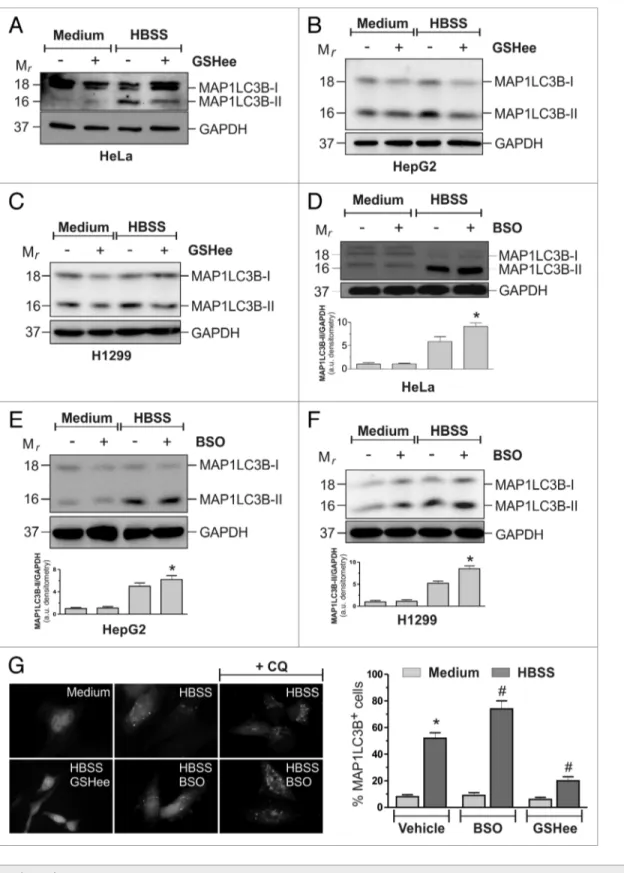
and ROS production, the modulation of intracellular GSH levels seemed to be able to affect the autophagic response under nutri-ent starvation. To dissect this issue, HeLa cells were starved in HBSS supplemented with 10 mM GSH ethyl ester (GSHee) and both the decrease of intracellular GSH and the occurrence of autophagy were evaluated. Figure S7A shows that, under these conditions, starvation-induced GSH decrease, although still operative, was delayed. In particular, up to 12 h of starvation, intracellular GSH levels remained significantly higher in GSHee treated cells. Western blot analysis of MAP1LC3B (Fig. 4A) and fluorescence microscopy analysis of EGFP-MAP1LC3B punctate distribution (Fig. 4G) showed that autophagy was significantly reduced by the addition of 10 mM GSHee, suggesting that the maintenance of GSH levels concurred to counteract autophagy. The ability of GSHee to decrease autophagy was also tested in HepG2 (Fig. 4B) and H1299 (Fig. 4C) cell lines, giving similar results with respect to those obtained in HeLa cells.
We then wondered whether GSHee effects on the modula-tion of autophagy were due to its capability to scavenge ROS. We starved HeLa cells for 1 h and cytofluorometrically analyzed
ROS generation after staining with H2DCF-DA. Figure S7B
shows that GSHee treatment did not result in a decrease of ROS autophagy. Similar results were obtained in the two additional
cell lines tested (Fig. 3), as well as by using the pharmacologi-cal inhibitor of ABCC1, MK571 on HeLa cells (Fig. S6A and
S6B). On the contrary, incubations of HBSS-treated HeLa cells
with 1 mM cystathionine, which has been reported to
trans-inhibit sinusoidal GSH carrier,19 failed to prevent GSH decrease
(Fig. S6A), suggesting that under these experimental conditions ABCC1 was alone responsible for GSH efflux.
To further investigate the role of ABCC1 in GSH efflux and, in turn, in the occurrence of autophagy, we measured GSH levels on the breast carcinoma cell line MCF-7 that expresses extremely
low levels of ABCC1.20,21 MCF-7 cells were starved and GSH
levels, along with ROS production, measured. Figure S6C shows that intracellular GSH levels of MCF-7 cells did not change, thus reinforcing the evidence that ABCC1 played a key role in mediat-ing GSH extrusion. Interestmediat-ingly, ROS were produced similarly to what previously observed in HeLa cells (Fig. S6D), supporting the hypothesis that there was no causal correlation between ROS production and GSH decrease.
GSH modulation influenced autophagic response to nutrient deficiency. Although results so far obtained argued for an absence
of functional relationship between intracellular GSH decrease
Figure 3. ABcc1-mediated Gsh efflux modulated autophagy in hepG2 and h1299 cells. (A) hepG2 and h1299 cells were transfected with either a nontargeting siRNA (siscr) or an siRNA targeting ABCC1 (siABCC1). Twelve hours after transfection cells were starved with hBss for 6 h, harvested and intracellular Gsh was determined by hPLc analysis. Data are expressed as nmol of Gsh/mg of proteins and represent the mean ± sD of n = 5 indepen-dent experiments. *p < 0.05 against medium. #p < 0.05 against siscr hBss. concomitantly, (B) 500 μl of cell medium was collected and Gsh determined by hPLc. Data are expressed as nmol Gsh/106 cells and represent the mean ± sD of n = 5 independent experiments. **p < 0.01 against medium. ##p < 0.01 against siscr hBss. hepG2 (c) and h1299 (D) cells were transfected as in (A). After 3 h of starvation, 50 μg of total protein extract were loaded onto each lane for detection of MAP1Lc3B. GAPDh was used as loading control. ABcc1 antibody was used as knockdown control. Western blots are from one experiment representative of three that gave similar results.
©2012
Landes
Bioscience.
Do
not
distribute.
increase of MAP1LC3B lipidation (Fig. 4D) in HeLa cells, as well as in HepG2 (Fig. 4E) and H1299 (Fig. 4F). To exclude the possibility that the increase in MAP1LC3B-II levels in the presence of BSO was due to a block rather than an increase of the autophagic flux, we treated the cells with 50 μM chloroquine (CQ) a late phase autophagic inhibitor. As shown in Figure 4G, levels, indicating that this was not the mechanism by which it
reduced autophagy activation. Moreover, we depleted the cells of GSH by pretreating them with 1 mM buthionine sulfoximine (BSO), a specific inhibitor of GCL activity, for 12 h, time suf-ficient to reduce GSH levels by about 80% (Fig. S7C). Although unable per se to activate autophagy, BSO induced a much higher
©2012
Landes
Bioscience.
Do
not
distribute.
sulphinilated/sulphonilated (SO2/3H) derivatives when H2O2 is
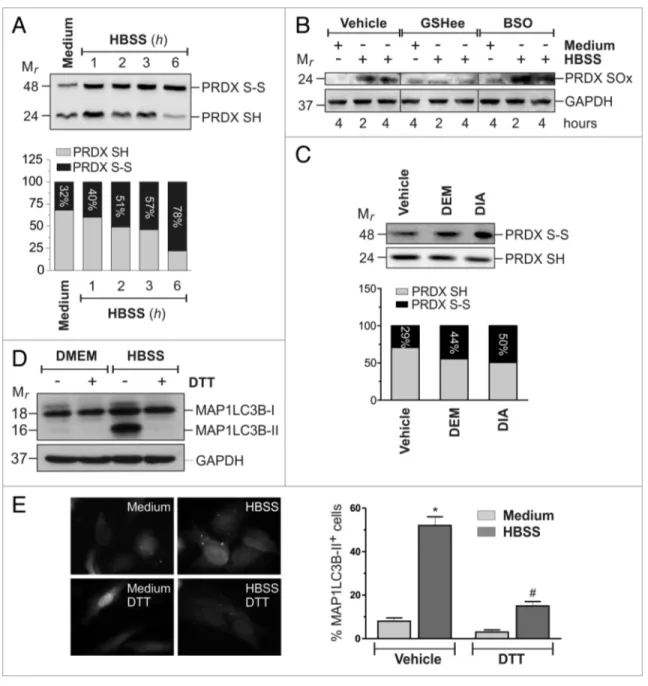
overproduced. HeLa cells were then starved and 2-Cys PRDXs oxidation was analyzed by western blot, using specific antibod-ies. Results depicted in Figure 6A and B show that starvation induced a rapid oxidation of 2-Cys PRDXs to disulfide and/ or hyperoxidized species. Interestingly, pretreatment with BSO caused an enhancement, whereas preincubations with GSHee caused a significant decrease (Fig. 6B). An increase in PRDXs oxidation was also observed in response to GSH redox state alteration elicited by DEM and DIA (Fig. 6C). Taken together, these results indicated a correlation between GSH redox state and the extent of protein thiol oxidation. To confirm the cen-tral role of protein thiol redox state in the activation of auto-phagy, we starved HeLa cells in the presence of 1 mM DTT, a well-known thiol-reducing compound, and further assessed the autophagic extent by western blot analysis of MAP1LC3B (Fig. 6D) and fluorescence microscopy analysis of EGFP-MAP1LC3B punctate distribution (Fig. 6E). Results show that DTT treatment, reduced autophagy activation, although it did not result in ROS scavenging (Fig. S7D), indicating that thiol oxidation was necessary for the induction of autophagy by nutrient starvation.
Discussion
In the last few years the role of ROS and redox imbalance in
star-vation-induced autophagy has been emerging.15 ATG4 has been
recognized to be regulated in its hydrolase activity by reversible
oxidation of Cys81 residue, and GSH has been found to be
indis-pensable for mitophagy occurrence in yeast.11,14 Also, the
antiau-tophagic role of C12orf5 has been correlated with its capability to redirect glucose toward the oxidative branch of the pentose phos-phate pathway, thereby increasing NADPH concentration and enhancing the intracellular reducing power depending on it. In this scenario, we demonstrated that thiol redox state unbalance is involved in the modulation of autophagy. In fact, although ROS are the early inducers of autophagy—whose generation is necessary for the initiation phases of the process—in this work we provided evidence about a modulatory function of a thiol pool for autophagy progression that took place via an ABCC1-dependent GSH extrusion (see scheme in Fig. 7). Although the complete characterization of this event is still in progress, it is reasonable to extend these findings to other cell lines, especially those of tumor origin. Indeed, ABCC1 has been documented to be overexpressed in some tumor histotypes, thereby contributing CQ incubation led to a further increase in MAP1LC3B-II levels,
confirming that GSH depletion increased the autophagic flux in response to nutrient starvation.
GSH redox state alteration induced autophagy. On the basis
of the data obtained, we evaluated whether alterations of GSH redox state could influence the occurrence of autophagy, inde-pendently of growth conditions. To this aim HeLa cells grown in normal conditions were subjected to treatment with a sublethal dose of diamide (DIA), a GSH oxidizing molecule. After 1 h of incubation, DIA-containing medium was removed and cells were grown in DIA-free medium for the following 18 h. Autophagy was then analyzed by western blot of MAP1LC3B (Fig. 5A), as well as fluorescence microscopy detection of EGFP-MAP1LC3B punctate distribution (Fig. 5C). The results show that incuba-tions with DIA induced autophagy. The further increase of MAP1LC3B-II upon incubation with CQ (Fig. 5A and C), con-firmed that DIA induced an increase in the autophagic flux. To further validate these results, we performed the same set of exper-iments with 200 μM diethyl maleate (DEM), a GSH-alkylating and -depleting agent. Figure 5B and C show that, similarly to what already observed with DIA, treatment with DEM induced an increase in the autophagic flux, suggesting that alterations of GSH redox state elicited a self-digestion response. To investigate the pathway involved in DEM and DIA-induced autophagy, we transfected HeLa cells with either an siRNA targeting BECN1 (siBECN1) or a nontargeting siRNA (siScr). Twelve hours after transfection cells were treated with DEM and DIA and auto-phagy was assessed by western blot analysis of MAP1LC3B-II and fluorescence microscopy analysis of EGFP-MAP1LC3B punctate distribution. Results depicted in Figure 5D and E show that BECN1 knockdown significantly reduced MAP1LC3B-II band intensity, suggesting that this protein was involved, at least in part, in the activation of DEM and DIA-induced autophagy.
GSH redox state alteration led to oxidation of protein thi-ols. The absence of GSH redox buffer might allow ROS to
tar-get reactive protein cysteines, thereby causing their oxidation and a redox signal to be propagated within the cell. Although no direct relationship between GSH and ROS emerged from our experiments, it is reasonable that GSH extrusion rendered the intracellular protein-thiols pool “prone” to ROS-mediated oxidation. To verify this issue, we analyzed the oxidation state of 2-Cys peroxiredoxins (2-Cys PRDXs), a class of antioxidant proteins largely expressed within the cells and that are
associ-ated with the autophagosome membrane.13 PRDXs can react
with H2O2 to form an intermolecular disulfide bridge (S-S) or,
Figure 4 (See opposite page). Gsh modulation influenced autophagic response to starvation. heLa (A), hepG2 (B) and h1299 (c) cells were starved with hBss or hBss supplemented with 10 mM Gshee. After 3h of starvation, 50 μg of total protein extract were loaded onto each lane for detection of MAP1Lc3B. GAPDh was used as loading control. Western blots are from one experiment representative of three that gave similar results. heLa (D), hepG2 (e) and h1299 (F) cells were starved with hBss or pretreated with 1 mM BsO for 12 h and then starved with hBss. After 3 h of starvation, 50 μg of total protein extract were loaded onto each lane for detection of MAP1Lc3B. GAPDh was used as loading control. Western blots are from one ex-periment representative of three that gave similar results (upper panel). Densitometric analysis of MAP1Lc3B-ii levels normalized to GAPDh. *p < 0.05 against hBss (bottom panel). (G) heLa cells were seeded onto coverslips, transfected with an eGFP-MAP1Lc3B-containing plasmid and then starved with hBss or hBss supplemented with 10 mM Gshee in presence or in absence of 50 μM chloroquine (cQ). After 3 h cells were fixed with 4% parafor-maldehyde, images were digitized with a cool snap video camera connected to Nikon eclipse Te200 fluorescence microscope and the percentage of MAP1Lc3B-ii-positive cells were quantified. cells presenting more than 5 dots were considered positive. At least 100 cells per sample were counted from 3 independent experiments. *p < 0.05 against medium. #p < 0.05 against hBss.
©2012
Landes
Bioscience.
Do
not
distribute.
a steady-state decrement of free GSH concentration and, conse-quently, to an intracellular redox state shift toward more oxidiz-ing conditions. Active GSH extrusion has been characterized as
an early event occurring during apoptosis,23,24 a cell death
mecha-nism in which intracellular redox changes are pivotal in driving death outcome. However, the absence of detached cells, along with no significant activation of CASP3 and CASP9 before 24 to cancer malignancy. Moreover, both GSH and cysteine export
have been pivotal for reducing extracellular milieu, thereby
pro-moting tumor growth.22 Here, we found that, upon nutrient
deprivation, ABCC1-mediated GSH extrusion strongly con-tributed to intracellular GSH decrease. This process, along with GCL inhibition and, to a smaller extent, the formation of mixed disulfides between GSH and protein sulfhydryls, concurred to
©2012
Landes
Bioscience.
Do
not
distribute.
state changes in response to GSH concentration. Actually, results obtained in this work indicated that S-glutathionylated proteins increased in the first 3 h of starvation; however, other oxidation reactions can occur on cysteine residues of redox-sensitive pro-teins, such as hydroxylation, nitrosylation and hyperoxidation to sulfinic or sulfonic derivatives. In the light of the large number of putative redox-sensitive proteins involved in autophagy processes, which can (or have been already postulated to) undergo redox
modifications.13 results obtained in this work revealed that 2-Cys
PRDXs were oxidized under nutrient starvation, both in terms of disulfide formation and hyperoxidation. This evidence provided a further implication for GSH decrease as an indispensable event for the occurrence of autophagy. Indeed, if on one hand it con-tributes to make thiols prone to oxidation, on the other hand, the maintenance of low GSH levels could inhibit fast reduction of oxidized cysteines back to sulfhydryl moiety and let the auto-phagic stimulus, upstream induced by ROS, being propagated. The accumulation of MAP1LC3B-II upon incubations with the thiol-oxidizing compounds DEM and diamide reinforced the evidence that changes of thiol redox state, as a whole, were piv-otal for the occurrence of autophagy. Work is in progress in order to establish the redox proteome-sensing GSH alterations. Finally, results obtained with MCF-7, combined with many lines of evi-dence demonstrating that the inability of MCF-7 cells to activate autophagy in response to starvation is correlated with very low
expression levels of BECN1,25 and the involvement of BECN1
in DEM and DIA-induced autophagy, allow us to hypothesize that a link between BECN1 and GSH could exist. Although this aspect is beyond the scope of this study, it is worthwhile to note that BCL2 expression levels have been often reported to regulate the intracellular concentration of GSH by means of mechanisms
that should impact on the modulation of GSH transport.26,27
Since BCL2 is the inhibitory interactor of BECN1, it could be hypothesized that low, or undetectable levels of BECN1, such as those measured in MCF-7, resulted in an increased amount of “free” BCL2, which, in turn, led to an inhibition of GSH extru-sion. Work is in progress in our laboratory to dissect putative rela-tionships between BECN1, BCL2 and GSH during autophagy.
Materials and Methods
Materials. Carbonyl cyanide m-chlorophenylhydrazone (CCCP,
C2759) catalase (C40), CHAPS (C3023), chloroquine (CQ, to 36 h of cell growth in HBSS, suggested that, in our
experi-mental conditions, GSH extrusion was not related to apoptotic cells. Along this line, thiol redox unbalance coupled with GSH extrusion could be considered as a phenomenon selected to regu-late a wide range of cell processes generally reregu-lated to cell death/ survival decision. ABCC1-mediated GSH extrusion seems to be a process specific for starvation-induced bulk autophagy. In fact, treatments with both rapamycin (a canonical autophagy inducer) and CCCP (a mitochondrial uncoupler and mitophagy inducer), completely failed to alter GSH levels.
Results obtained in MCF-7 cells, which express an extremely low level of ABCC1 and maintain high intracellular levels of GSH during starvation, supported the central role of ABCC1 in GSH extrusion and its implication in the autophagic process. Indeed, MCF-7 were unable to activate autophagy in response to starvation even if ROS were produced. In order to postulate a functional role for GSH efflux in starvation conditions, it should be taken into consideration that, GSH being a very abundant cellular tripeptide, can serve as cellular storage to get new amino acid constituents. This hypothesis is also strengthened by the results obtained upon the inhibition of GGT activity, which is located in the exofacial side of the plasma membrane and rep-resents the sole enzyme able to hydrolyse GSH at the level of glutamate-cysteine iso-peptide bond. In particular, GGT inhi-bition, performed in HBSS conditions, resulted in an earlier appearance of apoptotic markers, thereby suggesting that GSH extrusion is a protective process taking place when environmen-tal amino acid concentration decreases. Although exciting, this hypothesis needs to be verified, and it is reasonable that it does not completely account for the biological significance of GSH extrusion. Indeed, exogenous administration of glutamine and leucine to HBSS rescued cells from undergoing autophagy, but failed to inhibit GSH efflux (unpublished data), implying that this phenomenon per se is not only designed for amino acid inter-nalization. However, our work indicated that it was fundamental for the occurrence of the self-digestion process. Indeed, inhibi-tion of GSH de novo synthesis, or increase in GSH concentra-tion by treatment with BSO or GSHee, respectively, modulated the kinetics of HBSS-induced autophagy, although they did not affect per se the autophagic rate in normal growth condi-tions. These apparently conflicting results can be reconciled if one considers that GSH redox state is the main determinant of the cellular redox state and that protein sulfhydryls oxidation
Figure 5 (See opposite page). chemical modulation of Gsh redox state per se induced autophagy. heLa cells were treated with either 200 μM DeM for 18 h (A) or with 100 μM DiA for 1 h, washed and maintained in culture in a DiA-free medium for the following 18 h (B). At the end of the experimen-tal time, 50 μg of toexperimen-tal protein extract were loaded onto each lane for detection MAP1Lc3B. GAPDh was used as loading control. 50 μM chloroquine (cQ) was added 2 h before the end of the experimental time. Western blots are from one experiment representative of three that gave similar results. (c) heLa cells were seeded onto coverslips, transfected with an eGFP-MAP1Lc3B-containing plasmid and then treated as in (A and B). At the end of the experimental time, cells were fixed with 4% paraformaldehyde, images were digitized with a cool snap video camera connected to Nikon eclipse Te200 fluorescence microscope and the percentage of MAP1Lc3B-ii-positive cells were quantified. cells presenting more than 5 dots were considered positive. At least 100 cells per sample were counted from 3 independent experiments. *p < 0.05 against medium. (D) heLa cells were transfected with either a nontargeting siRNA (siscr) or an siRNA targeting BECN1 (siBECN1). Twelve hours after transfection cells were treated and MAP1Lc3B levels eval-uated as in (A) and (B). GAPDh was used as loading control. BecN1 antibody was used as knockdown control. Western blots are from one experiment representative of three that gave similar results (upper panel). Densitometric analysis of MAP1Lc3B-ii levels normalized to GAPDh. *p < 0.05 against siscr DeM. #p < 0.05 against siscr DiA (bottom panel). (e) heLa cells were seeded onto coverslips, cotransfected with an eGFP-MAP1Lc3B-containing plasmid and with either a nontargeting siRNA (siscr) or an siRNA targeting BECN1 (siBECN1). Twelve hours after transfection, cells were treated and eGFP-MAP1Lc3B punctate distribution evaluated as in (D). **p < 0.01 against siscr Medium. #p < 0.05 against siscr DeM. ##p < 0.01 against siscr DiA.
©2012
Landes
Bioscience.
Do
not
distribute.
L-α-aminobutyrate (A1879), L-Buthionine-sulfoximine (BSO, B2515), L-glutamate (49621), glutathione reduced ethyl ester (GSHee, G1404), MK571 (M7571), N-acetylcysteine (NAC, A9165), N-ethylmaleimide (NEM, E3876) and pyruvate kinase/ C6628), cystathionine (C7505), diamide (DIA, D3648), diethyl
maleate (DEM, 63219), 6-Diazo-5-oxo-L-norleucine (DON, D2141), dimethyl sulfoxide (DMSO, 154938), 1,3-Dimethyl-2-thiourea (DMTU, D1926), DL-Dithiothreitol (DTT, D0632),
Figure 6. Redox changes of cellular thiol pool impact on starvation-induced autophagy. (A) heLa cells were starved with hBss for the indicated times. Before lysis, reduced thiols were alkylated with 100 mM NeM. Ten μg of total protein extract were loaded onto each lane for detection of the reduced (PRDX-sh) and oxidized (PRDX-s-s) forms of PRDXs. Western blots are from one experiment representative of three that gave similar results. (B) heLa cells were starved with hBss, hBss supplemented with 10 mM Gshee, or they were pretreated with 1 mM BsO for 12 h and then starved with hBss. At indicated times, cells were harvested and 50 μg of total protein extract were loaded onto each lane for detection of hyperoxidized form of PRDXs (PRDX-sOx). GAPDh was used as loading control. Western blots are from one experiment representative of three that gave similar results. (c) heLa cells were treated for 18 h with 200 μM DeM or treated for 1 h with 100 μM DiA and then grown for the following 18 h in a DiA-free medium. At the end of the experimental time, the reduced (PRDX-sh) and oxidized (PRDX-s-s) forms of PRDXs were analyzed as in (A). (D) heLa cells were starved with hBss or hBss supplemented with 1 mM DTT. After 3 h of starvation, 50 μg of total protein extract were loaded onto each lane for detection of MAP1Lc3B. GAPDh was used as loading control. Western blots are from one experiment representative of three that gave similar results. (e) heLa cells were seeded onto coverslips, transfected with an eGFP-MAP1Lc3B-containing plasmid and then starved with hBss or hBss supplemented with 1 mM DTT in presence or in absence of 50 μM chloroquine (cQ). After 3 h cells were fixed with 4% paraformaldehyde, images were digitized with a cool snap video camera connected to Nikon eclipse Te200 fluorescence microscope and the percentage of MAP1Lc3B-ii positive cells were quantified. cells presenting more than 5 dots were considered positive. At least 100 cells per sample were counted from 3 independent experiments. *p < 0.05 against medium. #p < 0.05 against hBss.
©2012
Landes
Bioscience.
Do
not
distribute.
extrusion inhibitors, MK571 and cystathionine were used at the final concentration of 5 μM and 1 mM, respectively. The inhibi-tor of GGT, DON was used at the final concentration of 1 mM. DTT was used at the final concentration of 1 mM. The GSH-oxidizing agent, diamide was used at the final concentration of 100 μM. The GSH-alkylating agent, DEM was used at the final concentration of 200 μM. The late phase inhibitor of autophagy, CQ was used at the final concentration of 50 μM.
Lactate dehydrogenase activity. Cell media were collected
and centrifuged at 1000 × g for 5 min. Supernatants were used for the determination of LDH activity following the oxi-dation of NADH at 340 nm in a 50 mM phosphate buffer, pH 7.4, containing 0.72 mM pyruvate and 0.18 mM NADH.
Data were expressed as nmol of NADH oxidized × min-1 x mg
proteins-1.
Western blots analyses. Total protein lysates were obtained as
previously reported,28 electrophoresed by SDS-PAGE and
blot-ted onto PVDF membrane (Millipore, IPVH-20200). Primary antibodies used were: polyclonal ATG5 (8540) and CASP9 (9502) were from Cell Signaling Technology; anti-BECN1 (sc-11427) was from Santa Cruz; anti-HA (H6908) and anti-MAP1LC3B (L7543) were from Sigma;
anti-PRDXs-SO3 (ab16830) and anti-ABCC1 (ab84320) were from Abcam.
Monoclonal 2 Cys PRDXs (ab16765) was from Abcam; anti-CASP3 (sc-56053), anti-GAPDH (sc-47724) and anti-MFN1 (sc-166644) were from Santa Cruz; anti-GSH (101-A-100) was from Virogen. The specific protein complex, formed upon incu-bation with specific secondary antibodies, was identified using a Fluorchem imaging system (Alpha Innotech, M-Medical) after incubation with ECL Advance chemiluminescence substrate (GE Healtcare, RPN2135).
lactate dehydrogenase (P0294) were from
Sigma-Aldrich. Na2-ATP (10519987001),
NADH (10128023001) and phosphoenol-pyruvate (10108294001) were from Roche Applied Science. Rapamycin (BML-A275-0005) was from Enzo Life Sciences. Goat anti-mouse 1011) and anti-rabbit
(172-1019) and IgG (H+L)-horseradish peroxidase
conjugated were from Bio-Rad. Anti IgG2a (sc-2061) was from Santa Cruz Biotechnology. 2',7'-dihydrodichlorofluorescin
diace-tate (H2DCF-DA, D399) was from Invitrogen. TurboFect™
in vitro Transfection Reagent (R0534) and TurboFect siRNA Transfection Reagent (R1401) were from Thermo Scientific. All other chemicals were obtained from Merck.
Cell Cultures. Human epithelial carcinoma cells HeLa,
human breast adenocarcinoma cell line MCF-7, hepatocellular carcinoma HepG2 and non-small cell lung carcinoma H1299 were purchased from the European Collection of Cell Culture
and grown at 37°C in an atmosphere of 5% CO2. HeLa and
MCF-7 cells were cultured in DMEM containing 25 mM glu-cose (Lonza, BE12-604F), supplemented with 10% fetal bovine serum (Lonza, BE14-801F), 2 mM L-glutamine (Lonza, BE17-605E) and 1,000 U/ml penicillin-streptomycin (Lonza, DE17-602E). HepG2 and H1299 cells were cultured in RPMI1640 (Lonza, BE12-115F), supplemented with with 10% fetal bovine serum (Lonza, BE14-801F) and 1,000 U/ml penicillin-strepto-mycin (Lonza, DE17-602E).
Treatments. Cells were plated at a density of 0.4 × 10⁵ cells/
cm2, unless otherwise indicated. Nutrient starvation was
per-formed by culturing cells in Hank’s Balanced Salt Solution (HBSS) (Lonza, 10-527F). The antioxidants NAC and DMTU were used at the final concentration of 5 mM and 20 mM, respec-tively. The mitochondrial uncoupling agent and mitophagy inducer carbonyl cyanide m-chlorophenylhydrazone (CCCP) was used at the final concentration of 20 μM. The inhibitor of MTOR, rapamycin was used at the final concentration of 500 nM. The irreversible inhibitor of GCL, BSO was used at the final concentration of 1 mM. GSHee was used at the final con-centration of 10 mM (that does not alter cell viability). GSH
Figure 7. Proposed model of starvation effect on Gsh and thiol redox state. Nutrient starva-tion induces an ABcc1-mediated Gsh efflux, which concurs to a steady-state decrement in intracellular Gsh levels. Gsh decrease alters the cellular redox environment, which, in turn, favors protein thiol oxidation by ROs and lets the cells be primed for autophagy commitment. extruded Gsh is processed by exofacially located GGT and its amino acid constituents are taken up by the cell, thereby contributing to the main-tenance of its viability in conditions of nutrient deficiency. The ability of thiol-oxidizing agents DeM and diamide to induce autophagy per se, along with the complete rescue of its occurrence achieved upon pretreatment with the reducing compound DTT, reinforced the evidence that changes of the thiol redox state were fundamen-tal for the correct occurrence of autophagy.
©2012
Landes
Bioscience.
Do
not
distribute.
fluorescence intensities of DCF, formed by the reaction of
H2DCF-DA with ROS, were analyzed cytofluorometrically by
recording FL-1 fluorescence.
Glutamate-cysteine ligase activity. Cells were lysed by
son-ication in 0.1 M TRIS-HCl, pH 8, containing 5 mM MgCl2
and 2 mM DTT and centrifuged at 12,550 × g for 30 min. Supernatants were used for the determination of GCL activ-ity following the oxidation of NADH at 340 nm in 0.1 M
TRIS-HCl, pH 8, containing 150 mM KCl, 5 mM Na2-ATP,
2 mM phosphoenolpyruvate, 10 mM L-glutamate, 10 mM
L-α-aminobutyrate, 20 mM MgCl2, 2 mM Na2-EDTA, 0.2 mM
NADH and 17 μg of pyruvate kinase/lactate dehydrogenase
Data were expressed as nmol of oxidized NADH × min-1 × mg
proteins-1.
Protein determination. Protein concentrations were
deter-mined by the method of Lowry et al.32
Data presentation. All experiments were done at least three
different times unless otherwise indicated. The results are pre-sented as means ± SD. Statistical evaluation was conducted by ANOVA, followed by Bonferroni’s test. Comparisons were con-sidered significant at p < 0.05.
Disclosure of Potential Conflicts of Interest
No potential conflicts of interest were disclosed.
Acknowledgments
This work was partially supported by grants from Associazione Italiana per la Ricerca sul Cancro (AIRC, IG 10636); Ministero dell’Istruzione, dell’Università e della Ricerca (MIUR).
Note
This article is dedicated to Prof. Giuseppe Rotilio on the occa-sion of his 72th birthday.
Supplemental Materials
Supplemental materials may be found here:
www.landesbioscience.com/journals/autophagy/article/ 22037
Measurement of PRDXs redox state. The measurement of
PRDXs redox state was performed as described by Cox et al.29
Briefly, collected cells were resuspended in alkylation buffer (40 mM HEPES, 50 mM NaCl, 1 mM EGTA, protease inhibi-tors, pH 7.4, 10 mg/ml catalase, 100 mM NEM), incubated for 10 min at room temperature and then lysed by addition of CHAPS at the final concentration of 1% (v/v). PRDXs redox forms were then separated on 10% SDS-PAGE in nonreducing loading buffer and blotted onto PVDF membrane. Monoclonal anti-2 Cys PRDXs was used as primary antibody.
Measurement of glutathione. Intracellular and
extracellu-lar GSH and GSSG, and intracelluextracellu-lar cysteine were assayed by
HPLC as described previously.30
Cell transfections. Cells were transfected with an
EGFP-MAP1LC3B-containing plasmid,31 kindly provided by Prof.
Francesco Cecconi, Department of Biology, University of Rome “Tor Vergata,” and PARK2-HA-containing plasmid, kindly pro-vided by Dr. Gian Maria Fimia, National Institute for Infectious Disease “L. Spallanzani” IRCCS, Rome, using TurboFect™ in vitro Transfection Reagent (R0534, Thermo Scientific) fol-lowing the manufacturer’s instruction. Knockdown of ABCC1,
ATG5 and BECN1 was performed by transfecting the cells with
ad hoc designed siGENOME SmartPool small interference RNA (siRNA) (Thermo Scientific), using TurboFect™ siRNA Transfection Reagent (Thermo Scientific) following the manu-facturer’s instruction. Controls were transfected with a scramble siRNA duplex (Santa Cruz Biotechnology, siScr), which does not present homology with any other human mRNAs.
Fluorescence microscopy analyses. Cells expressing
EGFP-MAP1LC3B were fixed with 4% paraformaldehyde and visual-ized by fluorescence microscopy. Images of cells were digitvisual-ized with a Delta Vision Restoration Microscopy System (Applied Precision, Inc.) equipped with an Olympus IX70 (Olympus Microscopy) fluorescence microscope.
ROS evaluation. Thirty minutes before the end of the
experi-mental time, cells were incubated with 50 μM H2DCF-DA
at 37°C, then washed and resuspended in ice-cold PBS. The
References
1. Forman HJ, Zhang H, Rinna A. Glutathione: overview of its protective roles, measurement, and biosynthesis. Mol Aspects Med 2009; 30:1-12; PMID:18796312; http://dx.doi.org/10.1016/j.mam.2008.08.006 2. Collet JF, Messens J. Structure, function, and
mecha-nism of thioredoxin proteins. Antioxid Redox Signal 2010; 13:1205-16; PMID:20136512; http://dx.doi. org/10.1089/ars.2010.3114
3. Meister A. Glutathione metabolism and its selec-tive modification. J Biol Chem 1988; 263:17205-8; PMID:3053703
4. Filomeni G, Rotilio G, Ciriolo MR. Disulfide relays and phosphorylative cascades: partners in redox-mediated signaling pathways. Cell Death Differ 2005; 12:1555-63; PMID:16151458; http://dx.doi. org/10.1038/sj.cdd.4401754
5. Dalle-Donne I, Rossi R, Giustarini D, Colombo R, Milzani A. S-glutathionylation in protein redox regulation. Free Radic Biol Med 2007; 43:883-98; PMID:17697933; http://dx.doi.org/10.1016/j.freerad-biomed.2007.06.014
6. Powell LA, Warpeha KM, Xu W, Walker B, Trimble ER. High glucose decreases intracellular glutathione concentrations and upregulates inducible nitric oxide synthase gene expression in intestinal epithelial cells. J Mol Endocrinol 2004; 33:797-803; PMID:15591036; http://dx.doi.org/10.1677/jme.1.01671
7. Freedman JH, Ciriolo MR, Peisach J. The role of gluta-thione in copper metabolism and toxicity. J Biol Chem 1989; 264:5598-605; PMID:2564391
8. Rabinowitz JD, White E. Autophagy and metabolism. Science 2010; 330:1344-8; PMID:21127245; http:// dx.doi.org/10.1126/science.1193497
9. Levine B. Cell biology: autophagy and cancer. Nature 2007; 446:745-7; PMID:17429391; http://dx.doi. org/10.1038/446745a
10. Levine B, Kroemer G. Autophagy in the pathogenesis of disease. Cell 2008; 132:27-42; PMID:18191218; http://dx.doi.org/10.1016/j.cell.2007.12.018 11. Scherz-Shouval R, Shvets E, Fass E, Shorer H, Gil
L, Elazar Z. Reactive oxygen species are essential for autophagy and specifically regulate the activity of Atg4. EMBO J 2007; 26:1749-60; PMID:17347651; http:// dx.doi.org/10.1038/sj.emboj.7601623
12. Bensaad K, Cheung EC, Vousden KH. Modulation of intracellular ROS levels by TIGAR controls autophagy. EMBO J 2009; 28:3015-26; PMID:19713938; http:// dx.doi.org/10.1038/emboj.2009.242
13. Filomeni G, Desideri E, Cardaci S, Rotilio G, Ciriolo MR. Under the ROS…thiol network is the princi-pal suspect for autophagy commitment. Autophagy 2010; 6:999-1005; PMID:20639698; http://dx.doi. org/10.4161/auto.6.7.12754
14. Deffieu M, Bhatia-Kissová I, Salin B, Galinier A, Manon S, Camougrand N. Glutathione participates in the regulation of mitophagy in yeast. J Biol Chem 2009; 284:14828-37; PMID:19366696; http://dx.doi. org/10.1074/jbc.M109.005181
15. Azad MB, Chen Y, Gibson SB. Regulation of auto-phagy by reactive oxygen species (ROS): implications for cancer progression and treatment. Antioxid Redox Signal 2009; 11:777-90; PMID:18828708; http:// dx.doi.org/10.1089/ars.2008.2270
16. Tanaka A, Cleland MM, Xu S, Narendra DP, Suen DF, Karbowski M, et al. Proteasome and p97 mediate mitophagy and degradation of mitofusins induced by Parkin. J Cell Biol 2010; 191:1367-80; PMID:21173115; http://dx.doi.org/10.1083/ jcb.201007013
©2012
Landes
Bioscience.
Do
not
distribute.
28. Filomeni G, Cerchiaro G, Da Costa Ferreira AM, De Martino A, Pedersen JZ, Rotilio G, et al. Pro-apoptotic activity of novel Isatin-Schiff base copper(II) complexes depends on oxidative stress induction and organelle-selective damage. J Biol Chem 2007; 282:12010-21; PMID:17327230; http://dx.doi.org/10.1074/jbc. M610927200
29. Cox AG, Winterbourn CC, Hampton MB. Measuring the redox state of cellular peroxiredoxins by immu-noblotting. Methods Enzymol 2010; 474:51-66; PMID:20609904; http://dx.doi.org/10.1016/S0076-6879(10)74004-0
30. Filomeni G, Rotilio G, Ciriolo MR. Glutathione disulfide induces apoptosis in U937 cells by a redox-mediated p38 MAP kinase pathway. FASEB J 2003; 17:64-6; PMID:12424221
31. Kabeya Y, Mizushima N, Ueno T, Yamamoto A, Kirisako T, Noda T, et al. LC3, a mammalian homo-logue of yeast Apg8p, is localized in autophagosome membranes after processing. EMBO J 2000; 19:5720-8; PMID:11060023; http://dx.doi.org/10.1093/ emboj/19.21.5720
32. Lowry OH, Rosebrough NJ, Farr AL, Randall RJ. Protein measurement with the Folin phenol reagent. J Biol Chem 1951; 193:265-75; PMID:14907713 23. Ghibelli L, Fanelli C, Rotilio G, Lafavia E, Coppola
S, Colussi C, et al. Rescue of cells from apoptosis by inhibition of active GSH extrusion. FASEB J 1998; 12:479-86; PMID:9535220
24. Franco R, Cidlowski JA. SLCO/OATP-like transport of glutathione in FasL-induced apoptosis: glutathi-one efflux is coupled to an organic anion exchange and is necessary for the progression of the execution phase of apoptosis. J Biol Chem 2006; 281:29542-57; PMID:16857677; http://dx.doi.org/10.1074/jbc. M602500200
25. Liang XH, Jackson S, Seaman M, Brown K, Kempkes B, Hibshoosh H, et al. Induction of autophagy and inhibition of tumorigenesis by beclin 1. Nature 1999; 402:672-6; PMID:10604474; http://dx.doi. org/10.1038/45257
26. Ortega A, Ferrer P, Carretero J, Obrador E, Asensi M, Pellicer JA, et al. Down-regulation of glutathi-one and Bcl-2 synthesis in mouse B16 melanoma cells avoids their survival during interaction with the vascular endothelium. J Biol Chem 2003; 278:39591-9; PMID:1288152278:39591-9; http://dx.doi.org/10.1074/jbc. M303753200
27. Papadopoulos MC, Koumenis IL, Xu L, Giffard RG. Potentiation of murine astrocyte antioxidant defence by bcl-2: protection in part reflects elevated glutathione levels. Eur J Neurosci 1998; 10:1252-60; PMID:9749779; http://dx.doi.org/10.1046/j.1460-9568.1998.00134.x
17. Cole SP, Deeley RG. Transport of glutathione and glutathione conjugates by MRP1. Trends Pharmacol Sci 2006; 27:438-46; PMID:16820223; http://dx.doi. org/10.1016/j.tips.2006.06.008
18. Beedholm-Ebsen R, van de Wetering K, Hardlei T, Nexø E, Borst P, Moestrup SK. Identification of multidrug resistance protein 1 (MRP1/ABCC1) as a molecular gate for cellular export of cobalamin. Blood 2010; 115:1632-9; PMID:19897579; http://dx.doi. org/10.1182/blood-2009-07-232587
19. Fernández-Checa JC, Yi JR, Garcia-Ruiz C, Knezic Z, Tahara SM, Kaplowitz N. Expression of rat liver reduced glutathione transport in Xenopus laevis oocytes. J Biol Chem 1993; 268:2324-8; PMID:8428906
20. Morrow CS, Diah S, Smitherman PK, Schneider E, Townsend AJ. Multidrug resistance protein and glutathione S-transferase P1-1 act in synergy to con-fer protection from 4-nitroquinoline 1-oxide toxic-ity. Carcinogenesis 1998; 19:109-15; PMID:9472701; http://dx.doi.org/10.1093/carcin/19.1.109
21. Faneyte IF, Kristel PM, van de Vijver MJ. Multidrug resistance associated genes MRP1, MRP2 and MRP3 in primary and anthracycline exposed breast cancer. Anticancer Res 2004; 24(5A):2931-9; PMID:15517899 22. Venè R, Castellani P, Delfino L, Lucibello M, Ciriolo
MR, Rubartelli A. The cystine/cysteine cycle and GSH are independent and crucial antioxidant systems in malignant melanoma cells and represent drug-gable targets. Antioxid Redox Signal 2011; 15:2439-53; PMID:21529243; http://dx.doi.org/10.1089/ ars.2010.3830