Dottorato in Ingegneria Strutturale e Geotecnica
MASONRY NONLINEAR RESPONSE:
MODELING AND ANALYSIS OF THE
EFFECTS OF DAMAGING MECHANISMS
Cristina Gatta
XXXI Ciclo - A.A. 2018/2019
Dipartimento di Ingegneria
Strutturale e Geotecnica
PhD Thesis in Structural Engineering
Masonry nonlinear response:
modeling and analysis of the effects of
damaging mechanisms
PhD Candidate:
Cristina Gatta
Advisor :
Co-Advisor :
Prof. Daniela Addessi
Prof. Fabrizio Vestroni
Over the last decades, many efforts were devoted to develop efficient and accurate numerical procedures for the assessment of the structural capacity of masonry constructions. The main difficulties in modeling this type of material are due to its heterogeneous nature. Indeed, masonry is composed by blocks, stones or bricks, connected with or without mortar, whose geometry, mechanical proper-ties and arrangement strongly affect the overall response. Among the available modeling strategies, finite element models appear to be suitable tools to describe the evolution of the nonlinear mechanisms developing in the material under typ-ical loading conditions. Within this framework, macromechantyp-ical models, which consider masonry as an equivalent homogeneous, isotropic or anisotropic medium, are a fair compromise between accuracy and computational burden.
Stemming on the above considerations, this work focuses on the development of constitutive laws involving damage and plasticity inner variables, tailored to the macromechanical analysis of 2D masonry structures. Herein, a new isotropic damage-plastic model, which is an enhanced version of that presented by Addessi et al. (2002), is proposed. This model is able to capture the degrading mechanisms due to propagation of microcracks and accumulation of irreversible strains, as well as the stiffness recovery related to cracks re-closure. Moreover, to account for the variation of the mechanical properties in the different material directions, a novel orthotropic damage model is developed to deal with regular masonry textures. The proposed models are implemented in finite element procedures, where the mesh-dependency problem is efficiently overcome by adopting nonlocal integral formulations. Numerical applications are performed to assess the models capac-ity of describing the material inelastic behavior and comparisons of numerically
are investigated. For this purpose a systematic approach is adopted, based on the evaluation of the frequency response curves of masonry walls. The obtained curves show peculiar characteristics due to the irreversible effect of damage, which leads to degradation of the structural mechanical properties and the related vari-ation of the natural frequencies, which in turn significantly influence the dynamic amplification of the response. The numerical results are also confirmed by shaking table tests performed on tuff masonry walls loaded out-of-plane.
Sono molte le persone che mi sono state accanto durante questi anni di studio e a cui voglio dedicare i miei sentiti ringraziamenti.
Per primi, vorrei ringraziare la Professoressa Addessi ed il Professor Vestroni per tutto il tempo e le energie che mi hanno dedicato. Loro mi hanno guidato in questo percorso ed a loro devo tutto ci`o che ho imparato. Il supporto professio-nale ed umano di entrambi mi spinge ogni giorno a fare meglio.
Ringrazio i miei genitori, mia sorella e mia nonna per essersi sempre presi cura di me e per avermi dato la forza di reagire nei momenti di sconforto.
Ringrazio Eleonora, Maril`u, Marla, Angelo, Enrico e Paolo. Li ringrazio per la loro sincera amicizia, per aver condiviso con me le loro conoscenze e per aver reso pi`u allegre le nostre giornate di lavoro. Loro sono stati un ulteriore regalo di questo dottorato.
Vorrei anche ringraziare i miei compagni di corso di dottorato, perch`e insieme abbiamo raggiunto tanti piccoli traguardi. Vorrei dedicare un pensiero particolare a Giulia, in quanto in lei ho trovato un’amica.
Infine ringrazio Valerio, perch`e mi spinge a credere di pi`u in me stessa e perch`e lui vive con me le mie ansie e le mie gioie.
First of all, thanks to Professor Addessi and Professor Vestroni for the time and energy that they dedicated to me. They guided me and I owe them everything I learned. Their professional and human support spurs me every day to do better.
I thank my parents, my sister and my grandmother for always taking care of me and for giving me the strength to react in discouragement times.
I would like to express my gratitude to Eleonora, Maril`u, Marla, Angelo, Enrico and Paolo. I thank them for their honest friendship, for sharing their knowledge with me and for making our days of work more cheerful. They were a further gift from this PhD course.
I would also like to thank all PhD students of my doctorate program, as together we achieved several small goals. I dedicate a special thought to Giulia, because she became my friend.
Finally, I thank Valerio. He provokes me to believe more in myself and he lives with me my anxieties and my joys.
1 Introduction 1
1.1 Motivations and objectives . . . 1
1.2 Organization of the thesis . . . 7
2 Masonry mechanical response 9 2.1 Constituent materials mechanical response . . . 9
2.1.1 Mortar and units . . . 9
2.1.2 Unit-mortar interface . . . 13
2.2 Masonry composite material . . . 19
2.2.1 Tests on small assemblages . . . 20
2.2.2 Tests on full-scale masonry elements . . . 28
2.3 Summary . . . 36
3 Modeling approaches for masonry structures 38 3.1 FEM based approaches . . . 38
3.1.1 Micromechanical models . . . 39 3.1.2 Macromechanical models . . . 44 3.1.3 Multiscale models . . . 48 3.2 Other approaches . . . 52 3.2.1 Limit analysis . . . 52 3.2.2 Macroelement method . . . 57
3.2.3 Discrete element method . . . 59
4.1.1 Strain equivalence principle . . . 65
4.1.2 Energy equivalence principle . . . 66
4.2 Damage-plastic model . . . 66
4.2.1 Damage model . . . 68
4.2.2 Plasticity model . . . 72
4.2.3 Nonlocal regularization . . . 81
4.3 Computational aspects . . . 82
4.3.1 Finite element formulation . . . 82
4.3.2 Solution algorithm . . . 84
4.4 Model validation . . . 88
4.4.1 Ispra walls simulation . . . 88
4.4.2 Pavia wall D simulation . . . 92
4.5 Summary . . . 94
5 Orthotropic damage model 95 5.1 Anisotropic damage models: main concepts . . . 96
5.2 Damage model . . . 99
5.2.1 Damage limit surface . . . 102
5.2.2 Evolution laws for damage variables . . . 105
5.2.3 Transformation rules . . . 107
5.3 FE formulation and nonlocal regularization . . . 107
5.4 Validation examples . . . 108
5.4.1 Uni-axial stress-strain response . . . 108
5.4.2 Bi-axial test on masonry brickwork . . . 112
5.4.3 Shear walls . . . 114
5.5 Effect of texture on the level of orthotropy . . . 119
5.6 Summary . . . 123
6 Characterization of masonry walls dynamic behavior 125 6.1 Main features of frequency response curves . . . 126
6.2.3 Response to earthquake excitations . . . 141
6.3 Response of tuff masonry walls: experimental test and numerical simulation . . . 147
6.3.1 Experimental test . . . 147
6.3.2 Experimental-numerical comparison . . . 154
6.4 Summary . . . 157
7 Conclusive remarks 159 7.1 Summary and main contributions . . . 159
7.2 Suggests for future work . . . 162
A On the construction of the damage limit surface 163 A.1 Geometry of the damage surface . . . 165
A.2 Derivation of elliptic cone equation . . . 167
A.3 Derivation of ellipsoid equation . . . 170
1.1 Stone masonry textures. . . 1 1.2 Brick masonry textures. . . 2 1.3 Failure mechanisms of masonry structures. . . 3 1.4 Typical out-of-plane failure cracking: (a) and (b) vertically
span-ning one-way walls and (c) two-way spanspan-ning walls. . . 4 1.5 Griffith et al. (2004): pushover curves of (a) uncracked and (b)
pre-cracked walls loaded out-of-plane (adapted by Minga et al., 2018). 5 1.6 Frumento et al. (2009): in-plane response of double-fixed masonry
walls undergoing (a) flexural and (b) shear failure modes. . . 5
2.1 Typical correlation between tensile and compressive strength of mortar. . . 11 2.2 McNary and Abrams (1985): variation of Young’s modulus with
vertical and confining stresses for type M mortar. . . 11 2.3 McNary and Abrams (1985): (a) variation of compressive strength
with confining pressure p for type M mortar; (b) measured bi-axial interaction diagram for brick specimens. . . 12 2.4 Van der Pluijm (1997): (a) test specimen in direct tension, (b) net
bond surface of the wall extrapolated from the specimen. . . 13 2.5 Van der Pluijm (1997): detailed view of a specimen in the 4-point
bending test arrangement. . . 14 2.6 Experimental set-up for shear test from (a) Van der Pluijm (1993)
and (b) Van der Pluijm et al. (2000). . . 15 2.7 Van der Pluijm (1993): (a) shear stress-shear displacement curves
tan Ψ with the confining pressure p (adapted by Louren¸co, 1996). 17 2.9 Failure mechanisms for combined normal and shear stress: (a) bond
failure, (b) failure in mortar and bond failure, (c) bond failure and tensile failure of units and (d) diagonal tensile failure of units. . . 18 2.10 Shear response of bed joints: (a) correlation between fracture
en-ergy GII
f and normal applied stress p (Van der Pluijm et al., 2000); (b) typical response curve for four-cycle shear test (Atkinson et al., 1989). . . 19 2.11 Tensile behavior: (a) typical response under uni-axial tension;
fail-ure paths (Backes, 1985) with (b) cracks passing along mortar and bricks and (c) zigzag type for load parallel to bed joint orientation. 21 2.12 Drysdale and Hamid (1982): failure modes obtained for different
values of the ϑ angle between applied tensile stress and bed joints orientation. . . 21 2.13 Tensile strength obtained by Drysdale and Hamid (1982). . . 22 2.14 Page (1983): failure modes for uni-axial tensile loads with different
orientation ϑ from the bed joint direction. . . 22 2.15 Stress-strain curves for bricks, mortar and masonry prisms: (a)
weak mortar (Binda et al., 1996) and (b) strong mortar (Kaushik et al., 2007). . . 24 2.16 Compressive behavior for uni-axial load normal to bed joints: (a)
state of stress in masonry prisms and (b) failure mode. . . 24 2.17 Page (1981, 1983): failure modes for uni-axial compressive loads
with different orientation ϑ from the bed joint direction. . . 25 2.18 (a) principal stress axes (blue) and material axes (red); (b)
arrange-ment for bi-axial tests performed by Page (1981, 1983). . . 26 2.19 Masonry bi-axial strength: experimental results of Page (1981,
1983) for (a) ϑ = 0°, (b) ϑ = 22.5°and (c) ϑ = 45°; (d) com-parison between strength envelopes obtained for clay brick (light and dark gray lines) and sand plast (black line) masonry (ϑ = 0°). 27
control. . . 29 2.21 Raijmakers-Vermeltfoort panels: global response curves. . . 29 2.22 Raijmakers-Vermeltfoort panels: experimental crack patterns for
different levels of vertical compression p. . . 30 2.23 Schematic view of the test set-up for Ispra walls. . . 31 2.24 Ispra high wall: (a) experimental cyclic load-displacement global
curve and (b) experimental failure path from Anthoine et al. (1995). 32 2.25 Ispra low wall: (a) experimental cyclic load-displacement global
curve and (b) experimental failure path from Anthoine et al. (1995). 33 2.26 Geometry and loading conditions of the two-story masonry building
tested by Magenes et al. (1995) (dimensions in [cm]). . . 34 2.27 Sequence of the displacement applied at the second floor level. . . 35 2.28 Base shear-second floor displacement curves for (a) wall D and (c)
wall B; experimental failure paths for (b) wall D and (d) wall B. . 36
3.1 Micromodeling technique: (a) detailed micromodel, (b) simplified micromodel with potential crack in the units and (c) simplified micromodel. . . 40 3.2 Multisurface interface model: (a) monotonic model proposed by
Louren¸co and Rots (1997) and (b) auxiliary yield surfaces for the cyclic model of Oliveira and Louren¸co (2004). . . 41 3.3 Sacco and Toti (2010): (a) damaging states of brick-mortar
inter-face and (b) detailed micromodeling of a masonry arch. . . 42 3.4 Minga et al. (2018): domain decomposition and parallel processor
technique. . . 43 3.5 Macromodeling technique: masonry as a homogeneous material. . 44 3.6 Tower located in Luisa: (a) real structure and (b) FE model used
by Valente and Milani (2016). . . 45 3.7 Betti and Vignoli (2011): FE model of the Basilica of Santa Maria
3.9 Multiscale technique: transition between macro and microscale. . 49 3.10 Typical convergence of the homogenized properties as function of
the RVE size obtained by imposing different boundary conditions. 50 3.11 Cosserat deformation modes for two-dimensional case. . . 51 3.12 Sacco (2009): scheme of the nonlinear homogenization procedure
based on the TFA technique. . . 52 3.13 Carocci (2001): failure mechanism of outside walls without (a) cross
connections and with (b) cross connections. . . 54 3.14 Associative (a) flow rule and non-associative (b) flow rule with null
dilatancy. . . 54 3.15 Baggio and Trovalusci (2000). Collapse load multipliers and
fail-ure mechanisms obtained from: (a) nonlinear limit analysis with arbitrary initial guess, (b) linear limit analysis and (c) nonlinear analysis starting from the solution of (b). . . 55 3.16 Betti and Vignoli (2011): (a) reference case for the limit
analy-sis and (b) lateral wall overturning of the Basilica of Santa Maria all’Impruneta. . . 56 3.17 Equivalent frame method: (a) conventional subdivision of masonry
walls in deformable frame elements and rigid zones and (b) 2D frame element proposed by Liberatore et al. (2017) . . . 58 3.18 Brencich et al. (1998): (a) kinematic and (b) static variables of the
proposed macroelement, (c) example of macroelement mesh with piers, spandrels and rigid zones (gray areas). . . 59 3.19 Alexandris et al. (2004): cracking pattern and collapse
mecha-nism of the model house under the Kalamarata earthquake with (a) PGA=0.54g and (b) PGA=0.8g. . . 61
4.1 Damage Mechanics concepts: (a) RVE, (b) effective area ˜A. . . . 64 4.2 (a) Heterogeneous masonry wall; (b) equivalent homogenized medium. 68 4.3 Damage domains for different values of the damage variables in the
4.5 Damage model: (a) uni-axial cyclic stress-strain law, (b) applied strain history and variation of damage variables. . . 73 4.6 Plane stress state. . . 74 4.7 Drucker-Prager yield function at the first onset of the plastic
pro-cess (α = 0, ζ = 0, ˙ε3Dp= 0): (a) 3D and (b) 2D representation. 75 4.8 Plastic uni-axial stress-strain law: (a) monotonic tensile response
and (b) cyclic response. . . 76 4.9 Damage-plastic model: uni-axial cyclic stress-strain law. . . 81 4.10 Ispra walls: comparison between numerical (black lines) and
experi-mental (gray lines) load-displacement global curves for (a) high and (b) low wall. . . 90 4.11 Ispra high wall: distribution of the tensile damage Dt for the top
displacement value equal to (a) 5 mm and (b) 12.5 mm and (c) experimental failure paths from Anthoine et al. (1995). . . 91 4.12 Ispra low wall: distribution of the tensile damage Dt for the top
displacement value equal to (a) 2 mm and (b) 7.5 mm and (c) ex-perimental failure paths from Anthoine et al. (1995). . . 91 4.13 Pavia wall D: geometry and loading conditions (dimension in [cm]). 92 4.14 Pavia wall D: comparison between numerical (black line) and
ex-perimental (gray line) base shear-second floor displacement curves. 93 4.15 Pavia wall D: (a) experimental crack pattern and (b) distribution
of the tensile damage Dt at the end of the analysis. . . 94
5.1 Cavaleri et al. (2014): experimental (dots) and theoretical (dashed line) correlation between the ratios Young’s modulus-to-Poisson’s coefficient obtained from uni-axial compressive tests normal and parallel to bed joints. . . 96 5.2 Global (x, y) and material (T, N ) axes of the homogenized masonry
material. . . 99 5.3 Failure modes associated to (a) D1t, (b) D2t, (c) D1c, (d) D2c and
5.6 Masonry failure surface idealized by Lishak et al. (2012). . . 104
5.7 Proposed damage limit surface in the Y3 positive semi-space. . . . 104
5.8 Meaningful sections (A-A and B-B in Figure 5.7) of the limit surface.105 5.9 Uni-axial tensile stress-strain laws for different values of ϑ. . . 109
5.10 Uni-axial tensile test: variation of damage associated variables Y1, Y2, Y3 and damage variables D1, D2, D3 for (a) ϑ = 0°, (b) ϑ = 45°, (c) ϑ = 90°. . . 110
5.11 Cyclic test for ϑ = 0°: (a) applied strain history and variation of the damage variables, (b) uni-axial cyclic stress-strain law. . . 111
5.12 Failure surface for ϑ = 0°: comparison between numerical (solid line) and experimental (dots) results from Page (1981, 1983). . . . 113
5.13 Failure surface for ϑ = 22.5°: comparison between numerical (solid line) and experimental (dots) results from Page (1981, 1983). . . . 113
5.14 Failure surface for ϑ = 45°: comparison between numerical (solid line) and experimental (dots) results from Page (1981, 1983). . . . 114
5.15 Schematic of the analyzed shear walls and selected RVE. . . 115
5.16 Distributions of stresses on the RVE deformed configurations (scaled 0.2). . . 117
5.17 Raijmakers-Vermeltfoort panels: comparison between numerical (black lines) and experimental (gray lines) force-displacement response curves. . . 118
5.18 Raijmakers-Vermeltfoort panels: comparison between experimental crack paths (first column) and distributions of damage D2 (second column) and D3 (third column). . . 120
5.19 Masonry textures: (a-c) rectangular blocks and (d,e) square blocks. 121 5.20 RVE running bond (rectangular blocks). . . 122
5.21 RVE english bond (rectangular blocks). . . 122
5.22 RVE stack bond (rectangular blocks). . . 122
5.23 RVE running bond (square blocks). . . 122
(2013) for a nonlinear viscoelastic SDOF (solid and dashed lines de-note stable and unstable solutions, respectively). . . 127 6.3 Lacarbonara and Vestroni (2003): FRCs and restoring force shapes
of the modified Masing oscillator for various values of α parameter. 128 6.4 (a) schematic view of the analyzed wall and adopted FE meshes:
(b) mesh 1 and (c) mesh 2. . . 130 6.5 (a) pushover response curve and (b) tensile damage distributions
for the applied displacement s = 6.6 mm (point A), s = 10 mm (point B) and s = 30 mm (point C). . . 130 6.6 Cyclic load-displacement curves and tensile damage distributions
for two different values of the kinematic hardening parameter (a) Hk = 0.3 E and (b) Hk = 0.7 E. . . 131 6.7 (a) cyclic imposed displacement and (b) response cycles obtained
in correspondence of the same imposed displacement amplitudes. . 132 6.8 Wall frequency response curves for (a) sweep 1 and (b) sweep 2:
elastic response (black lines) and damage-plastic response (green, red and blue lines corresponding to U/g = 0.04, 0.05, 0.06, respec-tively). . . 134 6.9 Response to sweep 1 setting U/g = 0.04: time histories of the
top relative displacement in (a) linear elastic case and (b) damage-plastic case, (c) time variation of the ratio Ω/ω1, (d) time histories of phase angle Φ. . . 136 6.10 Response to sweep 2 setting U/g = 0.04: time histories of the
top relative displacement in (a) linear elastic case and (b) damage-plastic case, (c) time variation of the ratio Ω/ω1, (d) time histories of phase angle Φ. . . 137 6.11 Calculation of the phase angle Φ. . . 138 6.12 FRCs for sweep 2 and for (a) U/g = 0.04 and (b) U/g = 0.06,
and (d) U/g = 0.06. . . 139 6.14 Response to sweep histories with excitation frequency 40 cycles
constant: time histories of the top relative displacement for (a) sweep 1 and (b) sweep 2, setting U/g = 0.04. . . 140 6.15 Comparison between FRCs obtained with different types of sweep
histories and for (a) sweep 1 and (b) sweep 2, setting U/g = 0.04. 140 6.16 L’Aquila earthquake: (a) acceleration history and (b) elastic
re-sponse spectrum (damping value 3%). . . 142 6.17 El Centro earthquake: (a) acceleration history and (b) elastic
re-sponse spectrum (damping value 3%). . . 142 6.18 L’Aquila earthquake: (a, c, e) response displacement time histories
and (b, d, f) their Fourier spectra, (g) evolution of the global dam-age index, (h) variation of maximum response amplitude versus PGA. . . 145 6.19 El Centro earthquake: (a, c, e) response displacement time
histo-ries and (b, d, f) their Fourier spectra, (g) evolution of the global damage index, (h) variation of maximum response amplitude versus PGA. . . 146 6.20 Picture of the tested specimens. . . 148 6.21 Experimental test: (a) schematic of the specimens; (b) base steel
beam; (c) accelerometers for the dynamic identification tests. . . . 149 6.22 Fourier spectra of the acceleration responses to the hammer
im-pacts: (a) M1, (b) M2 and (c) M3 wall. . . 150 6.23 Comparison between the recorded and target input signals. . . 151 6.24 Schematic of experimental set-up. . . 152 6.25 M3 wall: (a) experimental top displacement response and (b) Fourier
spectra of the responses at each run. . . 153 6.26 Experimental response of (a) M2 wall and (b) M1 wall. . . 154 6.27 M3 wall: (a) experimental and numerical top displacement response
director ellipse. . . 166 A.3 Construction phases of the damage surface. . . 168 A.4 Graphical representation of elliptic cone construction. . . 170 A.5 (a) Ellipsoid centered in the cartesian axes system oxyz; (b)
2.1 Summary of bi-axial tests from Dhanasekar et al. (1985). . . 26
4.1 Material parameters adopted in Figures 4.3, 4.4, 4.5 and 4.9;. . . . 70
4.2 Material parameters adopted in Figures 4.7 and 4.9. . . 78
4.3 Predictor-corrector solution algorithm. . . 85
4.4 Ispra panels: material parameters. . . 89
4.5 Pavia wall D: material parameters. . . 93
5.1 Material parameters adopted in Figures 5.9, 5.10 and 5.11. . . 109
5.2 Material parameters for Page panels. . . 112
5.3 Elastic mechanical parameters and sizes of the constituent materials.115 5.4 Elastic mechanical parameters of the homogenized masonry material.118 5.5 Raijmakers-Vermeltfoort panels: material parameters. . . 119
5.6 Elastic parameters of the homogenized masonry material for RVE in Figures 5.20-5.24. . . 123
6.1 Slender panel: material parameters. . . 129
6.2 List of the input sinusoidal waves. . . 151
6.3 M3 wall: material parameters. . . 155
Introduction
1.1
Motivations and objectives
In many countries, masonry structures are a significant part of historical and architectural heritage. This is to due the several advantages that the material offers, such as economy, high fire resistance and recyclability. However, as known, a complex mechanical response emerges due to the heterogeneous nature of the material, composed of units, stones or bricks, connected with o without mortar, whose geometry, mechanical properties and arrangement strongly affect the overall response. A large variety of textures can be found for both stone and brick masonry walls. Based on the stones arrangement in the construction and degree of refinement in the surface finish, stone masonry can be broadly classified in two categories: Rubble or Ashlar masonry. The former is obtained by adding undressed or roughly dressed stones in the mortar, the last is built from accurately dressed stones with uniform and fine joints, as shown in Figures 1.1(a-c).
(a) Rubble (b) Ashlar (c) Coursed ashlar
Several types of brick masonry can also be found, depending on the stretchers (bricks laid flat with the long face parallel to the wall) and headers (bricks laid flat with their width at the face of the wall) arrangement. Figures 1.2(a-d) show some examples of the most widespread textures: running, flemish, english and header bond texture, respectively.
(a) Running bond (b) Flemish bond
(c) English bond (d) Header bond
Figure 1.2: Brick masonry textures.
Despite different behavior can occur depending on the adopted masonry ty-pology, some recurrent features can be identified. During the deformation process under typical loading conditions, complex nonlinear mechanisms start and evolve, making masonry global response strongly nonlinear, non-symmetric, with the pos-sible presence of strain-softening branches. Irreverpos-sible strains develop mainly due to the activation of friction mechanisms at interface between mortar and units and, due to the components brittle nature, microvoids and microcracks appear and propagate in the mortar joints, in the bricks and at the interfaces, leading to formation of macro-fractures and, eventually, to masonry collapse. Furthermore,
in cases of regular texture, as those sketched in Figure 1.2, mortar joints act as plane of weakness and, consequently, directional mechanical properties emerge with strongly anisotropic responses.
At structural level, masonry buildings exhibit good resistance to vertical loads, while they perform badly against horizontal actions. This is testified by their high seismic vulnerability, mainly due to the low material tensile strength and often inadequate structural configurations. Figures 1.3(a-c) show the main collapse mechanisms identified on the basis of earthquake’s effects on masonry structures, namely crumbling, out-of-plane and in-plane failures. When proper masonry tex-tures are adopted, thus preventing the crumbling phenomenon, it was widely assessed that out-of-plane collapse mechanisms are the most frequent. The walls loaded normally to their plane undergo flexure and, when internal stresses exceed the material strength, crack patterns develop with directions depending on the edge restraint positions. In fact, boundary conditions are a relevant point, as the response can involve one-way bending or two-way bending, as depicted in Figures 1.4(a-b) and (c), respectively.
(a) Masonry crumbling (b) Out-of-plane failure (c) In-plane failure
Figure 1.3: Failure mechanisms of masonry structures.
Experimental tests on uncracked masonry panels loaded out-of-plane (Griffith et al., 2004, 2007) carried out a typical load-displacement curve. This results characterized by an initially linear elastic branch until tensile strength is reached, followed by a nonlinear phase, where cracks start and evolve. With increasing deformation the wall becomes fully cracked and, under cyclic loadings, behaves as a rocking block. Figures 1.5(a) and (b) compare the load-displacement curves of
cracking support edge
(a) (b) (c)
Figure 1.4: Typical out-of-plane failure cracking: (a) and (b) vertically spanning one-way walls and (c) two-way spanning walls.
simply supported ‘uncracked’ and ‘precracked’ one-way vertically spanning walls experimentally obtained by Griffith et al. (2004). Here, the benefit of the mate-rial tensile strength can be noted, as the maximum force of the uncracked panel is much higher than that of the corresponding cracked wall. Traditional force-based approach relates the seismic resistance of fully cracked walls to the maximum force at the threshold of overturning, determined from simple equilibrium con-ditions. In contrast, recent research showed that dynamically loaded walls can sustain accelerations higher of their ‘quasi-static’ resistance, thus leading to the development of displacement-based methods, which define the seismic resistance of the walls on the basis of the maximum sustainable displacement. However, as underlined by Abrams et al. (2017), response to out-of-plane actions is affected by many factors: the level of the axial forces, size and position of openings, quality of connections between the structural elements and, also, by the in-plane damage of the adjacent walls. In-plane failure can involve sliding of mortar joints, diagonal cracking bands or damaged zones located at the corners of the panels, depending on geometry, loading and boundary conditions (Anthoine et al., 1995; Frumento et al., 2009). Typically, flexural responses (Figure 1.6(a)) lead to cyclic load-displacement curves resulting in ‘S-shape’ cycles, as the response is controlled by opening and subsequent re-closure, under load reversal, of the tensile crack at the ends of the panels. On the contrary, shear failure (Figure 1.6(b)) is associated with a more brittle behavior usually due to the formation of diagonal damaged zones in the central part of the walls.
0 10 20 30 Mid-height deflection [mm] Specimen 1 Specimen 3 0 0.5 1 1.5 2 Lateral force [kN] 2.5 3 3.5 (a) Mid-height deflection [mm] Specimen 1 Specimen 3 -0.1 0.1 0.2 0.3 0.4 Lateral force [kN] 0 0 10 20 30 40 (b)
Figure 1.5: Griffith et al. (2004): pushover curves of (a) uncracked and (b) pre-cracked walls loaded out-of-plane (adapted by Minga et al., 2018).
-60 -40 -20 0 20 40 60 -100 -50 50 100 Force [kN] 0 Displacement [mm] (a) -400 -200 0 200 400 -10 -5 0 5 10 Force [kN] Displacement [mm] (b)
Figure 1.6: Frumento et al. (2009): in-plane response of double-fixed masonry walls undergoing (a) flexural and (b) shear failure modes.
On the basis of the activated failure modes, different strength-stiffness decay and hysteretic dissipation characteristics emerge. These translate in very com-plex dynamic responses, as the evolution of degrading mechanisms modify the dynamic structural properties. In fact, as extensively employed to damage identi-fication and structural health monitoring, onset and propagation of damage leads to degradation of the structural mechanical properties and the related variation of the natural frequencies, which in turn significantly affect the resonant conditions (Toti et al., 2015). Thus, in last decades, many efforts were devoted to understand and predict the complex behavior of masonry in the dynamic field. In particular, shaking table tests (Benedetti et al., 1998; AlShawa et al., 2012; Candeias et al., 2017) on scaled or full-scale prototypes were performed with the aim of assessing structural performances under both seismic actions and harmonic excitations.
To now, many methods and computational tools were proposed to deal with the problem of assessing structural capacity of masonry constructions (see Chapter 3). The choice of the adopted methodology depends on several factors: searched information, computational cost and available input data, just to cite some. Thus, the identification of a unique model with general validity represents a hard, per-haps unrealistic, task. Among the others, finite element approaches appear as at-tractive tools to describe evolution of nonlinear mechanisms evolving in masonry material. In particular, models based on Damage Mechanics allow to describe the degrading effects by making use of the consolidate principles of Continuum Mechanics. These, differently from models based on Fracture Mechanics Theory, do not represent the cracks as embedded in the material, but take into account the degradation phenomena by means of nonlinear constitutive laws involving damage inner variables. Usually, damage models are combined with plasticity formulations, with the purpose to introduce also the effects of irreversible strains and, thus, provide a more realistic description of the material mechanical response in terms of hysteretic dissipation properties.
The aim of this study relies on the above considerations, as it is focused on the modeling and analysis of the effects of degrading mechanisms on the mechanical response of statically and dynamically loaded masonry walls. The main objectives can be summarized as follows:
Development of suitable constitutive laws involving damage and plasticity inner variables to account for strength and stiffness degradation and hys-teretic dissipation typically characterizing masonry response. Based on a macromechanical description of the material, an isotropic damage-plastic model and an orthotropic damage model are proposed to numerically de-scribe behavior of various masonry typologies;
Implementation of the proposed models into efficient finite element proce-dures able to avoid the well-known mesh-dependency drawback emerging in cases of strain-softening behavior;
Analysis of the effects of nonlinear mechanisms on the static and dynamic response of masonry structural elements. Particular attention is devoted to the dynamic characterization of masonry walls by framing dependency of their response on the main properties of the loading history, such as frequency and amplitude.
1.2
Organization of the thesis
The thesis is organized as follows:
Chapter 2 offers on overview of experimental tests performed on masonry and its constituent materials with the aim of identifying recurrent features of the mechanical response.
Chapter 3 describes the available modeling strategies for masonry structures, with particular emphasis to the finite element (FE) approach.
Chapter 4 presents a new isotropic damage-plastic model for the macrome-chanical analysis of 2D masonry structures. First, the constitutive relation-ship and the computation aspects related to the finite element implementa-tion are illustrated. Then, comparison between numerical and experimental outcomes are provided for some masonry panels with the aim of validating the proposed model.
Chapter 5 proposes a modified version of the damage model presented in Chapter 4 with the purpose to account for the anisotropic response of the material. Thus, an orthotropic description of the elastic and inelastic be-havior is introduced. Validation examples are presented, which are chosen to evaluate the model capability to describe the substantial discrepancies among phenomenological properties observed in different material direc-tions.
Chapter 6 moves towards exploration of dynamic response of masonry walls. The effects of nonlinear phenomena, such as damage and plasticity, on the dynamic amplification of the response are analyzed by using a systematic approach based on evaluation of frequency response curves (FRCs). Fur-thermore, shaking table tests performed on tuff masonry walls are described and the experimental outcomes are compared with the numerical results. Chapter 7 summarizes the main contributions and offers overall concluding
Masonry mechanical response
This chapter is aimed at characterization of masonry mechanical response through an overview of experimental investigations. Particular attention is devoted to ma-sonry with regular arrangement of constituent materials, i.e. bricks and mortar, where bed joints act as weak planes. The described tests testify that detailed in-formations about the material properties can be obtained and used to rationally design procedures based on numerical models. First, in section 2.1, the main prop-erties of the constituent materials are discussed. Then, in section 2.2, response of small and large masonry assemblages, as well as of more complex structures, is analyzed with reference to some well-known experimental campaigns.
2.1
Constituent materials mechanical response
Heterogeneous masonry can be decomposed into three components, that is mortar, units and interfaces (representing the interaction behavior between mortar and units). Their main mechanical properties are analyzed in the current section.
2.1.1
Mortar and units
Despite masonry mechanical response can not be simply considered as an average of its constituents, this results strongly affected by strength and deformability characteristics of mortar and units.
their more reliability with respect to tensile and shear tests. Compressive strength of masonry units is usually investigated through standard tests with solid platens. The resulting maximum strengths have to be corrected with proper factors to take into account the restraint effect of the platens. Furthermore, it should be remarked that these tests do not provide information on the post-peak behavior. As concern mortar compressive response, this is usually explored by using cylin-drical and prismatic specimens with resulting compressive strength dependent on water-binder ratio and cement content. Compressive tests allow also to determine deformability characteristics, in terms of Young’s modulus and Poisson ratio, by measuring longitudinal and transversal strains to the load direction. The Young’s modulus (E) is obtained as the slope of the linear part of the stress-strain re-lationship, whereas Poisson ratio (ν) results from the ratio between transversal and longitudinal strains. In general, different characteristics in strength and de-formability are found for units and mortar: the former exhibit a brittle response with high resistance, the last shows a more ductile behavior characterized by low strength.
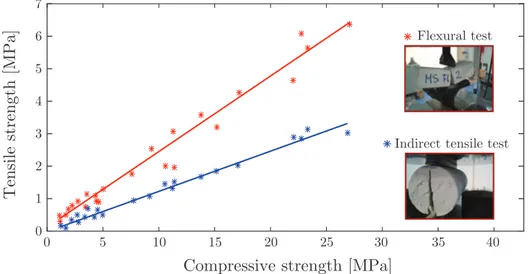
Additionally, indirect tensile and flexural tests are performed to obtain mor-tar properties in terms of tensile strength. Indirect tensile tests are carried out on cylindrical specimens loaded diametrically across the circular cross section, by causing a tensile deformation perpendicular to loading direction. In flexural test a more localized vertical load is applied at the middle part of the specimen. By registering the ultimate load and by knowing the specimen dimensions, tensile strength of the material can be computed, which is usually characterized by lin-ear correlation with compressive strength (see Figure 2.1).
Some attempts were made to relate tensile strength of masonry unit to its com-pressive strength, but difficulties arise due to variety of available sizes, shapes and manufacture processes. In general, very low tensile strength is found with respect to the compressive one, with ratio approximatively varying between 0.03 and 0.1. A significant study concerning mortar and bricks properties can be found in McNary and Abrams (1985). Tri-axial compression tests on four types of mortar, with different cement-to-water ratio (M, S, N, O), were carried out to determine Poisson ratio and Young’s modulus, as well as compressive strength for different values of the lateral confining stresses p. As an example, Figure 2.2 shows variation
10 15 20 25 30 0 1 2 3 4 5 6 7 Flexural test 5 0
Indirect tensile test
Compressive strength [MPa]
Tensile strength
[MPa]
35 40
Figure 2.1: Typical correlation between tensile and compressive strength of mor-tar.
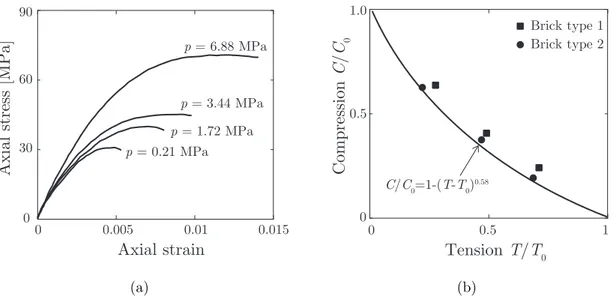
of Young’s modulus with normal and confining stresses for the tested type M mortar. Furthermore, it emerged that higher maximum axial stress and strain were associated to larger confining pressure and the nonlinear response occurred already for small strains (see Figure 2.3(a)).
Young’s modulus
[MPa
]
Vertical stress [MPa]
0 17.24 34.5 51.72 69 10.31 6.88 Confini ng st ress [MPa ] 3.44 1.72 0.69 13.8 ×10³ 6.9 0
Figure 2.2: McNary and Abrams (1985): variation of Young’s modulus with ver-tical and confining stresses for type M mortar.
Regarding units behavior, bi-axial tests made of axial compressive and bilateral tensile stresses were performed on two types of brick with the purpose to determine the splitting strength. Figure 2.3(b) presents the obtained relationship between compressive C and tensile T stress in bricks, nondimensionalized with respect to uni-axial compressive strength C0 and direct tensile strength T0, by showing a concave nonlinear trend of the failure curve obtained as the best fit of experimental data.
Described phenomena testify complexity of the mechanical response of bricks and mortar, whose interaction effects define behavior of masonry composite ma-terial. 0.015 0.005 0.01 0 30 60 90 p = 0.21 MPa p = 3.44 MPa p = 6.88 MPa p = 1.72 MPa Axial strain Axial stress [MPa] 0 (a) 1.0 0.5 0 0 0.5 1 Tension T/T0 Compress ion C / C0 Brick type 1 Brick type 2 C/C0=1-(T-T0)0.58 (b)
Figure 2.3: McNary and Abrams (1985): (a) variation of compressive strength with confining pressure p for type M mortar; (b) measured bi-axial interaction diagram for brick specimens.
2.1.2
Unit-mortar interface
Unit-mortar interface is often regarded as the weakest component of masonry composite material. Thus, joints response was largely investigated under both tensile and shear loads by pointing out peculiar characteristics in terms of strength, fracture energy and stress-strain relationship. All these features are discussed in what follows.
2.1.2.1 Tensile response
Experimental tests showed that tensile failure, usually occurring at the unit-mortar interface, is one of the main cause of collapse of masonry assemblages. Different test set-up, including flexural testing, diametral compression (splitting test) and direct tension testing, were used to characterize tensile behavior. For instance, Van der Pluijm (1997) performed tensile and flexural tests on small ma-sonry assemblages of solid clay bricks and calcium-silicate bricks in combination with different mortar types. Tensile tests were conducted on masonry couplets in displacement control, as schematically shown in Figure 2.4(a).
σ
σ
(a) wall specimen (b)Figure 2.4: Van der Pluijm (1997): (a) test specimen in direct tension, (b) net bond surface of the wall extrapolated from the specimen.
Experimental outcomes highlighted low tensile bond strength, exponential soft-ening branches in the stress-strain relationship with mode I fracture energy GIf ranging from 0.005 to 0.02 Nmm/mm2, according to the unit-mortar combination. This fracture energy GIf was defined as “the amount of energy by unit of area that
is needed to create a crack in which no tensile stresses can be transferred”. Fur-thermore, the bond area of the cracked specimens, the so-called net bond surface, was smaller (on average 35) than the cross sectional area of the specimens and usually located at the samples inner part. This was probably due to the mortar shrinking and the setting of the mortar in its plastic phase. The net bond surface of a common wall was approximately estimated 1.7 times greater than that of the specimen, as two of the four edges are not present, as shown in Figure 2.4(b). Similar considerations were made for the fracture energy and tensile strength of the wall.
The 4-point bending arrangement, sketched in Figure 2.5, was used to perform flexural tests on stack bonded prisms 6 brick high. By measuring specimen deflec-tion, it was possible to push the tests beyond the maximum strength and measure the fracture energy GI
f.
Cross section A-A
LVDTs
A
A
Figure 2.5: Van der Pluijm (1997): detailed view of a specimen in the 4-point bending test arrangement.
Fracture energy values determined by the flexural tests were compared to those obtained by the tensile tests, resulting 2 or 3 times higher. This difference was par-tially explained with reference to the bonding surface shape. Indeed, as pointed out above, a ratio of 1.7 was estimated between the net bond surface of the wall and the couplets, as concerns the tensile test, while the bonding surface of the flexural specimen was almost the same of the wall, because two slices on the head sides of specimens were cut off.
significant role in the overall response of masonry structures, as in many cases the tensile strength of composite material can be regarded as the tensile bond strength between mortar and units.
2.1.2.2 Shear response
Several studies were focused on the shear behavior of bed joints, as shear failure is a dominant collapse mechanism for masonry structures subjected to horizontal loads. Usually, shear actions are accompanied by compression or tension loads. Thus, pure shear modes are alternated to shear-compression and shear-tension modes in experimental investigations.
The main difficulties in performing shear test are related to ability of the test set-up to induce an uniform stress state in joints. Van der Pluijm (1993) de-veloped the test set-up shown in Figure 2.6(a), able to keep a constant normal confining pressure upon shearing. As the test arrangement could not be used to perform shear-tension tests, it was modified (Figure 2.6(b)) in Van der Pluijm et al. (2000) with the purpose to experience masonry assemblages under pro-grammable combination of tension and compression perpendicular to bed joint and, thus, to establish a complete failure envelope for joints and bond interface loaded in shear. Fs Fs Units Actuator Mortar (a) Fn Fs (b)
Figure 2.6: Experimental set-up for shear test from (a) Van der Pluijm (1993) and (b) Van der Pluijm et al. (2000).
In Figure 2.7(a) the experimental outcomes are contained in terms of shear stress τ vs. shear displacement us, obtained by Van der Pluijm (1993) by applying three confining (compressive) stress levels p: −0.1, −0.5 and −1.0 MPa. The overall behavior showed a great similarity with the tensile response, as exponential soft-ening branches appeared. However, the curves did not fall to zero, but became stable at a certain value of the shear stress, namely residual dry friction shear. It can be remarked that, depending on the compression level, different strengths and friction levels were obtained, as well as different slopes of descending branch. Moreover, fracture energy GIIf associated to shear mode (defined as the area under the stress-displacement diagram and the residual dry friction shear level) increased with the compressive stress.
A further significant phenomenon in a shear test is the dilatant behavior, that is the occurrence of a lifting displacement un directed perpendicularly to the imposed shear displacement us (Figure 2.7(b)). It is usually described in terms of dilatancy angle Ψ , defined as:
Ψ = arctanun us . (2.1) 0 0.25 0.5 0.75 1 0 0.5 1 1.5 2 us [mm] p = - 0.1 MPa p = - 0.5 MPa p = - 1.0 MPa τ [N/mm 2 ] (a) p us un (b)
Figure 2.7: Van der Pluijm (1993): (a) shear stress-shear displacement curves for different values of confining stress p; (b) dilatant behavior.
Physically, this is due to a non-smooth cracked surface, so shearing goes together with an uplift, whose maximum value is related to the roughness of the cracked surface. The experimental evidences showed decreasing dilatancy with increasing shear displacement due to the smoothing of the sheared surfaces, as shown in Figure 2.8(a) by the typical evolution of un for increasing values of us at constant confining pressure (un positive if lifting). Furthermore, sensibility to the confining pressure was found, with tan Ψ tending to zero for increasing compression stresses (Figure 2.8(b)). 0 0.2 0.4 0.6 0.8 1 0 0.05 0.1 0.15 0.2 0.25 us [mm] u n [mm] (a) 0 0.2 0.4 0.6 0.8 1.2 0 0.2 0.4 0.6 0.8
confining pressure p [MPa]
tan
Ψ
1
(b)
Figure 2.8: Van der Pluijm (1993): (a) typical variation of normal displacement un with increasing shear displacement us; (b) evolution of dilatancy tan Ψ with the confining pressure p (adapted by Louren¸co, 1996).
Similar trends were observed in Van der Pluijm et al. (2000), where normal stress levels of −0.6, −0.3, 0, 0.05, 0.1, 0.15, 0.2 MPa and increasing shear deformation were applied to masonry consisting of clay bricks (wc-JO96) with general purpose mortar (GPM) and masonry made of calcium silicate blocks (CS-block96) with prefabricated thin layer mortar (TLM). Bond failure at the interface and bond failure combined with tensile failure of bricks were the most frequent mechanisms observed during the tests. However, also other failure modes can take place, as depicted in Figure 2.9(a-d). Referring to the test series where only one failure mode occurred, linear relation between fracture energy, GII
p, was found, as plotted in Figure 2.10(a). Thus, two equations of the regression lines were proposed to identify the lower and upper bound (GII
f in N/mm and p in MPa), respectively: GIIf = −0.02 p + 0.005 , GIIf = −0.14 p + 0.02 . (2.2) (a) (b) (c) (d)
Figure 2.9: Failure mechanisms for combined normal and shear stress: (a) bond failure, (b) failure in mortar and bond failure, (c) bond failure and tensile failure of units and (d) diagonal tensile failure of units.
The bed joint shear failure was investigated also applying cyclic loading. Atkin-son et al. (1989) conduced direct shear experiments on three series of maAtkin-sonry specimens consisting of old clay units, modern clay units and specimens collected from brick walls damaged during the 1987 Whittier earthquake. With reference to old brick specimens, Figure 2.10(b) shows a typical load-relative displacement (between the upper and lower side of the samples) curve obtained from four cycles direct shear test at a constant normal compressive load. A steep growth in the shear load, followed by a decreasing shear resistance and residual strength, can be noted, similarly to the experimental outcomes in Figure 2.7(a). After the first cycle, no further peaks were found and the shear resistance settled on a constant value, which was not affected by the number of cycles. The small peak obtained during the reversal shear in the first cycle appeared at low level of normal loads and it vanished to higher stress values. Similar considerations hold for the other series of tested masonry. On the overall, a much higher peak strength is emerged for new brick assemblages with respect to the old ones, while residual strength was essentially the same. In the investigated normal stress range, it was noticed that both peak and residual strengths could be modeled by a Mohr-Coulomb cri-terion (τ = c + σntanφ) accounting for cohesive strength c and friction angle φ.
However, nonlinear relationship of strength with normal stress can be also found, as obtained by Drysdale et al. (1979) to for high normal stress values.
-1.2 -0.8 -0.4 0 0.4 0 0.05 0.1 0.15 CS-brick90 + 1: :41 2/ 1 2/ CS-brick90 + 1:2:9 CS-block96+ TLM wc-JO96 + 1:1:6 G II p [MPa] f [N/mm] (a) -16 -8 0 10 20 Horizontal load [kN ] -16
Relative horizontal displ. [mm]
-8 0 8 16
(b)
Figure 2.10: Shear response of bed joints: (a) correlation between fracture energy GII
f and normal applied stress p (Van der Pluijm et al., 2000); (b) typical response curve for four-cycle shear test (Atkinson et al., 1989).
2.2
Masonry composite material
Behavior of the composite material is described next with reference to small and large masonry assemblages. Strength characteristics are discussed by pointing out influence of orientation of the applied stresses with respect to bed joints di-rection. Furthermore, attention is devoted to investigate mechanical response of shear walls, as these represent the main reaction systems in masonry building. Monotonic and cyclic loads are considered and effects of geometry, boundary and loading conditions are underlined.
2.2.1
Tests on small assemblages
2.2.1.1 Uni-axial tensile stressMasonry tensile strength is strongly dependent on both mechanical properties of the constituent materials and orientation of the applied stresses with respect to bed joint direction. Failure in tension is usually associated to a localized fracture process, namely cracking of the material, which is reflected into stress-strain rela-tionships with strength-stiffness decay and marked softening branches, as shown in Figures 2.11(a).
In general, for tensile stress normal to bed joints, tensile strength can be consid-ered equal to tensile bond strength between mortar and units. On the contrary, failure is associated to excessive stresses in the bricks when masonry characterized by low strength units and high tensile bond strength are considered.
To characterize the response under tensile stress parallel to bed joints, Backes (1985) tested masonry wallets in direct tension. The test results showed that the crack paths were strongly affected by quality of components: cracks passed along the head joints and the center of the bricks (Figure 2.11(b)) for masonry composed by strong mortar and weak units, while zigzag paths (Figure 2.11(c)) appeared for weak mortar and strong bricks.
Tensile strength and failure modes were also investigated under tensile loads having different orientation ϑ from the bed joint direction. Drysdale and Hamid (1982) performed axial tension tests on masonry samples made of three different types of mortar (mortar M, S and N characterized by increasing compressive strength). Figures 2.12(a) and (b) provide exemplary failure modes obtained for loads parallel and normal to bed joints, characterized by mortar debonding accompanied by tensile failure of bricks and mortar debonding alone, respectively. For tension oriented between 15° and 75° always debonding along combination of bed and head joints appeared, as shown in Figure 2.12(c) with reference to tensile load rotated of 30° from bed joints. Furthermore, Figure 2.13 summarizes all the available data of tensile strength, by clearly highlighting sensitivity to orientation of the applied stress and by showing that bond characteristics of the mortar are not directly related to its strength properties.
σ δ σ (a) (b) (c)
Figure 2.11: Tensile behavior: (a) typical response under uni-axial tension; failure paths (Backes, 1985) with (b) cracks passing along mortar and bricks and (c) zigzag type for load parallel to bed joint orientation.
(a) ϑ=0° (b) ϑ=90° (c) ϑ=30°
Figure 2.12: Drysdale and Hamid (1982): failure modes obtained for different values of the ϑ angle between applied tensile stress and bed joints orientation.
clay brick masonry (more detailed test description will be provided next), whose results are reported in Figure 2.14 in terms of failure crack paths obtained for different values of the ϑ angle between the applied stress and bed joints direction.
0 45 90 Mortar S 0 0.5 1.0 1.5 Mortar M Mortar N ϑ [°] ϑ Ten sile st re ngt h [MPa]
Figure 2.13: Tensile strength obtained by Drysdale and Hamid (1982).
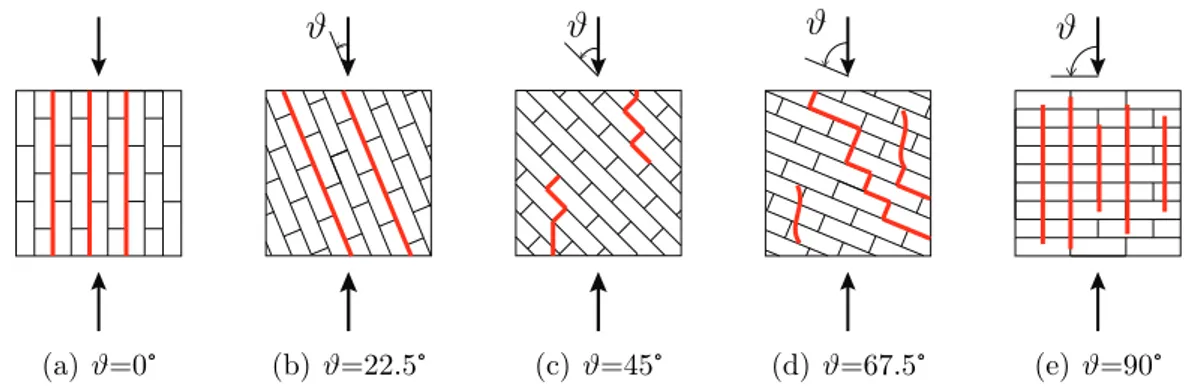
(a) ϑ=0° ϑ (b) ϑ=22.5° ϑ (c) ϑ=45° ϑ (d) ϑ=67.5° ϑ (e) ϑ=90°
Figure 2.14: Page (1983): failure modes for uni-axial tensile loads with different orientation ϑ from the bed joint direction.
2.2.1.2 Uni-axial compressive stress
Compressive strength normal to bed joints is regarded as one of the most rele-vant material property. Experimental studies pointed out its strong dependency on the mechanical properties of the component materials, i.e mortar and units. As remarked in Section 2.1.1, brick response to compressive load usually shows brittle behavior characterized by high strengths, while mortar exhibits a more ductile response with lower resistance. In this case, the response of the composite material is placed between that of its constituents, as Figure 2.15(a) shows with reference to uni-axial compressive tests performed Binda et al. (1996). However, this result can not be considered as general.
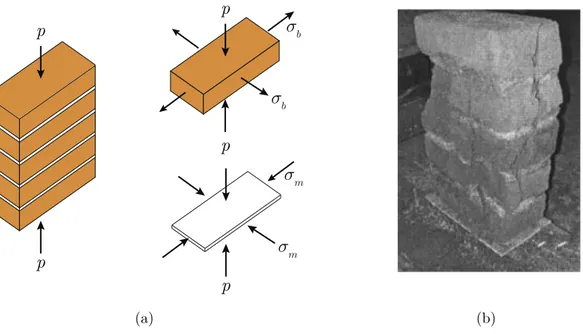
Kaushik et al. (2007) experienced masonry prisms made of four brick types and three mortar grades. Experimental outcomes highlighted that the generally be-lieved compressive behavior of masonry placed between that of bricks and mortar, no longer holds when strength and stiffness of bricks and mortar are comparable, as the stress-strain curves of masonry fall on the lower strength of those corre-sponding constituent materials (Figure 2.15(b)). Anyhow, the different strength and deformable characteristics of units and mortar are precursor of failure, as demonstrated by the pioneer work of Hilsdorf (1969). For instance, considering mortar softer than bricks, as usually happens, a tri-axial compression state in the mortar and a combined compression/bi-axial tension in the brick occur under uni-axial compressive load normal to bed joints (Figure 2.16(a)). Thus, the mortar lateral expansion is confined by the bond and friction between brick and mortar and, as a consequence, vertical cracks appear in the units leading to the specimen collapse (see Figure 2.16(b)).
Less attention was devoted to compressive strength under uni-axial load paral-lel to bed joints. However, the ratio between paralparal-lel and normal compressive strengths usually ranges from 0.2 to 0.8 (Hoffmann and Schubert, 1994). As an example, Page (1981, 1983), within his aforementioned experimental campaign, found a ratio about equal to 0.6.
Further research explored the mechanical response to uni-axial compressive load with different orientations ϑ with respect to bed joints, by obtaining sundry strength values and failure modes (see Figure 2.17).
Brick Masonry Mortar 0 2 4 6 8 10 ε × 10-3 0 2 4 6 8 10 12 14 σ [MPa] (a) 0 4 8 12 16 20 24 28 Mortar Brick Masonry σ [MPa] 6 12 18 24 30 0 ε × 10-3 (b)
Figure 2.15: Stress-strain curves for bricks, mortar and masonry prisms: (a) weak mortar (Binda et al., 1996) and (b) strong mortar (Kaushik et al., 2007).
σb σb p p p p σm σm p (a) (b)
Figure 2.16: Compressive behavior for uni-axial load normal to bed joints: (a) state of stress in masonry prisms and (b) failure mode.
(a) ϑ=0° ϑ (b) ϑ=22.5° ϑ (c) ϑ=45° ϑ (d) ϑ=67.5° ϑ (e) ϑ=90°
Figure 2.17: Page (1981, 1983): failure modes for uni-axial compressive loads with different orientation ϑ from the bed joint direction.
2.2.1.3 Bi-axial stress
To fully characterize masonry mechanical behavior, the response under bi-axial stresses was investigated. Page (1981, 1983), as already mentioned, provided a complete set of experimental data by testing 360 mm square panels, made of half-scale solid clay units arranged in running bond texture. These samples were subjected to bi-axial loads, whose orientation with respect to bed joints direction was varied. Indeed, mortar joints act as planes of weakness and their orientation, with respect to applied stresses, strongly affects overall response. Thus, differently from isotropic materials, failure cannot be described in terms of principal stresses only. By defining material axes T and N , as directions parallel and perpendicular to bed joints (Figure 2.18(a)), failure can be defined either in terms of stress state related to the material axes (σT N = {σT, σN, τT N}T), or in terms of principal stresses σx and σy and orientation ϑ of σx with respect to T -axis (Dhanasekar et al., 1985).
The experimental set-up, schematically shown in Figure 2.18(b), was used to test a total of 180 panels with the bed joints orientation and principal stress ratio summarized in Table 2.1.
Basing on the relative proportion of the applied loads, different failure modes occurred: cracking and sliding in bed and/or head joints for uni-axial compression and collapse for cracking in the joints alone or combined failure in bricks and joint for tension-compression loads. In bi-axial compression cases, typical splitting of
the specimen at mid-thickness, in a plane parallel to its free surface, was found. σy
y
x
T
N
σx σx σyϑ
(a) jack load cell brush platen strain measured (b)Figure 2.18: (a) principal stress axes (blue) and material axes (red); (b) arrange-ment for bi-axial tests performed by Page (1981, 1983).
Stress state ϑ [°] σy/σx ratio Number of panels
Bi-axial 0, 22.5, 45, 1, 2, 4, 10 75 compr.-compr. 67.5, 90 Bi-axial 0, 22.5, 45, -0.5, -0.2, 66 tens.-compr. 67.5, 90 -0.1, -0.03 Uni-axial 0, 22.5, 45, 0 21 compression 67.5, 90 Uni-axial 0, 22.5, 45, ∞ 18 tension 67.5, 90
Table 2.1: Summary of bi-axial tests from Dhanasekar et al. (1985).
Figures 2.19 (a-c) show the experimental data in terms of bi-axial strength for different values of ϑ with the aim of studying the influence of the shear stress τT N in failure surfaces. Anisotropic behavior is markedly shown, as tensile and compressive strengths parallel and normal to bed joints differed. Furthermore, increasing resistance was obtained for bi-axial compressive loads.
-12 -8 -4 -12 -8 -4 0 2 σx [MPa] σ=x σy σx=2 σy σx=4σ y σ y [MPa] 0 2 σ=x σ/4y σ=x σ/2y (a) -12 -8 -4 0 2 σx= σy -12 -8 -4 0 2 σx=2 σy σx=4σy σ=x σ/2y σ=x σ/4y σ y [MPa] σx [MPa] (b) -12 -8 -4 0 2 -12 -8 -4 0 2 σ y [MPa] σx= σy σx=2 σy σx=4σy σ=x σ/2y σ=x σ/4y σx [MPa] (c) -20 -16 -12 -8 -4 0 -20 -16 -12 -8 -4 0 Page (1981)
Naraine and Sinha (1991) Alshebani and Sinha (2000)
σx [MPa]
σ y
[MPa]
(d)
Figure 2.19: Masonry bi-axial strength: experimental results of Page (1981, 1983) for (a) ϑ = 0°, (b) ϑ = 22.5°and (c) ϑ = 45°; (d) comparison between strength envelopes obtained for clay brick (light and dark gray lines) and sand plast (black line) masonry (ϑ = 0°).
Bi-axial tests were conducted also by other researchers. Among others, Ganz and Th¨urlimann (1982) experienced hollow clay brick masonry, Naraine and Sinha (1991) tested half-scale clay brick specimens, while Alshebani and Sinha (2000)
dealt with sand plast (a form of calcium silicate) brick masonry. A comparison between experimental outcomes obtained for clay brick masonry (Page, 1981 and Naraine and Sinha, 1991) and sand plast masonry (Alshebani and Sinha, 2000) is shown in Figure 2.19(d). Here, a reasonable accordance emerges between the enveloped curves extracted for clay brick masonry, except for the ratio between the parallel and normal compressive strength: it was approximately 0.6 and 1.1 in Page (1981) and Naraine and Sinha (1991), respectively. More relevant discrep-ancies emerge for the sand plast envelope, due to the differences in strength and behavior of sand plast and clay bricks. However, on the overall, the shape of all curves is similar.
2.2.2
Tests on full-scale masonry elements
2.2.2.1 Influence of vertical compressive loadRaijmakers and Vermeltfoort (1992) performed deformation controlled tests on masonry shear walls by considering different vertical compression loads. Solid clay bricks, arranged in running bond texture, with dimensions 210 × 52 × 100 mm3 and 10 mm thick mortar were used to built up specimens. Width of 990 mm and height of 1000 mm were obtained by assembling 18 courses, only 16 of which were activated, as the upper and lower courses were clamped in steel beams (see Figure 2.20(a)).
Two-step tests were performed on each wall: first, a vertical uniformly distributed load p was applied and, then, a horizontal monotonically increasing displacement s was imposed through the upper steel beam, keeping bottom and top boundaries horizontal and preventing any vertical movement, as shown in Figures 2.20(a) and (b), respectively.
Four specimens without openings, the so-called JD walls, were tested by imposing three different values of the compression load p, that is 0.3 MPa (≡ 30 kN) for J4D and J5D, 1.21 MPa (≡ 120 kN) for J6D and 2.12 MPa (≡ 210 kN) for J7D. The global response curves (horizontal load vs. horizontal imposed displacement), plotted in Figure 2.21, showed failure loads and brittleness behavior increased with the increasing vertical load. Also vertical reaction was measured during the test, which moved from the middle line of the wall in the direction of the compressed
p 990 1000 70 70 (Dimen sions in [mm ]) (a) s (b)
Figure 2.20: Test phases for Raijmakers-Vermeltfoort panels: (a) vertical precom-pression load and (b) horizontal loading under displacement control.
p = 2.12 MPa Horiz ontal reaction [kN] 20 0 60 40 100 120 80 p = 1.21 MPa p = 0.3 MPa 0.5 1 1.5 2 2.5 3 3.5 4 0
Horizontal imposed displacement [mm]
p = 0.3 MPa Ve rtic al re ac tion [kN] 50 0 150 100
zones. In Figure 2.21 the variation of vertical force with the applied horizontal displacement is shown with reference to the lower compression load. It can be noted an increasing trend due to the dilatant phenomenon.
Finally, Figures 2.22 (a-d) show the experimental crack patterns obtained for all tested panels. Similar collapse mechanisms were found with diagonal cracked band in the middle part of the wall and crushing of the compressed toes. However, marked crack also developed at the bottom and top corners undergoing tensile stresses, as concerns the lower initial vertical load, that is walls J4D and J5D.
Wall J4D (a) p = 0.3 MPa Wall J5D (b) p = 0.3 MPa Wall J6D (c) p = 1.21 MPa Wall J7D (d) p = 2.12 MPa
Figure 2.22: Raijmakers-Vermeltfoort panels: experimental crack patterns for different levels of vertical compression p.
2.2.2.2 Effect of panel geometry
To highlight the effect of geometry on the degrading and collapse mechanisms of shear walls, reference is made to experimental tests performed at the Joint Re-search Centre of Ispra (Anthoine et al., 1995). The test conditions were designed so as to reproduce those of masonry piers under seismic actions. Two panels, characterized by different height/width ratio, were analyzed, assuming the same boundary conditions in which the bottom side of the walls was completely re-strained while the top side was prevented to rotate. These were firstly subjected to a vertical compressive stress of p = 0.6 MPa (≡ 150 kN), kept constant dur-ing the test and, then, a cyclic horizontal displacement history was applied on a steel beam rigidly connected to the top of the walls. The lateral displacement was imposed quasi-statically and characterized by increasing amplitude. Two or three cycles were performed for each amplitude, depending on the level of strength degradation. With reference to Figure 2.23, loading conditions can be summarized as follows: Fv1+ Fv2 = ptW = Fv sv1= sv2 = sv shimposed, Fhmeasured (2.3)
s
hs
v2 Steel beam Re action w allF
hs
v1F
v1F
v2 Act uator Act uator Actuator W HThe specimens were built up with brick units of 250 × 120 × 55 mm3 and 10 mm thick hydraulic lime mortar, arranged in two-wythes thickness English bond pat-tern. The panels overall sizes were: W1 = W2 = W = 1000 mm, H1 = 2000 mm (high wall), H2 = 1350 mm (low wall) and thickness t = 250 mm.
Figures 2.24 and 2.25 show the experimental outcomes for the high and low wall in terms of force-displacement global curve (a) and crack patterns (b). The different trends of the global response curves were a consequence of the different onset and evolution of degrading mechanisms: low wall exhibited a brittle fail-ure with diagonal cracks in the middle of the panel due to the dominant shear mechanism, while flexural response characterized behavior of the high wall with the formation of high damaged zones located at the top and bottom sides starting from the corners. Thus, low wall showed a softening behavior more severe than high wall, as well as larger hysteretic dissipation.
Horizontal imposed displacement [mm]
-100 -50 0 50 100 -15 -10 -5 0 5 10 15 Horizontal force [kN] (a) (b)
Figure 2.24: Ispra high wall: (a) experimental cyclic load-displacement global curve and (b) experimental failure path from Anthoine et al. (1995).
Horizontal imposed displacement [mm] -10 -5 0 5 10 -100 -50 50 100 Horizontal force [kN] 0 (a) (b)
Figure 2.25: Ispra low wall: (a) experimental cyclic load-displacement global curve and (b) experimental failure path from Anthoine et al. (1995).
2.2.2.3 Two-story masonry building
A full-scale two-story masonry building was tested at University of Pavia (Magenes et al., 1995) under quasi-static loading conditions with the aim of evaluating its seismic capacity. A schematic representation of the prototype geometry is sketched in Figure 2.26. Four two-wythes solid brick walls, 250 mm thick, composed the building, which was characterized by plan dimensions 6 × 4.4 m2 and height of 6.4 m. The longitudinal walls were with openings, that is wall D and wall B, also known as ‘door’ and ‘window’ wall, respectively. Wall D was disconnected from transverse walls (A and C), as opposed to wall B, which was properly linked with interlocking brick pattern at the adjacent walls. This allowed to consider wall D as plane structure and wall A+B+C as overall independent system. Flexible diaphragms at the floor levels were simulated with a series of steel beams (with I section and 140 mm depth), which were also used to impose, by means of concrete blocks, distributed loads about equal to 10 kN/m2, resulting in vertical additional loads of 248.4 kN and 236.8 kN at the first and second level, respectively. By using displacement controlled screw jacks, seismic loads were applied as concentrated
Wall D Wa ll B 64 93 90 106 90 93 64 Wall B Wall D Wall C Wall A 64 93 90 106 90 93 64 440 115 94 182 94 115 136.5 123.5 169 123.5 91 115 94 182 94 115 Wall B Wall D 136.5 123.5 169 214.5
Figure 2.26: Geometry and loading conditions of the two-story masonry building tested by Magenes et al. (1995) (dimensions in [cm]).
horizontal forces at the longitudinal walls. The imposed displacements were con-trolled so that to obtain equal applied forces at first and top floor levels and were characterized by repeated cyclic with increasing amplitude (see Figure 2.27). Before starting the test, characterization of the material mechanical properties was performed, resulting in mean compressive strength of 6.2 MPa and joints shear strength written as τ = 0.23 + 0.57σ (evaluated from a linear regression on tested triplets).
Figures 2.28(a-d) show experimental outcomes in terms of global response curves (base shear vs. second floor displacement) and crack patterns for both
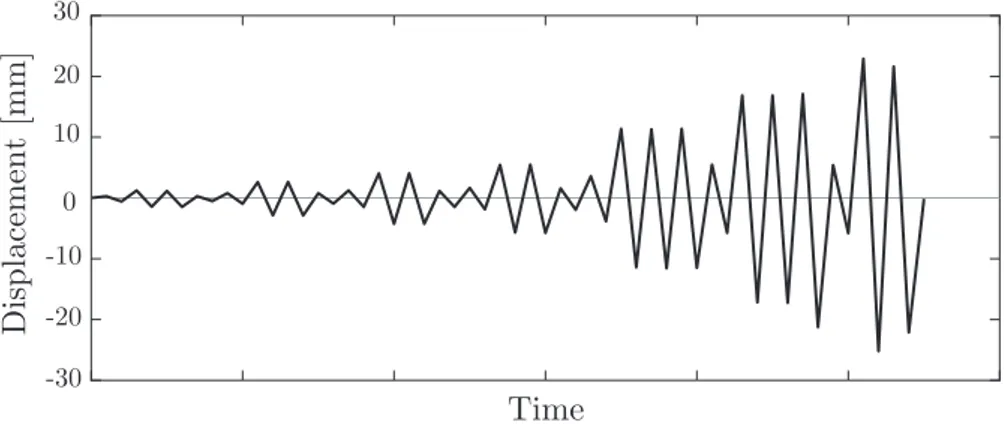
longi--30 -20 -10 0 10 20 30 Time Displacement [mm]
Figure 2.27: Sequence of the displacement applied at the second floor level.
tudinal walls. It can be noted a similar response with strength-stiffness decay and hysteretic dissipation. Maximum base shear was approximately 150 kN and 140 kN for the door and window wall, respectively.
Regarding damage progression, this was quite complex. Initially, cracks devel-oped in the spandrels between the openings by decreasing the coupling between piers, then, with increasing deformation, shear cracking in central piers appeared for both walls. Different behavior was found for the external piers: wall D exhib-ited diagonal cracks due to shear failure, while wall B behaved in a rocking mode with no diagonal damaged shear bands. This different response was imputed to the aspect ratio of the piers and to the test arrangement, because wall B was connected with the transverse walls, as opposed to wall D.
Finally, differences emerged in the measured vertical displacements. Wall D ex-hibited significant displacements due to flexure mechanisms, while wall B showed small uplift, as its response resulted characterized by shear mechanisms in the central piers.
The described test points out the complexity of failure mechanisms character-izing unreinforced masonry buildings. Indeed, the global responses result strongly affected by loading conditions and level of anchorage between structural elements.