Gene
flow contributes to diversification of the
major fungal pathogen Candida albicans
Jeanne Ropars
1,2
, Corinne Maufrais
1,3
, Dorothée Diogo
1
, Marina Marcet-Houben
1,4,5
, Aurélie Perin
1
,
Natacha Sertour
1
, Kevin Mosca
1
, Emmanuelle Permal
1
, Guillaume Laval
3,6
, Christiane Bouchier
7
, Laurence Ma
7
,
Katja Schwartz
8
, Kerstin Voelz
9
, Robin C. May
9
, Julie Poulain
10,11,12
, Christophe Battail
10
,
Patrick Wincker
10,11,12
, Andrew M. Borman
13
, Anuradha Chowdhary
14
, Shangrong Fan
15
, Soo Hyun Kim
16
,
Patrice Le Pape
17
, Orazio Romeo
18,19
, Jong Hee Shin
16
, Toni Gabaldon
4,5,20
, Gavin Sherlock
8
,
Marie-Elisabeth Bougnoux
1,21,22
& Christophe d
’Enfert
1
Elucidating population structure and levels of genetic diversity and recombination is
neces-sary to understand the evolution and adaptation of species. Candida albicans is the second
most frequent agent of human fungal infections worldwide, causing high-mortality rates. Here
we present the genomic sequences of 182 C. albicans isolates collected worldwide, including
commensal isolates, as well as ones responsible for super
ficial and invasive infections,
constituting the largest dataset to date for this major fungal pathogen. Although, C. albicans
shows a predominantly clonal population structure, we
find evidence of gene flow between
previously known and newly identi
fied genetic clusters, supporting the occurrence of (para)
sexuality in nature. A highly clonal lineage, which experimentally shows reduced
fitness, has
undergone pseudogenization in genes required for virulence and morphogenesis, which may
explain its niche restriction. Candida albicans thus takes advantage of both clonality and gene
flow to diversify.
DOI: 10.1038/s41467-018-04787-4
OPEN
1Department of Mycology, Fungal Biology and Pathogenicity Unit, Institut Pasteur, INRA, 75015 Paris, France.2Ecologie Systematique et Evolution, CNRS, Univ. Paris Sud, AgroParisTech, Université Paris Saclay, 91405 Orsay cedex, France.3Center for Bioinformatics, BioStatistics and Integrative Biology (C3BI), USR 3756 IP CNRS, Institut Pasteur, 75015 Paris, France.4Centre for Genomic Regulation (CRG), The Barcelona Institute for Science and Technology, 08003 Barcelona, Spain.5Universitat Pompeu Fabra (UPF), 08002 Barcelona, Spain.6Department of Genomes and Genetics, Human Evolutionary Genetics Unit, UMR 2000 CNRS, Institut Pasteur, 75015 Paris, France.7Biomics Pole, CITECH, Institut Pasteur, 75015 Paris, France.8Department of Genetics, Stanford University Medical School, Stanford, CA 94305-5120, USA.9School of Biosciences and Institute of Microbiology and Infection, University of Birmingham, Birmingham B15 2TT, UK.10CEA, Genoscope, Institut de biologie François Jacob, 91000 Evry, France.11CNRS UMR 8030, 91000 Evry, France.12Univ. Evry, Univ. Paris-Saclay, 91000 Evry, France.13UK National Mycology Reference Laboratory, Public Health England, Bristol BS2 8EL, UK.14Department of Medical Mycology, Vallabhbhai Patel Chest Institute, University of Delhi, Dehli 110007, India.15Department of Obstetrics and Gynecology, Peking University Shenzhen Hospital, PR Guangdong Sheng 518036, China.16Department of Laboratory Medicine, Chonnam National University Medical School, Gwangju 61469, South Korea.17EA1155– IICiMed, Institut de Recherche en Santé 2, Université de Nantes, 44200 Nantes, France.18Department of Chemical, Biological, Pharmaceutical and Environmental Sciences, University of Messina, 98166 Messina, ME, Italy.19IRCCS– Centro Neurolesi Bonino-Pulejo, 98124 Messina, Italy.20ICREA, 08010 Barcelona, Spain.21Unité de Parasitologie-Mycologie, Service de Microbiologie clinique, Hôpital Necker-Enfants-Malades, Assistance Publique des Hôpitaux de Paris (APHP), 75015 Paris, France.22Université Paris Descartes, Sorbonne Paris-Cité, 75006 Paris, France. Correspondence and requests for materials should be addressed to C.d’E. (email:[email protected])
123456789
E
lucidating population subdivision and levels of genetic
diversity and recombination are necessary steps for
under-standing the evolution and adaptation of species. It can
reveal allopatric differentiation, host adaptation or other types of
local adaptation as consequences of reduction of gene
flow
pro-moting genetic drift and natural selection
1. For example, the
causal agent of the white-nose syndrome in bats, the killer of
millions of bats in North America since its discovery in 2006, was
shown to be a single clone of the fungus Pseudogymnoascus
destructans
2. Indeed, population genetics has revealed the
occurrence of only spontaneous mutations in this pathogen with
no indication of recombination. Thus, studying population
genetics of pathogens has a clear applied importance toward the
understanding of disease emergence through adaptation or drug
resistance.
It is estimated that 5 million fungal species exist, yet only a few
hundred are known to cause disease in humans
3. Among the
latter, Candida albicans belongs to one of the four genera causing
high-mortality rates in humans and is the second most frequent
agent of fungal infection worldwide
4. While C. albicans is part of
the normal human intestinal microbiota, it also causes mucosal
diseases in healthy individuals, as well as deep-seated
opportu-nistic infections in hosts with decreased defenses (e.g.,
immu-nocompromised individuals, patients who have endured invasive
clinical procedures or have experienced major trauma).
Candida albicans is a predominantly diploid species, possessing
a parasexual cycle
5,6which differs from a conventional sexual
cycle by the lack of meiosis. In brief, the parasexual cycle of C.
albicans involves (i) the fusion of two diploid cells carrying
opposite mating types (syngamy), followed by (ii) nuclear fusion
(karyogamy) and (iii) concerted chromosome loss to return to the
diploid state, replacing conventional meiosis. Despite the absence
of meiosis, the parasexual cycle of C. albicans allows chromosome
shuffling and recombination events by means of gene conversion
and mitotic recombination, likely contributing to the genetic and
phenotypic diversity in this species
5,6. However, the evidence of
the importance of parasexuality in nature is lacking, as genetic
analyses have identified predominantly clonal populations (or
genetic clusters, also known as clades) in C. albicans
7–13.
Previous studies have reported significant genetic diversity
across C. albicans clinical isolates using either a mildy-repetitive
DNA
fingerprinting probe
8–10,14, several genes as probes
11or
multilocus sequence typing (MLST), the latter having been widely
used to type C. albicans isolates in the past 15 years
12,13,15,16. To
date, 18 genetic clusters have been identified using MLST
(numbered 1–18). These clusters may have geographic origins
and they display some phenotypic specificities (reviewed in
ref.
16). In 2015, the comparative genomic analysis of 21 clinical
isolates, which had been previously assigned to existing MLST
clades, recapitulated relationships between isolates, and the
authors reported the discovery of extensive variation between
these 21 isolates, including single nucleotide polymorphisms
(SNPs) and frequent whole or partial chromosomal
aneu-ploidies
17. Strikingly, these isolates showed a high frequency of
homozygosity at the genomic region controlling fungal
compat-ibility (also called the mating-type locus in fungi, 12/21 isolates,
57%), which is in contrast with what was previously reported
(110/1294 strains, 8.5%
12). This may reflect antifungal exposure
of these clinical isolates, which also likely explains their high
frequency of aneuploidies
18.
In this work, we sequenced the genomes of 182 C. albicans
isolates collected worldwide, an order of magnitude more isolates
than has been considered previously in population genomic
studies of C. albicans. Our dataset contains commensal isolates, as
well as ones responsible for superficial and invasive infections,
and also includes the previously sequenced laboratory strain
SC5314
19and representatives from all major clusters previously
defined by MLST
12,13,15. While C. albicans shows a
pre-dominantly clonal population structure, our analyses show
evi-dence of introgressions (or admixture) in two newly identified
genetic clusters, supporting the occurrence of (para)sexuality in
nature. Importantly, a highly clonal lineage, which experimentally
showed reduced
fitness, has undergone pseudogenization in genes
required for virulence and morphogenesis, which may explain its
niche restriction.
Results and Discussion
Aneuploidies are rare and loss of heterozygosity (LOH)
fre-quent. The Illumina
®technology was used to deep sequence 182
C. albicans isolates, including the previously sequenced laboratory
strain SC5314
19and representatives from all major clusters
pre-viously defined by MLST
12,13,15(Supplementary Data
1
). Across
all strains, we identified a total of 589,255 SNPs (Supplementary
Data
2
; see Methods section for details). On a broad scale, we
observed segmental aneuploidies in eight strains (Supplementary
Data
1
) and whole-chromosome aneuploidies in ten
(Supple-mentary Data
1
, Supplementary Fig.
1
), suggesting that the high
rate of aneuploidies previously described
17is an exception rather
than the rule, likely due to antifungal treatments
20. Consistent
with previous surveys
12,21, only four sequenced strains (2.2%)
showed a homozygous mating-type locus.
Phenotypic diversity in C. albicans can arise rapidly through
LOH, spanning whole chromosomes or shorter contiguous
chromosome segments
18,22. We detected numerous LOH events
across our 182 isolates. Some were ancient events that had arisen
before cluster expansion (Fig.
1
, examples highlighted by black
dotted boxes) and others were more recent and strain specific
(Fig.
1
, horizontal white stripes specific to a single strain). Long
range LOH events were predominantly the consequence of
mitotic crossovers or break-induced replication events while
events of whole chromosome loss were rare (Fig.
1
). Strains
belonging to clade 13 showed a unique pattern with lower
heterozygosity (Fig.
1
and see below). Analysis of genome-wide
variation revealed that each of the 182 isolates on average contain
65,629 heterozygous SNPs (1 heterozygous SNP every 204 bp,
Supplementary Data
1
) and 14,189 heterozygous
insertion-deletion events (indels), which is in agreement with previous
genomic analysis
17.
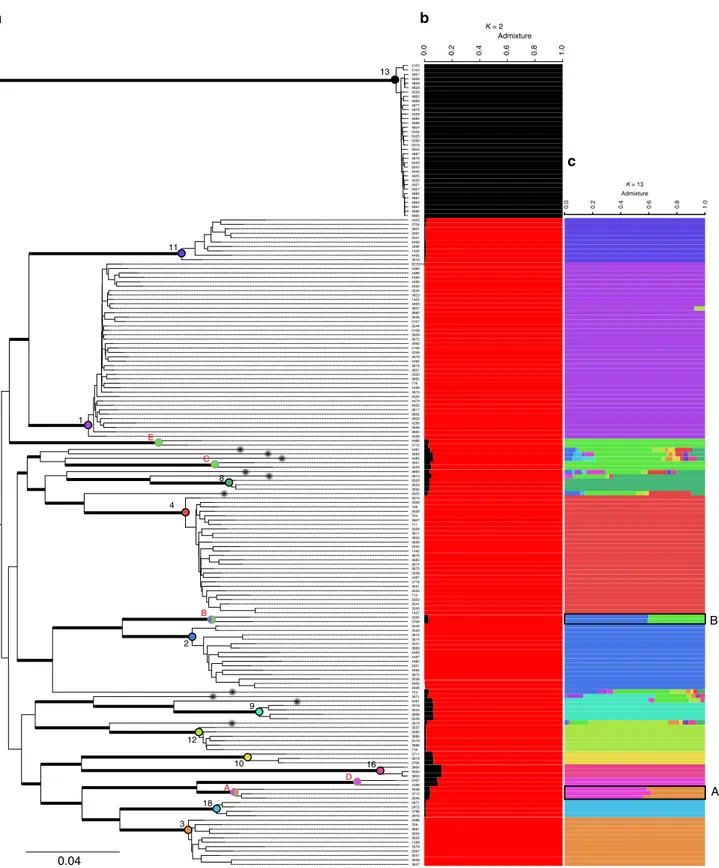
A predominantly clonal population structure of
C. albicans.
Maximum-likelihood phylogenetic analysis based on 264,999
highly confident SNPs (SNPs across the 182 isolates with no
missing data for all strains, Supplementary Data
3
) yielded a tree
showing 17 distinct genetic clusters, including 12 previously
found using multilocus sequencing typing (MLST)
12,13,15and
five
new ones (Fig.
2
a). A majority of the isolates belonged to clusters
1 (n
= 40), 2 (n = 15), 3 (n = 11), 4 (n = 27), 11 (n = 10), and 13
(n
= 35) (Fig.
2
a). Fixation indices (F
ST) further confirmed a
high-genetic differentiation between clusters (mean F
ST= 0.83;
Supplementary Table
1
). Ten isolates could not be assigned to any
cluster, likely because they belong to undersampled or rarer
clusters. Comparing this tree with those obtained using indels and
transposable elements showed the same delimitations of clusters,
consistent with a predominantly clonal population structure of
C. albicans
7,12(Fig.
2
a and Supplementary Figs.
2
,
3
). In addition,
we found an excess of heterozygous SNPs within clusters when
analyzing SNPs specific to this cluster (Meselson effect
23,
Supplementary Fig.
4
), further confirming the clonal expansion of
this human fungal pathogen.
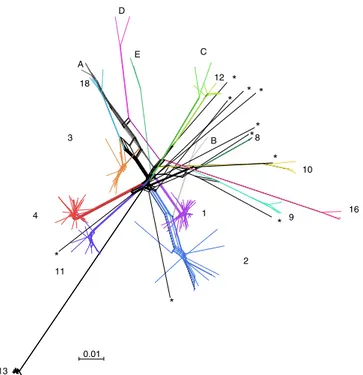
We performed a neighbor-net analysis using the network
approach to visualize possible recombination events within and
1 2 3 4 5 6 7 R Chromosome 100 75 50 30 15 5 0 0 150 SNP density per 10 kb 1 2 3 4 8 9 10 11 12 13 16 18 A B C D E NC SC5314 CEC4480 CEC4488 CEC4489 CEC4496 CEC4500 CEC3534 CEC3623 CEC1424 CEC4883 CEC3627 CEC3682 CEC3636 CEC4107 CEC3544 CEC4108 CEC3609 CEC3672 CEC3560 CEC4106 CEC4259 CEC3679 CEC4484 CEC3678 CEC3621 CEC2020 CEC3662 CEC718 CEC4499 CEC3673 CEC4032 CEC3660 CEC3529 CEC4479 CEC4035 CEC3617 CEC3605 CEC3603 CEC4256 CEC3658 CEC3549 CEC3553 CEC3612 CEC3614 CEC3531 CEC3669 CEC4493 CEC4487 CEC4482 CEC2021 CEC4494 CEC3615 CEC3558 CEC4945 CEC4946 CEC3596 CEC709 CEC3681 CEC3554 CEC3626 CEC1289 CEC3579 CEC3597 CEC3557 CEC3638 CEC3637 CEC3610 CEC3559 CEC708 CEC3530 CEC704 CEC3607 CEC711 CEC3556 CEC3611 CEC3602 CEC3659 CEC3532 CEC1492 CEC3676 CEC3683 CEC3674 CEC3675 CEC3536 CEC4497 CEC3716 CEC3551 CEC3535 CEC712 CEC2022 CEC3541 CEC3540 CEC1427 CEC2023 CEC3622 CEC3634 CEC2018 CEC3533 CEC3668 CEC5026 CEC3711 CEC3616 CEC3706 CEC4525 CEC3704 CEC3601 CEC3561 CEC3547 CEC4492 CEC3494 CEC1426 CEC4495 CEC3618 CEC3537 CEC3685 CEC3680 CEC2019 CEC3686 CEC716 CEC4103 CEC4104 CEC4857 CEC4856 CEC4858 CEC4859 CEC5028 CEC4865 CEC4888 CEC4877 CEC4879 CEC5029 CEC4884 CEC4889 CEC4854 CEC5024 CEC5025 CEC5030 CEC5019 CEC4944 CEC4887 CEC4878 CEC5023 CEC5022 CEC4943 CEC4855 CEC5020 CEC5021 CEC5027 CEC4882 CEC4881 CEC4864 CEC4861 CEC4886 CEC4880 CEC3664 CEC3550 CEC3600 CEC2871 CEC2872 CEC3786 CEC2876 CEC4038 CEC3715 CEC3548 CEC4254 CEC3708 CEC3661 CEC4039 CEC3707 CEC4498 CEC4486 CEC3712 CEC4481 CEC3665 CEC4485 CEC3663 CEC3613 CEC3555 CEC723 CEC3671 CEC4261 CEC3619
Fig. 1 Density of heterozygous SNPs in 182 C. albicans isolates, in 10 kb windows. Each row represents a strain. Strains are ordered according to their cluster assignation. Thick vertical black lines delimit chromosomes (from 1 to 7 and R). Dotted black boxes highlight examples of ancestral LOH shared by all isolates of a cluster. Horizontal white stripes are indicative of recent LOH events. The scale bar represents density of heterozygous SNPs per 10 kb window, from a low density in light blue (white for 0) to a high density in dark red
2 B 4 9 12 10 16 18 3 13 11 1 E C 8 A
a
A Bb
c
3663 3611 3673 4859 5020 2022 4881 4888 4259 4032 3554 3613 5024 3603 5027 3553 3597 704 4261 5019 711 4487 4107 3531 3621 3530 3706 3614 3615 3672 3715 3610 3683 3550 3494 3534 3638 4492 3559 3674 1427 5028 4497 2876 4857 2871 5023 3786 1426 3679 4481 3634 4489 SC5314 4493 3557 4889 5021 4525 3680 718 3540 3708 4944 3660 2872 3535 4883 2020 3681 3561 3533 4494 5029 1492 4882 2023 1289 1424 3560 3529 4865 3665 5022 3716 5026 3662 3548 3707 3661 3678 3612 3627 4104 708 4860 4854 3605 3664 4877 4945 3541 4864 4500 4479 716 4858 4108 4498 3675 723 4480 4856 3622 3637 4887 4035 3685 3537 3669 3658 3536 4496 3712 4482 5025 4946 4038 3676 3547 3532 3711 3549 3558 4488 4484 3551 2021 2019 3600 4855 4039 3704 3636 4103 4878 3556 4495 3682 3659 3686 3671 4486 3607 709 3579 3616 3623 4106 4884 3619 3618 2018 3617 4886 3626 3602 4254 5030 4499 4943 3601 3609 3596 4879 3555 3668 712 4256 4861 3544 4485 D 0.04 Admixture 1.0 0.0 0.2 0.4 0.6 0.8 1.0 0.0 0.2 0.4 0.6 0.8 K = 2 Admixture K = 13Fig. 2 Phylogenetic relationships and population structure of Candida albicans. a Maximum likelihood tree showing phylogenetic relationships between the 182 isolates used in this study; Thick bars represent bootstrap supports >95% (bootstrap analysis of 1000 resampled datasets); branch lengths are shown and the scale bar represents 0.04 substitutions per site. We used the midpoint rooting method to root the tree. Clusters already described in previous studies using MLST data are written in black (from 1 to 18, incomplete due to sampling) and new clusters described in this study are written in red and named with letters from A to E. Black dots at the end of some branches (10 in total) pinpoint strains which could not be assigned to any cluster.b, c Population structure of C. albicans at b K = 2 and c K = 13. The structure has been inferred using NgsAdmix. Each line represents a strain, as in the ML tree (a) and colored bars represent their coefficients of membership in the various gene pools based on SNP data
between lineages. Although this analysis further confirmed the
predominant clonality of C. albicans (Fig.
3
), it also revealed some
footprints of recombination indicated by reticulated patterns.
This was also confirmed by Pairwise Homoplasy Tests (phi tests)
conducted on ORFs using 1000 random permutations of the SNP
positions, based on the expectation that sites are exchangeable
without recombination
24(p-value
= 0.00; 877/6590 features,
Supplementary Data
4
).
Footprints of admixture in two
C. albicans genetic clusters.
Detection of recombination (Fig.
3
) led us to further investigate
possible footprints of admixture in our dataset. We inferred
individual ancestry based on genotype likelihoods from realigned
reads by assuming a known number of admixing populations
ranging from 2 to 16, using the software NgsAdmix
25. At K
= 2,
two well-delimitated populations were found, separating strains
from cluster 13 (in black, Fig.
2
b) from all other strains. Because
cluster 13 isolates showed different SNP patterns compared to
other strains (Fig.
1
and see below), we reanalyzed the data after
removing this cluster. At several K (from 8 to 16), two genetic
clusters always appeared admixed, namely clusters A and B
(Fig.
2
c). Genomic scans of statistics designed for measuring
population differentiation, i.e., F
STand df (number of
fixed
dif-ferences between each pair of clusters), were performed to localize
regions of introgression and to assess their origin (Fig.
4
). Cluster
A showed footprints of introgression from three different clusters
(clusters 3, D and 18, Fig.
4
a and Supplementary Fig.
5
) while
cluster B only showed footprints of introgression from cluster 2
(Fig.
4
b and Supplementary Fig.
6
). Neighbor-net analyses only
including newly identified admixed genetic clusters and their
supposed ancestors (clusters A, 3, D and 18, Fig.
4
c; clusters B
and 2, Fig.
4
d) using isolates of clusters 1 or 4 as outgroups,
confirmed the presence of recombination as shown by
reticula-tion between these populareticula-tions.
In C. albicans, a parasexual cycle has been described, differing
from the conventional sexual cycle by the absence of meiosis,
which is replaced by concerted chromosome loss after nuclear
fusion to return to the diploid state
5,6,26. However, no evidence of
introgression has been described in nature. Here we report clear
evidence that new clusters can arise from introgression events in
this widespread human pathogen. This parallels recent
findings in
another putatively asexual opportunistic human pathogen
Candida glabrata
27, and suggests that gene
flow in Candida
pathogens may be more common than previously thought.
Genetic differentiation occurs when gene
flow is prevented, due
to reproductive barriers or asexuality. Genes involved in mating
were shown to be under purifying selection in C. albicans
28,
suggesting that they are still functional. Accordingly, mating has
been induced between various C. albicans isolates of opposite
mating-types as well as between C. albicans and its close relative
C. dubliniensis, in the laboratory in vitro and in vivo, leading to
the formation of tetraploids
29–32. Return to the diploid state has
also been observed, and involved random chromosome loss
rather than meiosis
5. While these data suggest that genetic
differentiation in the C. albicans species does not impose
prezygotic barriers, these experiments did not systematically
address possible genetic incompatibilities between genetic
clusters. In particular, they did not assess the existence of
postzygotic reproductive isolation, i.e., non-viability or sterility of
hybrids. Thus, a thorough investigation of reproductive isolation
between different genetic clusters in C. albicans is still lacking.
Importantly, the two newly identified genetic clusters showing
footprints of admixture were previously unknown. We believe
that our resource of 182 genome-sequenced isolates will be
invaluable to address this key question.
A highly clonal lineage with reduced
fitness and pseudogenes.
Cluster 13 showed very short branches in the phylogenetic tree
(Fig.
2
) and no reticulation in the neighbor-net analysis (Fig.
3
).
Furthermore, cluster 13 isolates showed different SNP patterns
compared to strains from other clusters (Fig.
1
). Indeed, their
index of nucleotide diversity
π was much lower than that for
other clusters (π
cluster13= 0.14 versus mean π
clusters1,2,3,4,11= 0.36
in the
five most represented clusters, Supplementary Table
2
).
Cluster 13 also showed lower polymorphism than other clusters
(12,310 polymorphic sites in cluster 13 in contrast to 30,334 on
average in the
five other most represented clusters,
Supplemen-tary Table
3
). Strikingly, the number of heterozygous SNPs was
much lower in this cluster (average: 39,616), as compared to
others (average: 69,740; Fig.
1
, Supplementary Fig.
7
). Cluster 13
has been proposed to be ranked as a new species, named C.
africana
33, because the
first isolated strains were from Africa, and
were morphologically and physiologically different from other
strains of C. albicans
33–38(e.g., slower growth, inability to
pro-duce chlamydospores and to assimilate trehalose or amino
sugars). All isolates of cluster 13 were collected from the genital
tract and showed lower virulence in animal models of Candida
infections
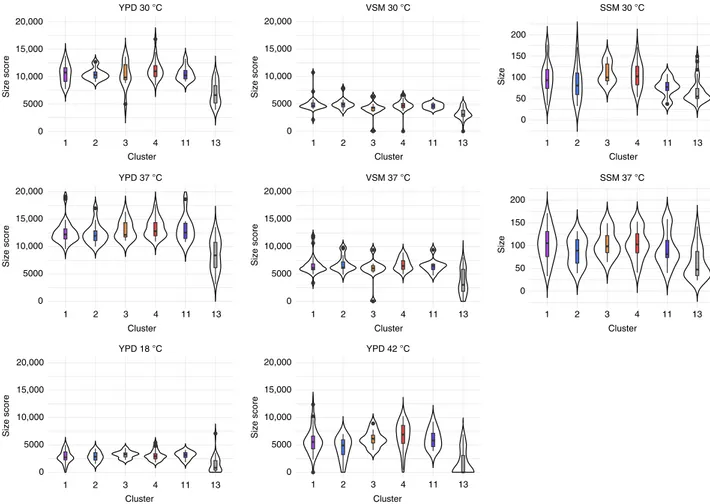
35. Indeed, strains from cluster 13 studied here showed
reduced
fitness, i.e., slower growth rates on different media at
different temperatures than strains from other clusters
(Supple-mentary Data
5
). We measured
fitness in vaginal simulative
medium (VSM), saliva simulative medium (SSM), and rich
medium (YPD), and confirmed that strains from cluster 13 are
not more
fit in the genital niche than other strains of C. albicans
(Supplementary Data
5
, Fig.
5
), instead suggesting a niche
restriction due to a defect in
fitness in other parts of the human
body rather than specific adaptation to the genital niche.
Because cluster 13 isolates showed reduced
fitness and a
decrease in virulence compared to other clusters of C. albicans
35,
2 13 C 8 4 18 D 16 10 9 12 E 11 3 * * * A 1 B * * * * * * * 0.01Fig. 3 Neighbor-net of Candida albicans. Neighbor-net analysis for 182 isolates collected worldwide based on SNP data. Reticulation indicates likely occurrence of recombination. Branch lengths are shown and the scale bar represents 0.01 substitutions per site. Asterisks pinpoint strains which could not be assigned to any genetic clusters
we hypothesized that some genes important for virulence and
growth may be missing and/or disrupted in this cluster. To test
our hypothesis, we investigated the presence of homozygous
premature stop codons due to nonsense mutations in the 6179
predicted ORFs of C. albicans. While no premature stop codons
were
fixed in and specific to clusters 1, 2, and 4, two such stop
codons were detected in cluster 3 and one in cluster 11; however,
mutations in these genes have not been reported as impacting
survival or virulence in C. albicans. By contrast, 39 ORFs showed
premature stop codons that were
fixed in, and specific to cluster
13 (Supplementary Data
6
,
five were confirmed by Sanger
sequencing). These ORFs included genes encoding transcription
factors required for
fitness in systemic infection and proper
regulation of morphogenesis, such as SFL1
39and ZCF29
40.
High rates of clonal reproduction have been both theoretically
and empirically reported to increase the effective number of
alleles and heterozygosity in a population
41–43. In C. albicans,
strain-specific recessive deleterious/lethal alleles have been
identified and shown to limit LOH
44. Cluster 13 isolates however
have much lower heterozygosity compared to other strains of C.
albicans (Fig.
1
). This may reflect a combination of massive
ancestral LOH events and clonal reproduction in this cluster, with
fixation of several deleterious alleles, affecting the overall fitness
of these strains and leading to its niche restriction. Notably, the
closest relative of C. albicans, namely Candida dubliniensis, also
shows lower heterozygosity
45. It has been reported that C.
dubliniensis is less virulent and has lower
fitness compared to C.
albicans
46–49, and that its genome harbors numerous
pseudo-genes and a lower level of genetic diversity. In the CTG clade of
Saccharomycotina to which C. albicans and C. dubliniensis
belong, more distantly related diploid species show high levels
of heterozygosity similar to (or even higher than) those observed
for non-cluster 13 isolates of C. albicans. These species have been
shown to result from hybridization events
50–52. Cluster 13 isolates
of C. albicans showed ancient LOH in telomere-proximal regions,
suggesting these events have occurred by break-induced
1.00 0.75 FST df FST df 0.50 0.25 300 0.75 0.50 0.25 200 150 100 50 0 200 100 0
0e+00 1e+06 2e+06 3e+06
0e+00 1e+06 2e+06 3e+06
0e+00 1e+06 2e+06 3e+06
0e+00 1e+06
Position along chromosome 1 Position along chromosome 1
2e+06 3e+06 Cluster 1 Cluster 2 Cluster 4 Cluster 1 Cluster 2 Cluster 4 Cluster 1 Cluster 3 Cluster D Cluster 18 Cluster 1 1 3 18 4 0.01 B 2 A 0.01 D Cluster 3 Cluster D Cluster 18
a
c
b
d
Fig. 4 Evidence of admixture in clusters A and B. a and b Genomic scans of FST(fixation index, an index measuring the differentiation between populations) and df (the number offixed differences between populations) in sliding windows of 50 kb using a window step of 5000 bp. Predicted regions of admixture correspond to those that show a drop in both FSTand df.a Comparison of cluster A to clusters 1, 3, D and 18 along chromosome 1; b comparison of cluster B to cluster 1 and 2 along chromosome 1;c, d neighbor-net analyses based on SNP data including c clusters A, 3, D, 18 and 1 and d clusters 2, B and 1; branch lengths are shown inc and d and the scale bar represents 0.01 substitutions per site
replication (BIR) and/or mitotic recombination, as regions
around centromeres showed higher heterozygosity (Fig.
1
and
Supplementary Fig.
7
). This pattern of heterozygosity is different
from what we observed in other C. albicans isolates, in which
heterozygosity was steady along chromosomes, except when
recent LOH events were observed (Fig.
1
and Supplementary
Fig.
7
). The most parsimonious ancestral state is thus a high level
of heterozygosity, followed by two independent events
(homo-plasy) of massive losses of heterozygosity and accumulations of
deleterious alleles in C. dubliniensis and isolates of cluster 13 of C.
albicans.
In conclusion, our population genomic analyses shed light on
the processes of divergence—namely (para)sexuality (as
evi-denced by gene
flow) and clonality—in the most widespread
opportunistic human fungal pathogen, C. albicans. We believe
that the availability of 182 genome sequences of C.albicans
isolates constitutes an invaluable genetic resource for the scientific
community, not only for specialists of this species to better
understand the biology of C. albicans, but also for evolutionary
biologists to comprehend disease emergence.
Methods
Sampling. A total of 182 isolates of Candida albicans were collected previously from different continents and origins (Supplementary Data1).
Production of whole-genome sequencing data. Genomic DNA was extracted from the colonies using the phenol chloroform protocol previously described in ref.
15or the QiaAmp DNA Mini Kit (Qiagen). The genomes were sequenced either at
the Biomics Pole—Genomic Platform of Institut Pasteur, the Department of Genetics at Stanford University or the Sequencing facility of the University of Exeter (see Supplementary Data1for details) using the Illumina sequencing technology. Paired-end reads of 100–125 bp were obtained. Reads have been deposited at the NCBI Sequence Read Archive under BioProject ID PRJNA432884.
Each set of paired-end reads was mapped against the C. albicans reference genome SC5314 haplotype A or haplotype B53downloaded from the Candida Genome Database54(version A22 06-m01) using the Burrows–Wheeler Alignment
tool, BWA version 0.7.755, with the BWA-MEM algorithm, specifically designed
for sequences ranging from 70 bp to 1 Mb and recommended for high-quality queries. SAMtools version 1.256and Picard tools version 1.94 (http://
broadinstitute.github.io/picard) were then used tofilter, sort and convert SAM files. SNPs were called using Genome Analysis Toolkit version 3.1–157–59, according
to the GATK Best Practices. SNPs and indels werefiltered using these following parameters: VariantFiltration, QD < 2.0, LowQD, ReadPosRankSum <−8.0, LowRankSum, FS > 60.0, HightFS, MQRankSum <−12.5, MQRankSum, MQ < 40.0, LowMQ, HaplotypeScore > 13.0, HaploScore. Coverages were also calculated using the Genome Analysis Toolkit.
We created two tables encompassing all 182 isolates from VCFfiles using custom scripts. One encompassed 264,999 confident SNPs across the 182 isolates containing no missing data. Besides passing GATK’s filters, we also checked for read depth (it had to be between 0.5 and 1.5 of the mean genome coverage), heterozygous positions should have an allelic ratio of number of alternative allele reads/total number of reads comprised between 15 and 85% and homozygous positions should have an allelic ratio of number of alternative allele reads/total number of reads >98% (Supplementary Data2). The second table encompassed 0 5000 10,000 15,000 20,000 1 2 3 4 11 13 Cluster Size score YPD 30 °C 0 5000 10,000 15,000 20,000 1 2 3 4 11 13 Cluster Size score VSM 30 °C 0 50 100 150 200 1 2 3 4 11 13 Cluster Size SSM 30 °C 0 5000 10,000 15,000 20,000 1 2 3 4 11 13 Cluster Size score YPD 37 °C 0 5000 10,000 15,000 20,000 1 2 3 4 11 13 Cluster Size score VSM 37 °C 0 50 100 150 200 1 2 3 4 11 13 Cluster Size SSM 37 °C 0 5000 10,000 15,000 20,000 1 2 3 4 11 13 Cluster Size score YPD 18 °C 0 5000 10,000 15,000 20,000 1 2 3 4 11 13 Cluster Size score YPD 42 °C
Fig. 5 Strains of cluster 13 grow less well than other strains of C. albicans in different media at different temperatures. Violin plots of growth size scores performed using Iris by grouping isolates by clusters (only the most represented clusters are shown, i.e., those with >10 individuals: clusters 1, 2, 3, 4, 11 and 13) on vaginal-simulative medium (VSM) and YPD; For saliva simulative medium (SSM), we calculated colony size as mean of two perpendicular measures of diameters using ImageJ. Horizontal lines in the boxplots represent the median, vertical ones the length between upper and lower quartiles. Dots represent the outlier values. Some strains showed very poor growth on VSM, preventing measurement of colony size. These strains were not included in thefigure. All experiments were performed in duplicate. In all conditions (different media and different temperatures), cluster 13 isolates are significantly lessfit than other strains of C. albicans (ANOVA analyses followed by post-hoc comparisons using TukeyHSD tests (see Supplementary Data5)). VSM: vaginal-simulative medium, SSM: saliva-simulative medium, YPD: yeast peptone dextrose medium
589,255 SNPs where some of the newfilters described above could be not respected and we created a code to have information of whichfilter did not pass:—for wrong allelic ratio of reference/alternative allele for heterozygous positions,++ for wrong allelic ratio of reference/alternative allele for homozygous positions, ## for a read depth not between 0.5 and 1.5 of the mean genome coverage; some positions could have severalfilters which did not pass: a combination of—and ## gave && and + +and ## gave ** (Supplementary Data3).
Phylogenetic analyses and distance trees. RAxML60was used to infer phylo-genetic relationships between the 182 isolates using the dataset of 264,999 con-fident SNPs using 1000 bootstraps replicates. As our dataset does not include any outgroup, we used the midpoint rooting method to root our tree, in which the root is set at the midpoint between the two most divergent isolates. We also created neighbor-joining trees using insertion/deletion events by coding no indel as 0, heterozygous indel as 1 and homozygous indel as 2, using the R package61ape62.
The distance matrix was calculated by counting the number of differences. Genetic structure. We used the dataset of 264,999 confident SNPs to infer the finer population structure within C. albicans. We performed NgsAdmix from the ANGSD package63to look for admixture in our dataset, from K= 2 to K = 16.
After K= 13, clusters with the highest number of isolates, i.e., clusters 1 (n = 40) and 4 (n= 27), were split into sub-clusters, which likely reflect a problem of number of isolates within clusters rather than a biological meaning.
Statistics of population genetics. Nucleotide diversity (π) using VCFtools64with
the—site-pi option was computed within each cluster. We also used ANGSD63to
measure differentiation between populations (weighted FST)65. Three measures of divergence, FST(using ANGSD) and df, the number offixed differences between populations were computed using custom scripts. This was done along sliding windows of 50 kb using steps of 5000 bp. Plots were done using the R package ggplot266.
Linkage disequilibrium (LD) was computed as r2, the coefficient of correlation between a pair of SNPs, with PLINK version 1.0767, excluding SNPs with minor allele frequency lower than 0.05. LD (r2) was calculated for each cluster with >10 individuals (clusters 1, 2, 3, 4, 11, and 13) for each chromosome. Mean r2-values for each cluster for each chromosome were plotted using the R package ggplot266. Neighbor-net analyses. We used the R package phangorn68for performing
neighbor-net analyses.
Hierarchical clustering based on the coverage of repeats. To confirm the predominantly clonal propagation of C. albicans, we calculated the sequencing depth of 121 features annotated as“long_terminal_repeat”, “retrotransposon” and “repeat_regions”54. For each feature, we normalized by the sequencing depth of the
corresponding chromosome to remove the impact of potential aneuploidies. The clustering was generated by Cluster 3.069using hierarchical clustering (complete linkage clustering) and the spearman rank correlation for measuring non-parametric distance, and visualized with java treeview70by converting values in log2 scale.
Sequencing depth by bins of 1 kb. To identify aneuploid chromosomes in the 182 strains, we calculated average sequencing depth on the eight chromosomes for each strain. Sequencing depth obtained for each bin of 1 kb on each chromosome was multiplied by the ploidy of the strain as defined from FACS analysis, divided by the genome sequencing depth and converted to log2 values. These values were then corrected through division by the median of all values obtained for chro-mosomes that had an average sequencing depth that did not deviate by >20% from the average sequencing depth of the whole genome. This allows the median of values obtained for a diploid chromosome to be ~1; whereas, the median of values obtained for a triploid chromosome is ~1.58 and the median of values obtained for a tetraploid chromosome is ~2. In the absence of this correction, values of diploid chromosomes are underestimated if the strain harbors triploid or tetraploid chromosomes. Averages of the normalized value obtained for each of the eight chromosomes in each strain were calculated and used to generate a heatmap. Flow cytometry analysis. For each of the 182 strains, cells from the frozen col-lection (temperature:−80 °C) were grown in tubes for 36 h at 30 °C under agitation in 3 mL of YPD medium (1% yeast extract, 2% peptone, 2% dextrose). We then collected 1 mL of culture (about 1 × 10⁷cells/mL) in 2 mL Eppendorf tubes; cells were collected by centrifuging (5 min at 3500 r.p.m.) and resuspended in 300 µL of sterile water. We slowly added 700 µL of pure ethanol, repeatedly inverted tubes and incubated overnight at 4 °C. After centrifuging 5 min at 3500 r.p.m., cells were washed once with 1 mL of sterile water, resuspended in 0.5 mL of RNase solution (40 µg/mL; Thermo Fisher) and incubated for 4 h at 37 °C. Then, cells were col-lected by centrifuging (5 min at 3500 r.p.m.) and resuspended in 0.5 mL of 50 mM Tris-HCl (pH 8.0). 50 µL of suspension were transferred in hemolysis tubes with 0.5 mL of SYTOX Green (Invitrogen) staining solution (1 µM SYTOX Green in 50 mM Tris-HCl buffer, pH 8.0). Finally, samples (60,000 cells) were analyzed using a
MACSQuant (Miltenyi)flow cytometer, with a 488 nm laser to excite SYTOX Green and a bandpassfilter 500–550 nm to detect fluorescence.
Growth phenotypes on solid media. The 182 isolates were split into three plates of 96, with the reference SC5314 present on each plate. Pre-cultures in deep wells from frozen cultures at−80 °C were realized at 30 °C for 36–48 h by taking 10 µL in afinal volume of 500 µL in YPD liquid medium. Optical density was set to 1 for each isolate. We used the ROTOR from Singer Instruments to inoculate our 96 colonies at once, on solid media. All experiments were performed in duplicate. We inoculated strains on YPD medium and let them grow for 3 days into chambers at 18, 30, 37 and 42 °C. Pictures of plates were taken using the PhenoBooth from Singer Instruments at high quality (4128 × 3096). We also inoculated all strains included in this study on vaginal simulative medium (VSM), saliva simulative medium (SSM) and YPD media (YPD: (1% yeast extraxt, 2% peptone, 2% dextrose, 2% agar and see Supplementary Table4for composition of VSM and SSM) at 30 °C for 3 days. Some strains showed very poor growth on VSM, preventing mea-surement of colony size. These strains were not included in thefigure. The tool Iris71was used for image analysis, resulting in tables of morphology scores and colony sizes (Supplementary Data7; some data are missing for strain CEC5019, one of 35 cluster 13 strains) using an R script provided with Iris. For SSM results, Iris was unable to detect limits of colonies and we thus used ImageJ72to capture two perpendicular measures of diameter per colony. Analyses of variance (ANOVA) were performed using R, as well as post-ANOVA comparisons, Tukey’s HSD (honest significant difference) tests73. Graphic representations (boxplots)
were also performed using R.
Check of premature stop codons by Sanger sequencing. To confirm the pre-sence of premature stop codons detected in silico in some ORFs, we Sanger sequenced ~400 bp regions within the AFG1, BMT6, SFL1, VTA1, and ZCF29 ORFs, using DNA from 14 strains (two strains from cluster 1: SC5314 and CEC4496, two strains from cluster 2: CEC4493 and CEC4482, two strains from cluster 3: CEC3597 and CEC3681, two strains from cluster 4: CEC3536 and CEC3716, two strains from cluster 11: CEC3704 and CEC4525, four strains from cluster 13: CEC4103, CEC4104, CEC4878, CEC5030). Primer pairs were designed to amplify small regions of 400 bp using Primer3Plus74online (Supplementary Table5). DNA was extracted using the extraction protocol in 96 deep-wells of the MasterPureTMYeast DNA purification kit of epicenter. PCRs were performed in 50 µl reactions, using 0.5 µL Taq polymerase 5U (Thermofisher), 5 µL 10× buffer with KCl and without MgCl2, 5 µL of dNTP 2 mM, 1 µl of each primer pair (10 µM) and 2 µL template DNA (concentration around 150 ng µL−1for all isolates). Amplifications were performed in a Mastercycler pro S from Eppendorf with a first denaturation step at 95 °C for 4 min, followed by 30 cycles of 40 s at 94 °C, 40 s at 55 °C and 40 s at 72 °C. The PCR program was followed by afinal 10 min extension step at 72 °C. PCR products were purified and sequenced by the Eurofins Cochin Sequencing Platform in Paris, in one direction as sequences were short. Sanger sequences were verified by visual inspection.
Code availability. All code is available upon request to the authors. Data availability. Raw reads have been deposited at the NCBI Sequence Read Archive under BioProject ID PRJNA432884 [https://www.ncbi.nlm.nih.gov/ bioproject/432884]. Supplementary Data2and3are SNP datasets (see Methods section forfilters). Supplementary Data7reports morphology sizes for colony growth on vaginal-simulative medium (VSM), saliva-simulative medium (SSM), and YPD at different temperatures (18 °C, 30 °C, 37 °C and 42 °C). All other relevant data are available from the corresponding author upon request.
Received: 9 February 2018 Accepted: 23 May 2018
References
1. Savolainen, O., Lascoux, M. & Merilä, J. Ecological genomics of local adaptation. Nat. Rev. Genet. 14, 807–820 (2013).
2. Trivedi, J. et al. Fungus causing white-nose syndrome in bats accumulates genetic variability in north america with no sign of recombination. mSphere 2, e00271–17 (2017).
3. Taylor, L. H., Latham, S. M. & Woolhouse, M. E. J. Risk factors for human disease emergence. Philos. Trans. R. Soc. B Biol. Sci. 356, 983–989 (2001). 4. Brown, G. D. et al. Hidden killers: human fungal infections. Sci. Transl. Med.
4, 165rv13 (2012).
5. Bennett, R. J. & Johnson, A. D. Completion of a parasexual cycle in Candida albicans by induced chromosome loss in tetraploid strains. EMBO J. 22, 2505–2515 (2003).
6. Forche, A. et al. The parasexual cycle in Candida albicans provides an alternative pathway to meiosis for the formation of recombinant strains. PLoS Biol. 6, e110 (2008).
7. Bougnoux, M.-E. et al. Mating is rare within as well as between clades of the human pathogen Candida albicans. Fungal Genet. Biol. 45, 221–231 (2008). 8. Soll, D. R. & Pujol, C. Candida albicans clades. FEMS Immunol. Med.
Microbiol. 39, 1–7 (2003).
9. Blignaut, E., Pujol, C., Lockhart, S., Joly, S. & Soll, D. R. Ca3fingerprinting of Candida albicans isolates from human immunodeficiency virus-positive and healthy individuals reveals a new clade in South Africa. J. Clin. Microbiol. 40, 826–836 (2002).
10. Schmid, J. et al. Evidence for a general-purpose genotype in Candida albicans, highly prevalent in multiple geographical regions, patient types and types of infection. Microbiology 145, 2405–2413 (1999).
11. Lott, T. J., Fundyga, R. E., Kuykendall, R. J. & Arnold, J. The human commensal yeast, Candida albicans, has an ancient origin. Fungal Genet. Biol. 42, 444–451 (2005).
12. Odds, F. C. et al. Molecular phylogenetics of Candida albicans. Eukaryot. Cell 6, 1041–1052 (2007).
13. Shin, J. H. et al. Genetic diversity among Korean Candida albicans bloodstream isolates: assessment by multilocus sequence typing and restriction endonuclease analysis of genomic DNA by use of BssHII. J. Clin. Microbiol. 49, 2572–2577 (2011).
14. Pujol, C., Pfaller, M. & Soll, D. R. Ca3fingerprinting of Candida albicans bloodstream isolates from the United States, Canada, South America, and Europe reveals a European clade. J. Clin. Microbiol. 40, 2729–2740 (2002). 15. Bougnoux, M.-E., Morand, S. & d’Enfert, C. Usefulness of multilocus sequence
typing for characterization of clinical isolates of Candida albicans. J. Clin. Microbiol. 40, 1290–1297 (2002).
16. Odds, F. C. Molecular phylogenetics and epidemiology of Candida albicans. Future Microbiol. 5, 67–79 (2010).
17. Hirakawa, M. P. et al. Genetic and phenotypic intra-species variation in Candida albicans. Genome Res. 25, 413–425 (2015).
18. Abbey, D., Hickman, M., Gresham, D. & Berman, J. High-resolution SNP/ CGH microarrays reveal the accumulation of loss of heterozygosity in commonly used Candida albicans strains. G3 Genes. 1, 523–530 (2011). 19. Jones, T. et al. The diploid genome sequence of Candida albicans. Proc. Natl
Acad. Sci. USA 101, 7329–7334 (2004).
20. Selmecki, A., Forche, A. & Berman, J. Aneuploidy and isochromosome formation in drug-resistant Candida albicans. Science 313, 367–370 (2006). 21. Lockhart, S. R. et al. Candida albicans, white-opaque switchers are
homozygous for mating type. Genetics 162, 737–745 (2002).
22. Forche, A. et al. Stress alters rates and types of loss of heterozygosity in Candida albicans. mBio 2, e00129–11 (2011).
23. Judson, O. P. & Normark, B. B. Ancient asexual scandals. Trends Ecol. Evol. 11, 41–46 (1996).
24. Bruen, T. C., Philippe, H. & Bryant, D. A simple and robust statistical test for detecting the presence of recombination. Genetics 172, 2665–2681 (2006). 25. Skotte, L., Korneliussen, T. S. & Albrechtsen, A. Estimating individual
admixture proportions from next generation sequencing data. Genetics 195, 693–702 (2013).
26. Bennett, R. J. The parasexual lifestyle of Candida albicans. Curr. Opin. Microbiol. 28, 10–17 (2015).
27. Carreté, L. et al. Patterns of genomic variation in the opportunistic pathogen Candida glabrata suggest the existence of mating and a secondary association with humans. Curr. Biol. 28, 15–27.e7 (2018).
28. Zhang, N. et al. Selective advantages of a parasexual cycle for the yeast Candida albicans. Genetics 200, 1117–1132 (2015).
29. Hull, C. M., Raisner, R. M. & Johnson, A. D. Evidence for mating of the ‘asexual’ yeast Candida albicans in a mammalian host. Science 289, 307–310 (2000).
30. Magee, B. B. & Magee, P. T. Induction of mating in Candida albicans by construction of MTLa and MTLalpha strains. Science 289, 310–313 (2000). 31. Pujol, C. et al. The closely related species Candida albicans and Candida
dubliniensis can mate. Eukaryot. Cell 3, 1015–1027 (2004).
32. Legrand, M. et al. Homozygosity at the MTL locus in clinical strains of Candida albicans: karyotypic rearrangements and tetraploid formation. Mol. Microbiol. 52, 1451–1462 (2004).
33. Tietz, H.-J., Hopp, M., Schmalreck, A., Sterry, W. & Czaika, V. Candida africana sp. nov., a new human pathogen or a variant of Candida albicans? Mycoses 44, 437–445 (2001).
34. Alonso-Vargas, R. et al. Isolation of Candida africana, probable atypical strains of Candida albicans, from a patient with vaginitis. Med. Mycol. 46, 167–170 (2008).
35. Borman, A. M. et al. Epidemiology, antifungal susceptibility, and
pathogenicity of Candida africana Isolates from the United Kingdom. J. Clin. Microbiol. 51, 967–972 (2013).
36. Chowdhary, A. et al. Whole genome-based amplified fragment length polymorphism analysis reveals genetic diversity in Candida africana. Front. Microbiol. 8, 556 (2017).
37. Shan, Y., Fan, S., Liu, X. & Li, J. Prevalence of Candida albicans-closely related yeasts, Candida africana and Candida dubliniensis, in vulvovaginal candidiasis. Med. Mycol. 52, 636–640 (2014).
38. Sharma, C., Muralidhar, S., Xu, J., Meis, J. F. & Chowdhary, A. Multilocus sequence typing of Candida africana from patients with vulvovaginal candidiasis in New Delhi, India. Mycoses 57, 544–552 (2014).
39. Li, Y., Su, C., Mao, X., Cao, F. & Chen, J. Roles of Candida albicans Sfl1 in hyphal development. Eukaryot. Cell 6, 2112–2121 (2007).
40. Issi, L. et al. Zinc cluster transcription factors alter virulence in Candida albicans. Genetics 205, 559–576 (2017).
41. Balloux, F., Lehmann, L. & de Meeûs, T. The population genetics of clonal and partially clonal diploids. Genetics 164, 1635–1644 (2003).
42. Birky, C. W. Heterozygosity, heteromorphy, and phylogenetic trees in asexual eukaryotes. Genetics 144, 427–437 (1996).
43. Meloni, M. et al. Effects of clonality on the genetic variability of rare, insular species: the case of Ruta microcarpa from the Canary Islands. Ecol. Evol. 3, 1569–1579 (2013).
44. Feri, A. et al. Analysis of repair mechanisms following an induced double-strand break uncovers recessive deleterious alleles in the Candida albicans diploid genome. mBio 7, e01109–e01116 (2016).
45. Jackson, A. P. et al. Comparative genomics of the fungal pathogens Candida dubliniensis and Candida albicans. Genome Res. 19, 2231–2244 (2009). 46. Vilela, M. M. S. et al. Pathogenicity and virulence of Candida dubliniensis:
comparison with C. albicans. Med. Mycol. 40, 249–257 (2002).
47. McManus, B. A. et al. Multilocus sequence typing reveals that the population structure of Candida dubliniensis is significantly less divergent than that of Candida albicans. J. Clin. Microbiol. 46, 652–664 (2008).
48. Kirkpatrick, W. R., Lopez-Ribot, J. L., Mcatee, R. K. & Patterson, T. F. Growth competition between Candida dubliniensis and Candida albicans under broth and biofilm growing conditions. J. Clin. Microbiol. 38, 902–904 (2000). 49. Moran, G. P., Coleman, D. C. & Sullivan, D. J. Candida albicans versus
Candida dubliniensis: why Is C. albicans more pathogenic? Int. J. Microbiol. 2012, 1–7 (2012).
50. Pryszcz, L. P., Németh, T., Gácser, A. & Gabaldón, T. Genome comparison of candida orthopsilosis clinical strains reveals the existence of hybrids between two distinct subspecies. Genome Biol. Evol. 6, 1069–1078 (2014).
51. Pryszcz, L. P. et al. The genomic aftermath of hybridization in the opportunistic pathogen Candida metapsilosis. PLoS. Genet. 11, e1005626 (2015).
52. Schröder, M. S. et al. Multiple origins of the pathogenic yeast Candida orthopsilosis by separate hybridizations between two parental species. PLoS. Genet. 12, e1006404 (2016).
53. Muzzey, D., Schwartz, K., Weissman, J. S. & Sherlock, G. Assembly of a phased diploid Candida albicans genome facilitates allele-specific measurements and provides a simple model for repeat and indel structure. Genome Biol. 14, R97 (2013).
54. Skrzypek, M. S. et al. The Candida Genome Database (CGD): incorporation of Assembly 22, systematic identifiers and visualization of high throughput sequencing data. Nucleic Acids Res. 45, D592–D596 (2017).
55. Li, H. & Durbin, R. Fast and accurate short read alignment with Burrows–Wheeler transform. Bioinformatics 25, 1754–1760 (2009). 56. Li, H. et al. The sequence alignment/map format and SAMtools.
Bioinformatics 25, 2078–2079 (2009).
57. McKenna, A. et al. The Genome Analysis Toolkit: a MapReduce framework for analyzing next-generation DNA sequencing data. Genome Res. 20, 1297–1303 (2010).
58. DePristo, M. A. et al. A framework for variation discovery and genotyping using next-generation DNA sequencing data. Nat. Genet. 43, 491 (2011). 59. Van der Auwera, G. A. et al. From FastQ data to high confidence variant calls:
the Genome Analysis Toolkit best practices pipeline. Curr. Protoc. Bioinforma. 43, 11.10.1–33 (2013).
60. Stamatakis, A. RAxML version 8: a tool for phylogenetic analysis and post-analysis of large phylogenies. Bioinformatics 30, 1312–1313 (2014). 61. R Development Core Team. R: A Language and Environment for Statistical
Computing (R Foundation for Statistical Computing, 2011).
62. Paradis, E., Claude, J. & Strimmer, K. APE: analyses of phylogenetics and evolution in R language. Bioinformatics 20, 289–290 (2004).
63. Korneliussen, T. S., Albrechtsen, A. & Nielsen, R. ANGSD: analysis of next generation sequencing data. BMC Bioinformat. 15, 356 (2014).
64. Danecek, P. et al. The variant call format and VCFtools. Bioinformatics 27, 2156–2158 (2011).
65. Reynolds, J., Weir, B. S. & Cockerham, C. C. Estimation of the coancestry coefficient: basis for a short-term genetic distance. Genetics 105, 767–779 (1983).
66. Wickham, H. ggplot2 - Elegant Graphics for Data Analysis (Springer, Verlag New York, 2009).
67. Purcell, S. et al. PLINK: a tool set for whole-genome association and population-based linkage analyses. Am. J. Hum. Genet. 81, 559–575 (2007). 68. Schliep, K. P. phangorn: phylogenetic analysis in R. Bioinformatics 27,
592–593 (2011).
69. de Hoon, M. J. L., Imoto, S., Nolan, J. & Miyano, S. Open source clustering software. Bioinformatics 20, 1453–1454 (2004).
70. Saldanha, A. J. Java Treeview—extensible visualization of microarray data. Bioinformatics 20, 3246–3248 (2004).
71. Kritikos, G. et al. A tool named Iris for versatile high-throughput phenotyping in microorganisms. Nat. Microbiol. 2, 17014 (2017).
72. Schneider, C. A., Rasband, W. S. & Eliceiri, K. W. NIH Image to ImageJ: 25 years of image analysis. Nat. Methods 9, 671–675 (2012).
73. Tukey, J. W. Comparing individual means in the analysis of variance. Biometrics 5, 99–114 (1949).
74. Untergasser, A. et al. Primer3Plus, an enhanced web interface to Primer3. Nucleic Acids Res. 35, W71–W74 (2007).
Acknowledgements
This work was supported by grants from the Agence Nationale de Recherche (ANR-10-LABX-62-IBEID), the Genoscope (projet #15 AP2008/2009 SNP C. albicans) and the Swiss National Science Foundation (Sinergia CRSII5_173863/1) to C.E., J.R. was sup-ported by a Pasteur-Roux fellowship from Institut Pasteur. D.D. was the recipient of a PhD fellowship from Institut National de la Recherche Agronomique. E.P. was the recipient of a post-doctoral fellowship from the Wellcome Trust (WT088858MA). M.M.-H. and T.G. were supported by a grant from the Spanish Ministry of Economy and Competitiveness, BFU2015–67107 cofunded by the European Regional Development Fund (ERDF). C.E., M.-E.B., S.H.K., and J.H.S. were supported by a grant from the French and Korean Ministries for Foreign Affairs (PHC STAR 2011 25841YA). R.C.M. was supported by project MitoFun, funded by the European Research Council under the European Union’s Seventh Framework Programme (FP/2007–2013)/ERC Grant Agree-ment No. 614562 and by a Wolfson Research Merit Award from the Royal Society. R.C. M. and K.V. were funded by the Surgical Reconstruction and Microbiology Research Centre, which is supported by the National Institute of Health Research, UK. G.S. was supported by the NIH grants R01-HG003468 and RO1-DE015873. C.E. and T.G. are members of the CNRS GDRI 0814 iGenolevures consortium. High-throughput sequencing has been performed on the Genomics Platform, member of France Géno-mique consortium (ANR10-INBS-09-08). We thank Bernard Dujon and Tatiana Giraud for providing insights on an earlier version of this manuscript.
Author contributions
J.R., C.E., and M.-E.B. conceived and conducted the study. M.-E.B., K.V., R.C.M., A.M.B., A.C., S.F., S.H.K., P.L.P., O.R., and J.H.S. provided strains. N.S., K.M., C.Bo., L.M., K.S., K.V., R.C.M., J.P., P.W., C.Ba., and G.S. undertook wet-lab work and sequencing of the samples. J.R., C.M., D.D., M.M.-H., T.G., M.-E.B., A.P., E.P., and G.L. analyzed data. J.R. and C.E. wrote the manuscript and all authors revised the manuscript and made comments.
Additional information
Supplementary Informationaccompanies this paper at https://doi.org/10.1038/s41467-018-04787-4.
Competing interests:The authors declare no competing interests.
Reprints and permissioninformation is available online athttp://npg.nature.com/ reprintsandpermissions/
Publisher's note:Springer Nature remains neutral with regard to jurisdictional claims in published maps and institutional affiliations.
Open Access This article is licensed under a Creative Commons Attribution 4.0 International License, which permits use, sharing, adaptation, distribution and reproduction in any medium or format, as long as you give appropriate credit to the original author(s) and the source, provide a link to the Creative Commons license, and indicate if changes were made. The images or other third party material in this article are included in the article’s Creative Commons license, unless indicated otherwise in a credit line to the material. If material is not included in the article’s Creative Commons license and your intended use is not permitted by statutory regulation or exceeds the permitted use, you will need to obtain permission directly from the copyright holder. To view a copy of this license, visithttp://creativecommons.org/ licenses/by/4.0/.