Università degli Studi di Ferrara
DOTTORATO DI RICERCA IN
FARMACOLOGIA E ONCOLOGIA MOLECOLARE
CICLO XXVCOORDINATORE Prof. ANTONIO CUNEO
A systems biology approach to non-coding RNAs: the networks of cancer
Settore Scientifico Disciplinare BIO/17
Dottorando Tutore
Dott. Galasso Marco Prof. Volinia Stefano
i
LIST OF PUBBLICATIONS
The thesis is based on the following papers and reviews, plus on the projected
AIRC 2010 (IG8588):
I Identification of microRNA activity by Targets' Reverse EXpression.
Volinia S, Visone R, Galasso M, Rossi E, Croce CM. Bioinformatics. 2010 Jan 1;26(1):91-7. Epub 2009 Nov 6.
II Non-coding RNAs: a key to future personalized molecular therapy? Galasso M, Elena Sana M, Volinia S. Genome Med. 2010 Feb 18;2(2):12
III Reprogramming of miRNA networks in cancer and leukemia. Volinia S, Galasso M, Costinean S, Tagliavini L, Gamberoni G, Drusco A, Marchesini J, Mascellani N, Sana ME, Abu Jarour R, Desponts C, Teitell M, Baffa R, Aqeilan R, Iorio MV, Taccioli C, Garzon R, Di Leva G, Fabbri M, Catozzi M, Previati M, Ambs S, Palumbo T, Garofalo M, Veronese A, Bottoni A, Gasparini P, Harris CC, Visone R, Pekarsky Y, de la Chapelle A, Bloomston M, Dillhoff M, Rassenti LZ, Kipps TJ, Huebner K, Pichiorri F, Lenze D, Cairo S, Buendia MA, Pineau P, Dejean A, Zanesi N, Rossi S, Calin GA, Liu CG, Palatini J, Negrini M, Vecchione A, Rosenberg A, Croce CM. Genome Res. 2010 May;20(5):589-99.
IV GAMES identifies and annotates mutations in next-generation sequencing projects. Sana ME, Iascone M, Marchetti D, Palatini J, Galasso M, Volinia S. Bioinformatics. 2011 Jan 1;27(1):9-13. Epub 2010 Oct 22.PMID: 20971986
V Prion proteins (PRNP and PRND) are over-expressed in osteosarcoma. Sollazzo V, Galasso M, Volinia S, Carinci F.J Orthop Res. 2011 Dec 6. doi: 10.1002/jor.22034. [Epub ahead of print]
VI Breast cancer signatures for invasiveness and prognosis defined by deep sequencing of microRNA.
Volinia S, Galasso M, Sana ME, Wise TF, Palatini J, Huebner K, Croce CM. Proc Natl Acad Sci U S A. 2012 Feb 21;109(8):3024-9. Epub 2012 Feb 6.
VII MicroRNA signatures associate with pathogenesis and progression of osteosarcoma. Jones KB, Salah Z, Del Mare S, Galasso M, Gaudio E, Nuovo GJ, Lovat F, Leblanc K, Palatini J, Randall RL, Volinia S, Stein GS, Croce CM, Lian JB, Aqeilan RI. Cancer Res. 2012 Feb 20.
ii
VIII MicroRNA expression signatures in solid malignancies. Galasso M, Sandhu SK, Volinia S. Cancer J. 2012 May-Jun;18(3):238-43.PMID:22647360
IX miR-155 targets histone deacetylase 4 (HDAC4) and impairs transcriptional activity of B-cell lymphoma 6 (BCL6) in the Eμ-miR-155 transgenic mouse model. Sandhu SK, Volinia S, Costinean S, Galasso M, Neinast R, Santhanam R, Parthun MR, Perrotti D, Marcucci G, Garzon R, Croce CM. Proc Natl Acad Sci U S A. 2012 Dec 4;109(49):20047-52. doi: 10.1073/pnas.1213764109. Epub 2012 Nov 19. PMID: 23169640 [PubMed - in process]
X Highly-Specific Transcribed-Ultra Conserved Regions in Human Embryonic Stem Cells. Galasso M, Dama P, Previati M, Sandhu S, Palatini J, Wise T, Warner S, Sana ME, Zanella R, Abujarour R, Desponts C, Teitell MA, Garzon R, Calin G, Croce CM & Volinia S.
Submitted
XI Estrogen mediated-activation of miR-191/425 cluster modulates tumorigenicity of breast cancer cells depending on Estrogen Receptor status. Di Leva G, Piovan C, Gasparini P, Ngankeu A, Taccioli C, Briskin D Douglas GC, Bolon B, Anderlucci L, Hansjuerg A, Nuovo G, Li M, Iorio MV, Galasso M, Ramasamy S, Marcucci G, Perrotti D, Powell AK, Brasatz A, Garofalo M, Nephew PK, and Croce MC. In Press PLOS Genetics
iii
CONTENTS:
SUMMARY
vii
ACKNOWLEDGMENTS
ix
1 INTRODUCTION
1.1 Gene regulation and post-transcriptional regulation
1
1.2 Non-coding RNAs
2
1.3 Transcribed ultraconserved region
5
1.4 microRNA biogenesis and function
6
1.5 microRNAs : oncogene and tumor suppressor roles
7
1.6 microRNA signatures in solid cancer and leukemia
9
1.7 microRNA target genes
15
1.8 High-throughput technology
18
iv
2 THESIS OBJECTIVES
26
3 THE TISSUE SPECIFICITY OF T-UCRs AND miRNAs
3.1 Material and Methods
27
3.1.1 Data analysis
28
3.1.2 Calculation of Information Content
29
3.1.3 Decision Tree
30
3.2 miRNAs tissue specificity in normal and embryonic samples
32
3.3 T-UCRs tissue specificity in normal and embryonic samples
35
4 CLASSIFICATION OF SOLID CANCER BY miRNA EXPRESSION
4.1 Material and Methods
41
4.1.1 Statistical Tests and Algorithms
41
4.2 miRNAs signatures in cancer samples
42
v
4.4 Identification of putative “classifier” miRNA
45
4.5 Feature selection and classification
49
5 REPROGRAMMING OF miRNA NETWORK
5.1 Material and Methods
53
5.1.1 Data analysis
53
5.1.2 Network generation
53
5.2 miRNA Bayesian network of normal samples
56
5.3 miRNA Bayesian network of solid cancers
58
5.4 miRNA Bayesian network of leukemia
63
6 IN SILICO, IN-VITRO AND IN-VIVO VALIDATION
6.1 Material and Methods
66
6.1.1 Cell line culture
67
vi
6.1.3 Real-time PCR
68
6.2 Real-Time PCR confirms the uc.283 plus specificity for ESC
68
6.3 Functional genome analysis: in silico validation
72
6.4 In vivo validation
75
7 FINAL DISCUSSION
77
REFERENCES
79
APPENDIX A
88
vii
SUMMARY
A non-coding RNA is a functional RNA molecule that is not translated into a protein.
This class of molecules is involved in many cellular processes and includes highly
abundant and functionally important RNAs such as transfer RNA (tRNA), ribosomal
RNA (rRNA), as well as small interfering RNAs (siRNAs), microRNAs (miRNAs) and
transcribed ultraconserved regions (T-UCRs). First of all, we investigate the
specificity of each of the classes studied of two selected non-coding RNA:
Transcribed UltraConserved Region and microRNAs. second, we want to find
whether these non-coding RNAs can be candidates as features for the selection of
specific cancers, using statistical algorithms and bioinformatics tools. Third, we
generate miRNA gene networks in normal and different cancer and leukemia. The
term “ultraconserved” refer to genomic regions longer than 200 bp that are absolutely
conserved (100% homology with no insertions or deletions) in human, mouse, and
rat genomes. There are 481 T-UCRs. The reason for this extreme conservation
remains a mystery; T-UCRs may play a functional role in the ontogeny and
phylogeny of mammals and other vertebrates. Genome-wide profiling revealed that
UCRs are frequently located on overlapping exons in genes involved in RNA
processing and can be found in introns or at fragile sites and in cancer-associated
genomic regions. We investigate the expression of T-UCRs in 374 normal samples
from 46 different tissues, grouped by 16 systems. Moreover, we analyzed the tissue
specificity of T-UCRs in cancers. Tissue specific T-UCRs can differentiate cell types.
We then examine the expression of T-UCRs in human embryonic stem cells,
induced pluripotent stem cells, and a series of differentiated cell types (trophoblast,
embryoid bodies at 7 and 14 days of differentiation, definitive endoderm, and
spontaneous differentiated monolayers). One T-UCR in particular, uc.283 plus, is
highly specific for embryonic and induced pluripotent stem cells, as confirmed by real
time PCR (RT-PCR). miRNAs are global regulators of protein output. Each miRNA
has been studied for its single contribution to differential expression or to a compact
viii
predictive signature. Thus, we propose a study of miRNAs in cancer by applying a
systems biology approach. We study miRNA profiles in 4419 human samples (3312
neoplastic, 1107 non-malignant), corresponding to 50 normal tissues (grouped by 17
systems) and 51 cancer types. We calculate tissue specificity and cancer type
specificity, a small set of miRNAs were tissue-specific while many others were
broadly expressed. Then we find whether non-coding RNAs can be candidates as
features for the selection of specific cancers, using statistical algorithms and
bioinformatics tools, as decision trees. Afterwards, we build miRNA gene networks
by using our very large expression miRNA database. The complexity of our
expression database enable us to perform a detailed analysis of coordinated miRNA
activities. We also build specialized miRNA networks for different solid tumors and
leukemias. Combining differential expression, genetic networks, DNA copy number
alterations and other systems biology approaches we confirm or discovered, miRNAs
with comprehensive roles in cancer. Normal tissues are represented by single
complete miRNA networks. Cancers instead show separate and unlinked miRNA
sub-networks. miRNAs independent from the general transcriptional program were
often known as cancer-related. We validate our finding by in silico, in vitro and in vivo
analysis. The target genes of these uncoordinated miRNA involve in specific
cancer-related pathways.
ix
ACKNOWLEDGMENTS
To Stefano and Sara,
to my family and my friends,
to all those believe in me…
“ The future belongs to those who believe in the beauty of their dreams”
1
1 INTRODUCTION
1.1 Gene regulation and Post-transcriptional regulation
Different cell types cells in a multicellular organism are capable of altering their
patterns of gene expression in response to extracellular signals [1]. There are many
steps in the pathway leading DNA to protein, and all of them can in principle be
regulated. Mechanisms that underlie the control of gene expression are becoming
increasingly well understood. There were principally six steps at which eukaryote
gene expression can be controlled: 1) transcriptional control; 2) RNA processing
control; 3) RNA transport control; 4) post-transcriptional control; 5) translational
control; 6) post-translational modification of the protein into its mature, functional form
control. We will focus on the mechanism of post-transcriptional regulation mediated
by non-coding RNAs.
2
1.2 Non-Coding RNAs
A non-coding RNA (ncRNA) is a functional RNA molecule that is not translated into a
protein. This class of molecules is involved in many cellular processes and includes
highly abundant and functionally important RNAs such as transfer RNA (tRNA) and
ribosomal RNA (rRNA), as well as small interfering RNAs (siRNAs), microRNAs
(miRNAs), PIWI-associated RNAs (piRNAs), small nucleolar RNAs (snoRNAs),
promoter-associated RNAs (PARs), the recently identified telomere specific small
RNAs (tel-sRNAs), long non-coding RNAs (lncRNAs) and transcribed ultraconserved
region ( T-UCRs). Moreover, this broad family of ncRNAs contributes to molecular
alterations in a number of pathological conditions [2].
SiRNAs are small RNAs, 21–22 nucleotides (nt) long, produced by Dicer cleavage of
complementary dsRNA duplexes. siRNAs form complexes with Argonaute proteins
and are involved in gene regulation, transposon control and viral defense.
PiRNAs, 24- 30 nt in length, are produced by a Dicer-independent mechanism,
associate with Piwi-class Argonaute proteins and are principally restricted to the
germline and bordering somatic cells. piRNAs are important for transposon control [3,
4] and regulate chromatin state [5]. A recent study suggests that an antisense RNA
may trigger transcriptional silencing of a partner sense tumor suppressor gene; this
effect occurs both in cis and in trans, and is Dicer-independent. The biochemical
mediators of this silencing involve a Piwi-like protein, as their role in mammals is just
beginning to be understood [6, 7]. In zebrafish, piRNAs have been implicated in germ
cell maintenance and many of them were mapped to transposons suggesting that
they play a role in silencing mechanisms of repetitive elements in vertebrates [8]. At
the moment, no relations between piRNAs and diseases have yet been disclosed.
SnoRNAs are small RNA molecules, approximately 60-300 nt long, which generally
serve as guides for the catalytic modification of selected ribosomal RNAs [9, 10]. In
vertebrates, most snoRNAs have been shown to reside in introns of protein coding
host genes and are processed out of the excised introns. snoRNAs can be divided
3
into two large groups, called box C/D snoRNAs and box H/ACA snoRNAs. Most of
them are responsible for guiding the 2'-O-ribose methylations (box C/D snoRNAs)
and pseudouridylations (box H/ACA snoRNAs) of ribosomal RNAs, transfer RNAs
and small nuclear RNAs [11] . Many snoRNAs have been described as retrogenes
[12]. Some snoRNA is processed to a small RNA that can function like a miRNA [13].
PARs encompass a suite of long and short RNAs, including promoter-associated
small RNAs (PASRs) and transcriptional initiation RNAs, that overlap promoter
regions. Their function is so far unknown but they possibly regulate transcription, as
exogenous PASRs have been observed to reduce expression of genes with
homologous promoter sequences [14].
Tel-sRNAs in mouse embryonic stem cells are approximately 24 nucleotides in
length, Dicer-independent, and 2'-O-methylated at the 3' terminus. The tel-sRNAs are
asymmetric with specificity toward telomere G-rich strand, are evolutionarily
conserved from protozoan to mammals and they may have a role in telomere
maintenance [15].
LncRNAs are often longer than 2 kb in length with a coding potential of less than 100
amino acids and the number of lncRNAs exceeds that of protein coding genes [16,
17]. Recently, several studies identify that many lncRNAs are known to be retained in
various sub-nuclear compartments [18] suggesting that such RNAs may have a
potential function in the compartment where they are localized [19].
4
Figure 1 Class of Non Coding RNAs.5
1.3 Transcribed Ultraconserved Regions
The term “ultraconserved” was originally proposed by Bejerano and colleagues to
refer to genomic regions longer than 200 bp that are absolutely conserved (100%
homology with no insertions or deletions) in human, mouse, and rat genomes [20].
Many of these elements possess tissue-specific enhancer activity [21-23] and others
have been shown to associate with splicing regulators. Evolutionary conservation has
become a powerful tool to identify functionally important regions in the human
genome[24] . A greater percentage of the shorter elements show extreme
conservation within mammals only and nearly 47% of ultraconserved elements in
human have been localized to exons of genes involved in RNA processing or in the
regulation of transcription and development [25].
The reason for this extreme conservation remains a mystery; but it suggests that
UCRs may play a functional role in the ontogeny and phylogeny of mammals and
other vertebrates. This idea is supported by findings that have identified a distal
enhancer and an ultraconserved exon derived from a novel retroposon active more
than 400 million years ago in lobe-finned fishes and terrestrial vertebrates, and
maintained as active in the “living fossil” coelacanth. A recent study showed the
concurrent presence of enhancer and transcript functions in non-exonic UCRs, and
suggested they may be long ncRNAs [26].
Scientific interest in T-UCRs has significantly increased when they were shown to be
involved in human carcinogenesis. Studies suggested that UCRs could contribute to
the development of several types of malignancies [27]. Genome-wide profiling
revealed that UCRs have distinct signatures in human leukemias and carcinomas
[28] and are frequently located at fragile sites and in cancer associated genomic
regions [29]. Recent clinical findings also suggest that T-UCR signatures can have
prognostic value in high-risk neuroblastoma patients [30]. It has been shown that
6
some T-UCRs are deregulated in neuroblastomas, which could provide additional
prognostic value in conjunction with MYC activity/amplification, currently used as a
clinical prognostic indicator [31].
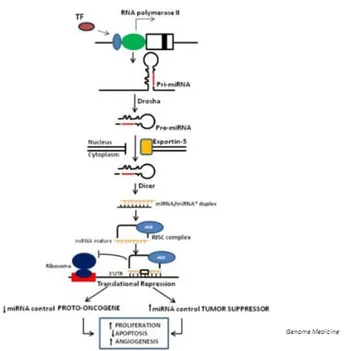
1.4 MicroRNA biogenesis and functions
miRNAs are a conserved class of non-coding RNAs that regulate the translation of
mRNAs (messenger RNAs) by inhibiting ribosome function, decapping the 5’Cap
structure, de-adenylating the poly(A) tail and degrading the target mRNAs [32].
MiRNAs are involved in mechanisms of gene regulation in both normal and diseased
conditions and play a role during development, regulation of cell proliferation and
apoptosis. The first miRNAs were identified in the nematode Caenorhabditis elegans,
as small RNAs that interacted with the 3’ untranslated region (UTR) of the lin-14
mRNA to inhibit its expression [33]. miRNAs are single-stranded RNAs of 19-24
nucleotides (nt) in length generated through a complex maturation process. MiRNAs
are transcribed by RNA polymerase II as molecules of variable length, the so-called
primary-miRNA (pri-miRNA). The pri-miRNA is cleaved by Drosha - a RNAse III
endonuclease that recognizes internal hairpin structures - and is then actively
exported by Exportin-5 to the cytoplasm as a miRNA precursor (pre-miRNA) of
approximately 70-120 nt. Once in the cytoplasm, the pre-miRNA is further digested
by the enzyme Dicer (another Ribonuclease III), that yields a 21-22 nt long
double-stranded RNA (dsRNA) with 2- nt long overhangs [34]. The active single-double-stranded
molecule(s) from this dsRNA associate(s) with several proteins to form the
RNA-induced silencing complex (RISC), which includes proteins of the Argonaute family
[6]. miRNAs bind mostly to mRNA segments originating from the 3’ UTRs of genes
[35] but the mechanism of translational repression is only partially understood.
7
1.5 microRNAs : oncogene and tumor suppressor roles
The number of miRNAs in the human genome has been steadily increasing, and is
now of 1600 (miRBase Release 19). Since their discovery, miRNAs quickly became
the protagonists in the limelight of cancer research. By targeting and controlling the
expression of mRNA, miRNAs can control highly complex signal-transduction
pathways and other biological pathways. The biologic roles of miRNAs in cancer
suggest a correlation with prognosis and therapeutic outcome. Dysregulation of
physiologic microRNA (miR) activity has been shown to play an important role in
tumor initiation and progression, the identification of differentially regulated miRNAs
in cancer suggested a functional involvement in carcinogenesis, assigning them at
times roles as tumor suppressors or as oncogenes.
Those miRNAs whose expression is increased in tumors may be considered as
oncogenes - also called “oncomiRs” - which promote tumor development by inhibiting
tumor suppressor genes and/or genes controlling cell differentiation or apoptosis.
The miR-17-92 cluster is a miRNA polycistron located at chromosome 13q31, a
genomic locus that is amplified in lung cancer and several kinds of lymphoma,
including diffuse large B-cell lymphoma. This cluster has been found to be regulated
by c-Myc, an important transcription factor that is over-expressed in many human
cancers .
Microarray analysis revealed that these miRNAs may act as anti-apoptotic factors in
human malignant disease. In several types of lymphomas, including Burkitt's
lymphoma, the expression of miR-155 is increased. Furthermore, miR-155 is located
in the only phylogenetically-conserved region of the BIC (B-cell receptor inducible)
gene, suggesting that miR-155 may be responsible for BIC’s oncogenic activity [36].
Conversely, under-expressed miRNAs in cancers, such as some members of the
let-7 family, may function as tumor suppressor genes by regulating oncogenes and/or
genes that control cell differentiation or apoptosis. Studies indicate that the RAS
oncogene is a direct target of let-7, which negatively regulates RAS by pairing to its
8
3′ UTR for translational repression. Some recent studies have focused on
microRNA-binding site polymorphisms. Let-7 microRNA-microRNA-binding site polymorphisms in the
KRAS 3' UTR have been associated with reduced survival in oral cancers [37]. Other
miRNAs that play a potential role as tumor suppressors include miR-15 and miR-16,
which induce apoptosis by targeting anti-apoptotic gene BCL-2 (B-cell lymphoma 2)
mRNA [38], MCL1 (myeloid cell leukemia sequence 1), CCND1 (cyclin D1), and
WNT3A (wingless-type MMTV integration site family, member 3A) [39].
MiRNAs are also involved in advanced stages of tumor progression, stressing their
roles as metastasis activators or suppressors [40].
9
1.6 microRNAs signatures in solid cancers and leukemia
The identification of differentially regulated miRNAs in cancer suggested a functional
involvement in carcinogenesis, assigning them at times roles as tumor suppressors
or as oncogenes. Such involvement exerts different effects based on the identity of
the regulated target genes within the affected tissues. To date, several studies have
addressed the different roles of miRNA in cancer establishment and progression.
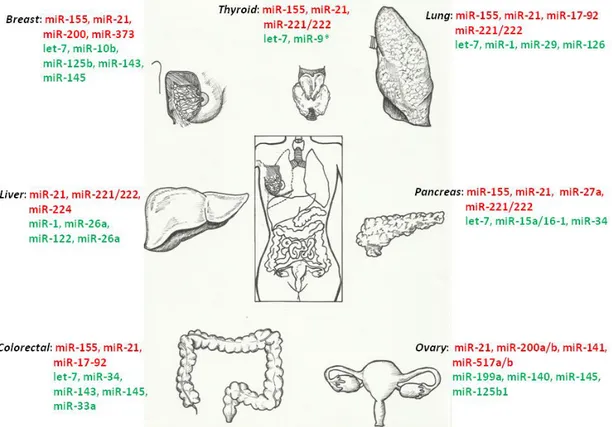
There are many relevant discoveries for each one of the major human solid cancer
types. Table A1 is an overview of prominent miRNAs associated to solid cancers.
Lung cancer is one of the first solid tumors in which microRNA expression patterns
have been studied extensively. Lebanony et al. developed a diagnostic assay based
on miR-205 expression that can distinguish squamous from adenocarcinoma
non-small-cell lung cancer (NSCLCs), with high sensitivity and specificity [41].
Knockdown of miR-31 represses lung adenocarcinomas cell clonal growth and in
vivo tumourigenicity, via LATS2 and PPP2R2A, two protein regulating tumor growth
[42]. miR-21 was found to drive lung tumorigenesis through inhibition of negative
regulators of the Ras/MEK/ERK pathway and inhibition of apoptosis. Let-7 was found
to play the opposite role, acting as a tumor suppressor, partially through functional
targeting of RAS, HMAG2 [43] and MYC [44]. Furthermore, reduced let-7 gene
expression in NSCLC patients was correlated with poor prognosis [45, 46]; and a
SNP in a let-7 complementary site in the KRAS 3′ UTR region increased NSCLC risk
[47]. Pancreatic cancer (PC) is a highly aggressive malignancy with worst prognosis.
The first approach used for identification of miRNA was the expression profiling of
human specimens pancreatic adenocarcinoma paired normal pancreas, chronic
pancreatitis and pancreatic cancer cell lines. Several studies have recently shown
the deregulation of miRNA expression in PC tumor tissues using miRNA array
technology and real-time PCR analysis [48-50]. These works identified, through
independent different studies, a group of miRNAs up-regulated that increase
10
proliferation, tumorigenesis and invasion: miR-21 [51], miR-155 [52], miR-27a [53],
miR-210 [54] ,miR-221/222 [50] and miR-196a-2 and miR-10b, that also may be
negative survival predictor [49, 55]. On the other hand, there is a group of microRNA
down-regulated having the opposite role: miR-146a [56], miR-20a [57], miR-96 [58]
and miR-375 [49]. Aberrant expression of this set of miRNAs were independently
associated with reduced survival. In plasma and in serum of patient with PC
microRNAs has been suggested as a novel noninvasive approach of prognostic
biomarkers [59, 60]. Iorio et al [61] reported the first 13 miRNA expression signature
in breast cancer that was able to precisely discriminate between normal and tumor
tissue. MicroRNA expression has also been shown to relate to some histopathologic
features of breast carcinoma, such as estrogen receptor (ER) and progesterone
receptor expression, grade and stage, and presence of invasion. Studies have been
undertaken to investigate the correlation between microRNA expression and the
classification in different subtypes of breast cancer. Among the differentially
expressed and consistently deregulated miRNAs in breast cancer, 10b,
miR-125b, and miR-145 are down-regulated, while miR-21 and miR-155 are up-regulated
which indicates their tumor suppressor or oncogenic roles, respectively. miR-21 is
associated with advanced clinical stage, lymph node metastasis, and poor patient
prognosis in breast cancer [62, 63]. miR-21 is known for regulation of cell survival
and proliferation through direct targeting of tumor suppressor genes like PTEN,
PDCD4 and TPM1. Iorio et al [61] reported the first 13 miRNA expression signature
in breast cancer that was able to precisely discriminate between normal and tumor
tissue. MicroRNA expression has also been shown to relate to some histopathologic
features of breast carcinoma, such as estrogen receptor (ER) and progesterone
receptor expression, grade and stage, and presence of invasion. Studies have been
undertaken to investigate the correlation between microRNA expression and the
classification in different subtypes of breast cancer. Among the differentially
expressed and consistently deregulated miRNAs in breast cancer, 10b,
miR-125b, and miR-145 are down-regulated, while miR-21 and miR-155 are up-regulated
11
which indicates their tumor suppressor or oncogenic roles, respectively. miR-21 is
associated with advanced clinical stage, lymph node metastasis, and poor patient
prognosis in breast cancer [62, 63]. miR-21 is known for regulation of cell survival
and proliferation through direct targeting of tumor suppressor genes like PTEN,
PDCD4 and TPM1. Next generation sequencing experiment proposed by Farazi et
al. presented a comparative analysis of miRNA read frequencies from different
histological subtypes of breast cancer (normal breast samples, most non-invasive
ductal carcinoma in situ and invasive carcinomas) by deep sequencing. They showed
and confirmed the increment of level of miR-21 and multiple decreased miRNA
families, including miR-98/let-7 [64]. Afterward, Volinia et al. identified nine-microRNA
that differentiated invasive from in situ ductal carcinoma: let-7d, miR-210, and -221
were down-regulated in the in situ and up-regulated in the invasive transition.
miR-210 had also a prognostic meaning for overall survival and time to metastasis [65].
MiRNA signatures obtained from different histotypes of ovarian carcinomas (serous,
endometrioid, clear cell, and mixed) uncovered several miRNAs which appear to be
specific to the histotypes compared to the normal tissues. In endometrioid tumors,
the four most significantly up-regulated miRs include miR-200a, miR-200b, miR-200c
and miR-141 which were also present in other types of ovarian cancer [66]. In
addition, miR-21, overexpressed in several solid tumors, where it exerts
anti-apoptotic effect, was also found to be highly up-regulated. Alternatively, down
modulation of microRNAs such as miR-222, which is known to target c-Kit, has been
observed in endometrioid tumors. C-Kit is involved in cancer and is down-regulated
in folate deficient conditions. Aberrant expression of several miRs: 214,
miR-199a*, miR-200a, and miR-100 have been detected in a near or over half of ovarian
cancers, especially in late-stage and high-grade tumors. Hepatocellular carcinomas
(HCCs) may have a distinct miRNA expression fingerprint according to malignancy,
risk factors, and oncogene/tumor suppressor gene alterations. Dissecting these
relationships provides a new hypothesis to understand the functional impact of
miRNA deregulation in liver tumorigenesis and the promising use of miRNAs as
12
diagnostic markers. Ladeiro et al. [67] analyzed the expression levels of 250 miRNAs
in 46 benign and malignant hepatocellular tumors and compared to those of 4 normal
liver samples with qRT-PCR. miRNAs associated with genetic and clinical
characteristics were validated in a second series of 43 liver tumor samples and 16
non-tumor samples. Their study identified and validated miR-224 overexpression in
all tumors and miR-200c, miR-200, miR-21, miR-224, miR-10b, and miR-222 specific
deregulated in benign or malignant tumors. Lately, Pineau et al. identified a set of 12
miRNAs linked to disease progression and demonstrated that the over-expression of
miR-221 was protumorigenic in vivo, stimulated growth of tumorigenic murine hepatic
progenitor cells [68]. Altered expression of microRNAs have a functional role in the
initiation and progression of colon cancer. Schetter et al., in one of the first studies
with a large cohort of colon adenocarcinoma patients samples, identified thirty-seven
microRNAs differentially expressed in tumors from the test cohort. Again, high levels
of miR-21 was associated with poor survival and poor therapeutic outcome [69].
Lately, in a subsequent study they found systematic changes in eight inflammatory
gene ( IL-8, IL-23a, IL-1a, IL-1b, IL-
17a, INFγ , IL-6 and FOXP3 ) expression in colon
tumors; that was associated with miR-21 expression. They suggested that the
combination of inflammatory genes and miR-21 expression can be a better predictor
of prognosis [70].
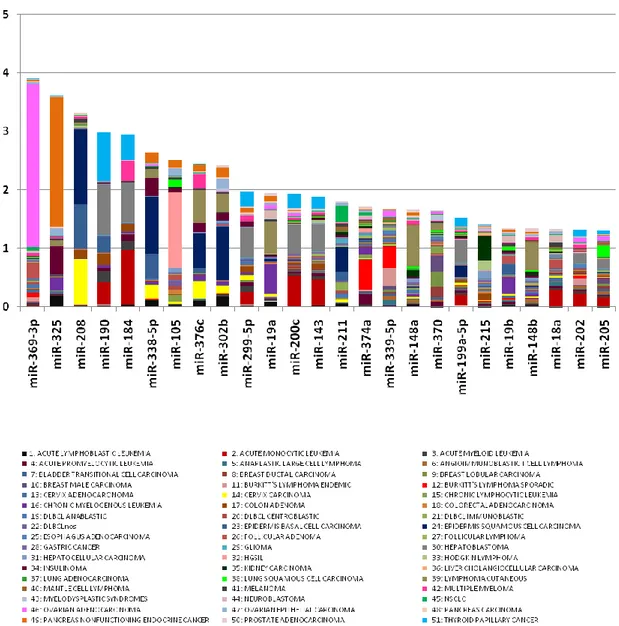
13
Figure 3 The most important miRNAs differentially regulated in solid cancers. miRNAs are either red (over-expressed) or green (down-regulated).
The role of miRNA in cancer was first discovered in leukemia. Calin et al. [71]
reported evidence for the role of miRNAs in the pathogenesis of CLL deletions and/or
down-regulation of miR-15a and miR-16-1 at chromosome 13q14 were associated
with CLL. Afterward, a study demonstrated that this cluster can regulate the
expression of the BCL-2 (B-cell lymphoma 2) oncogene [72]. Other relevant
alterations of miRNAs in CLL include down-regulation of miR-181a, let-7a, miR-30d,
miR-150 and miR-92 , and over-expression of miR-155. In Table A2 are resumed the
principal miRNAs associated to leukemia and hematologic diseases. miR-155 and
miR17-92 cluster are commonly amplified in B-cell lymphoma patients and together
14
were among the earliest ncRNAs to be linked cancer. miRNA expression signatures
have revealed differences between acute lymphoblastic leukemia (ALL) and acute
myeloid leukemia (AML) [73]. Specific miRNA were correlated to karyotype
alterations in AML , that have reported microRNA signatures associated with
cytogenetics and prognosis of AML, with molecular abnormalities like translocations
t(11q23), trisomy 8 and FLT3 (receptor tyrosine kinase) internal tandem duplication
(ITD) mutations. Down-regulation of miR-221 and miR-222 was observed in AML
[74].
15
1.7 microRNA target genes
The explication of the miRNA activity is strictly related to mRNA targets. In order to
predict miRNA target interactions, many computational approaches have been
developed. The topic of these software predicts biological targets of miRNAs by
searching for the presence of conserved 8mer and 7mer sites that match the seed
region of each miRNA [75]. Experimental evidence were needed to validate the
target prediction. Below there are list some of the published and most used
algorithms.
TargetScan [76] was one of the first RNA fold program and a total free binding
energy is calculated with the RNAeval algorithm. The free energy is converted to a
zscore and predictions in each organism are ranked. The algorithm takes three
parameters: one that defines the relation between the binding energy and the
z-score, a z-score cut-off, and a ranking cutoff value. As an option, nonconserved sites
are also predicted . TargetScanHuman considers matches to annotated human
UTRs and their orthologs, as defined by UCSC whole-genome alignments.
Conserved targeting has also been detected within open reading frames (ORFs).
“TargetScan” is one of the earliest published algorithms, it has maintained its role as
a gold standard in many experiments.
RNA22 [77] is a pattern-based algorithm for the discovery of microRNA target sites
and the corresponding heteroduplexes Statistical significance of each individual motif
is assessed by training a second-order Markov chain. The key idea of rna22 is that
the reverse complement of any salient sequence features that one can identify in
mature microRNA sequences (using pattern discovery techniques) should allow one
to identify candidate microRNA target sites in a sequence of interest: once a
candidate microRNA target site has been located, the targeting microRNA can be
identified with the help of any of several algorithms able to compute RNA:RNA
heteroduplexes.
16
miRanda miR-SVR [78] are incorporated in microRNA.org , as a target searcher tool.
mirSVR is a machine learning method for ranking microRNA target sites by a
down-regulation score. The algorithm trains a regression model on sequence and
contextual features extracted from miRanda-predicted target sites. It uses the same
basic principles of TargetScan, but there are some difference in the calculation of
the score.
PITA [79] is an algorithm, published in 2007 by Kertesz and coworkers, mainly
based on secondary RNA structure. This application can be run as a standalone
version or as a webserver. The main assumption is based on the fact that the mRNA
structure plays a role in target recognition by thermodynamically promoting or
disfavoring the interaction, using complementarity analysis within seed regions
(single mismatch or G:U wobble pairing can be allowed) and then compares the free
energy gained from the formation of the miRNA-target duplex and the energetic cost
of unpairing the target to make it accessible to the miRNA.
PicTar [80] searches for nearly but not fully complementary regions of conservative
3’UTRs and then calculates the free energy of created duplexes. Each result is
scored using Hidden-Markov Model . miRNAs with multiple alignments are favored.,
It was the first method that considered a parallel expression on the cellular level or an
action in a common biological pathways of a miRNA and transcript, co-expressed
miRNAs are more likely to target the same mRNAs. According to the authors, adding
probabilistic knowledge about co-expression significantly increases specificity. It uses
sequence alignment to eight vertebrate species to eliminate false positive results and
it scores the candidate genes of each species separately to create a combined score
for a gene.
Diana microT [81, 82] is an algorithm based on the use of uses a 38nt-long frame
that is moved along 3’UTR , searching for sites with canonical central bulge and it
requires 7, 8 or 9 nt–long complementarity in 5’ region of miRNA. 6 nt-long matches
17
within seed region or with one wobble pairing are also considered while enhanced by
additional base pairing in 3’ region of miRNA. DIANA-mciroT use conservative
alignment for scoring but also considers non-conservative sites. It gives unique
signal-to-noise ratio (SNR) which is a ratio between a total of predicted targets by
single miRNA in searched 3’UTR and a total of predicted targets by artificial miRNA
with randomized sequence in searched 3’UTR. Another tool of the same platform is
DIANA-mirPath [83], that is able to integrate human and mouse microRNAs in known
cellular pathways.
18
1.8 High-throughput technology
One of the first high-throughput technology was microarray. Microarray technology
evolved from Southern blotting, where fragmented DNA is attached to a substrate
and then probed with a known DNA sequence. A DNA microarray is used in
molecular biology and medicine, it consists of a collection of microscopic DNA spots
attached to a solid surface. Scientists use DNA microarrays to measure the
expression levels of large numbers of genes simultaneously or to genotype multiple
regions of a genome. Each DNA spot contains picomoles (10−12 moles) of a specific
DNA sequence, known as probes (or reporters or oligos). These can be a short
section of a gene or other DNA element that are used to hybridize a cDNA or cRNA
(also called anti-sense RNA) sample (called target) under high-stringency conditions.
Probe-target hybridization is usually detected and quantified by detection of
fluorophore-, silver-, or chemiluminescence-labeled targets to determine relative
abundance of nucleic acid sequences in the target.
The core principle behind microarrays is hybridization between two DNA strands, the
property of complementary nucleic acid sequences to specifically pair with each other
by forming hydrogen bonds between complementary nucleotide base pairs. A high
number of complementary base pairs in a nucleotide sequence means tighter
non-covalent bonding between the two strands. After washing off of non-specific bonding
sequences, only strongly paired strands will remain hybridized. Fluorescently labeled
target sequences that bind to a probe sequence generate a signal that depends on
the hybridization conditions (such as temperature), and washing after hybridization.
Total strength of the signal, from a spot (feature), depends upon the amount of target
sample binding to the probes present on that spot. Microarrays use relative
quantization in which the intensity of a feature is compared to the intensity of the
same feature under a different condition, and the identity of the feature is known by
its position. Many types of arrays exist and the broadest distinction is whether they
are spatially arranged on a surface or on coded beads: traditional solid-phase array
19
is a collection of orderly microscopic "spots", called features, each with a thousands
of identical and specific probes attached to a solid surface, such as glass, plastic or
silicon biochip (commonly known as a genome chip, DNA chip or gene array).
Thousands of these features can be placed in known locations on a single DNA
microarray. The alternative bead array is a collection of microscopic polystyrene
beads, each with a specific probe and a ratio of two or more dyes, which do not
interfere with the fluorescent dyes used on the target sequence.
DNA microarrays can be used to detect DNA (as in comparative genomic
hybridization), or detect RNA (most commonly as cDNA after reverse transcription)
that may or may not be translated into proteins. There are many different types of
microarray-based assays:
-
DNA microarrays for transcriptomics research
-
DNA tiling arrays for ChIP on chip experiments
-
DNA microarrays for genotyping
-
DNA microarrays for resequencing
-
Protein microarrays to detect protein-protein interactions
-
Antibody-Based Protein Array for protein quantification
-
Chromatin Immunoprecipitation Assay (ChIP)
-
Single Nucleotide Polymorphism (SNP) array
-
Tissue Microarray.
Microarray Expression Analysis: In this experimental setup, the cDNA derived from
the mRNA of known genes is immobilized. The sample has genes from the normal as
well as the diseased tissues, or from cells in differentiation. Spots with more
intensity are obtained for diseased tissue gene if the gene is over expressed in the
diseased condition. This expression pattern is then compared to the expression
pattern of a gene differentially expressed, in this context microarray analysis could be
used as a “phenotyping tool”. Furthermore, It can be useful for the determination of
20
molecular pathways: analysis of gene-expression changes in biological systems that
model disease might lead to the identification of pathways that play a crucial role in
disease pathogenesis. Another analysis is represented by the global assessment of
drug effects in appropriate cell, or animal model systems or patient samples. Besides
steady-state effects, it is also possible to determine the kinetics of the expression
response as different genes respond in a time-dependent fashion at different
intervals following a perturbation, or it is possible determinate comprehensively how
cells or tissues respond to a particular drug might make it possible to predict either
efficacy or adverse effects to a drug, eventually providing the presence of
biomarkers that can be used to readily monitor drug efficacies as well as side effects
and disease progression. In order to identify genomic copy number variations (CNV)
across the whole genome at a different resolution levels, it is possible use an array,
named Comparative genomic hybridization array ( aCGH).
In order to analyze miRNAs profiling, many microarray based on miRNA were
developed too. There are many platforms that can perform miRNA array profiling, for
example Agilent, Affymetrix, Exiqon, Illumina, etc.
21
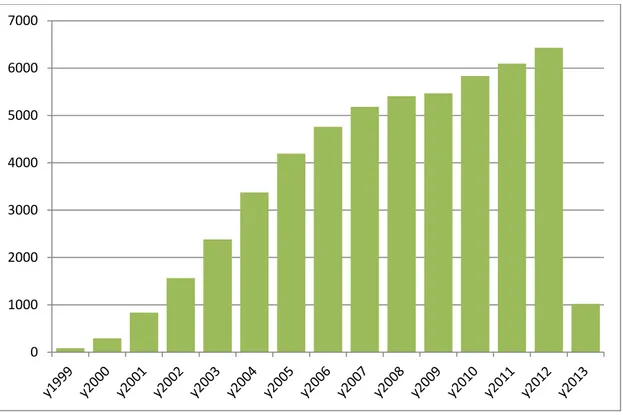
Figure 4 Graphic result of the research of "microarray" term per year in citation (
Figure is obtained using information from
http://www.ncbi.nlm.nih.gov/pubmed/?term=microarray)
The number of scientific articles that have used microarray technology had
exponentially grew up in the last fifteen years (Figure 4). The huge amount of
information obtained by this technology are available online for all user, there are
many public database for microarray data. The database meant to be central
repositories and the most known are:
- GEO- Gene expression omnibus (http://www.ncbi.nlm.nih.gov/geo/):
It uses the annotation standard Minimum Information About a
Microarray Experiment (MIAME) and serves as a public repository for a wide range of
high-throughput experimental data. These data include single and dual channel
0 1000 2000 3000 4000 5000 6000 7000
22
microarray-based experiments, measuring the abundance of mRNA, genomic DNA
and protein molecules. Data from non-array-based high-throughput functional
genomics and proteomics technologies are also archived. Several tools are provided
to assist with the visualization and exploration of GEO data, including hierarchical
cluster heat maps and searchable individual gene expression profiles.
Figure 5 Screenshot of GEO interface (http://www.ncbi.nlm.nih.gov/geo/).
- ArrayExpress Archive (http://www.ebi.ac.uk/arrayexpress/):
It uses the annotation standard MIAME and the associated
XML data exchange format Microarray Gene Expression Markup Language
(MAGE-ML) and it is designed to store well annotated data in a structured way. Consists of
the database itself, data submissions in MAGE-ML format or via an online
submission tool MIAMExpress, online database query interface, and the Expression
Profiler online analysis tool.
23
24
1.9 Regulatory networks
A biological networks use a directed graph representation in an effort to model the
way that proteins and other biological molecules are involved in gene expression. A
gene regulatory network (GRN) is a collection of DNA segments in a cell which
interact with each other (indirectly through their RNA and protein expression
products) and with other substances in the cell, thereby governing the rates at which
genes in the network are transcribed into RNA.
A typical gene regulatory network might be defined like this: the nodes of the network
are proteins, their corresponding mRNAs, or protein/protein complexes. Edges
between nodes represent individual molecular reactions, the protein/protein or
protein/mRNA interactions through which the products of one gene affect those of
another. These interactions can be inductive, with an increase in the concentration of
one leading to an increase in the other, or inhibitory, with an increase in one leading
to a decrease in the other. A series of edges indicates a chain of such dependences,
with cycles corresponding to feedback loops. The network structure is an abstraction
of the system's chemical dynamics, describing the manifold ways in which one
substance affects all the others to which it is connected. In one instance, such GRNs
can be inferred from the biological literature on a given system and represent a
distillation of the collective knowledge about a set of related biochemical reactions.
Genes can be viewed as nodes in the network, with input being proteins such as
transcription factors, and outputs being the level of gene expression. The node itself
can also be viewed as a function which can be obtained by combining basic functions
upon the inputs (in the Boolean network described below these are Boolean
functions, typically AND, OR, and NOT). These functions have been interpreted as
performing a kind of information processing within the cell, which determines cellular
behavior. The basic drivers within cells are concentrations of a macromolecule, which
determine both spatial (location within the cell or tissue) and temporal (cell cycle or
developmental stage) coordinates of the cell. The gene networks are only beginning
25
to be understood, and it is a next step for biology to attempt to deduce the functions
for each gene "node", to help understand the behavior of the system in increasing
levels of complexity, from gene to signaling pathway, cell or tissue/organ level
(“systems biology”). Mathematical models of GRNs have been developed to capture
the behavior of a system, and in some cases generate predictions corresponding to
experimental observations. We used a Bayesian approach.
Bayesian networks (BNs) or Bayes nets for short, are considered a kind of
probabilistic graphical models. These graphical structures are used to represent
knowledge about an uncertain domain. In particular, each node in the graph
represents a random variable, while the edges between the nodes represent
probabilistic dependencies among the corresponding random variables. Using known
statistical and computational methods the conditional dependencies in the graph are
estimated; so it is possible combine principles from graph theory, probability theory,
computer science, and statistics.
Graphical models with undirected edges are generally called Markov random fields or
Markov networks. These networks provide a simple definition of independence
between any two distinct nodes. BNs correspond to another graphical models
structure known as a directed acyclic graph. BNs are both mathematically rigorous
and intuitively understandable. They enable an effective representation and
computation of the joint probability distribution over a set of random variables.
The structure of a directed acyclic graph is defined by two sets: the set of nodes
(vertices) and the set of directed edges.
The nodes represent random variables and are drawn as circles labeled by the
variable names. The edges represent direct dependence among the variables and
are drawn by arrows between nodes. In particular, an edge from node 1 to node 2
represents a statistical dependence between the corresponding variables [84, 85].
Thus, the arrow indicates that a value taken by variable depends (influences) on the
value taken by another variable.
26
2 THESIS OBJECTIVES
The aim of the thesis was to answer the question whether the non-coding RNAs
expression data can be used for a classification of the normal tissues and of the
several cancers using system biology approaches. Therefore we want to investigate
the specificity of each of the classes studied of non-coding RNA, as Transcribed
UltraConserved Region and microRNAs. Furthermore, we want to find whether
non-coding RNAs can be candidates as features for the selection of specific cancers,
using statistical algorithms and bioinformatics tools. Then, we decided to infer
Bayesian networks for miRNAs in normal and cancer samples to identify the relations
between their expression and pathological role. In order to prove our expression data
analysis and the networks of cancers, we want to apply: in silico validation using
several bionformatic approaches on data available in our and public database,
experimental validations using biologic and molecular technics of laboratory. We
expect our results to show evidences which sustain the use of non-coding RNAs
expression data for the characterization of cancers and eventually the identification of
new markers of cellular subpopulations of cancer.
Consequently, the aims of the thesis were :
i. Calculate tissue specificity of the non-coding RNAs in normal samples, using our
large expression database;
ii. Classification of solid cancer by non-coding RNAs;
iii. Elaboration of the miRNA bayesian networks of cancers;
iv. In silico, in vitro and in vivo validation.
27
3 THE TISSUE SPECIFICTY OF T-UCRs AND miRNAs
3.1 Material and Methods
Microarray analysis was performed miRNA microarray assay on a CodeLink platform.
The miRNA array consists of 4,104 probes printed in duplicate. This array can
simultaneously profile more than 1,500 mature miRNAs and their corresponding
precursor [86]. The Ohio State University Comprehensive Cancer Center custom
microarray was used for T-UCR expression profiling following previously published
protocols. For each UCR two 40-mer probes were designed, one corresponding to
the
sense genomic sequence (named “+” or “plus”) and the other to the
complementary sequence (named “+A” or “minus”). Each oligo was printed in
duplicate in two different slide locations, and therefore quadruplicate numerical
values were available for analysis. Briefly, 5 micrograms of total RNA were used for
hybridization of miRNA microarray chips. These chips contain gene-specific
oligonucleotide probes, spotted by contacting technologies and covalently attached
to a polymeric matrix. The microarrays were hybridized in 6X SSPE (0.9 M NaCl/60
mM NaH2PO4 ·H2O/8 mM EDTA, pH 7.4)/30% formamide at 25°C for 18 hrs,
washed in 0.75X TNT (Tris·HCl/ NaCl/ Tween 20) at 37°C for 40 minutes, and
processed by using a method of detection of the biotin-containing transcripts by
streptavidin-Alexa647 conjugate. Processed slides were scanned using a microarray
scanner (Axon), with the laser set to 635 nm, at fixed PMT setting, and a scan
resolution of 10 mm. Microarray images were analyzed by using GenePix Pro and
post-processing was performed [87] . Briefly, average values of the replicate spots of
each miRNA were background-subtracted and subject to further analysis. miRNAs
were retained when present in at least 20% of samples and when at least 20% of the
miRNA had fold change of more than 1.5 from the gene median. Absent calls were
thresholded prior to normalization and statistical analysis. Normalization was
performed by using the quantiles method. MicroRNA nomenclature was according to
28
the microRNA database at Sanger Center [88] . The expression data analyzed in this
study
can
be
accessed
at
the
NCBI
Gene
Expression
Omnibus
(http://www.ncbi.nlm.nih.gov/geo) under accession nos. GSE8126 and GSE7055,
GSE17155, GSE3467, GSE7828, GSE6857, GSE16654, and GSE14936, and at
ArrayExpress (www.ebi.ac.uk/microarray-as/ae) under accession nos. E-TABM-866,
664 762 and 763, 508, 429,
TABM-434, TABM-405, TABM-343, TABM-41 and TABM-42, TABM-48,
E-TABM-22 , E-TABM-23, ETABM-46, E-TABM-47, E-TABM-49, and E-TABM-50, and
E-MEXP-1796, E-TABM-37, E-TABM-341, E-TABM-969 and E-TABM-970 for normal
tissues, E-TABM-971 for breast cancer, E-TABM-972 and E-TABM-974 for acute
myeloid leukemia, E-TABM-973 for chronic lymphocytic leukemia and E-TABM-975
for ovarian cancer.
3.1.1 Data analysis
We have developed an SQL miRNA internal database that contained the data
retrieved from a large number of different experiments performed with miRNA
microarray. Bad spots were removed. Non-Expressed spots were averaged for each
gpr files (chip). For each mature miRNA, we computed the geometric mean of its
multiple reporters in the chip. A NaN value was assigned to miRNAs with more than
50% of corrupted spots, as reported by the GenePix image analysis software. All the
results were log2-transformed. The Normalization was performed by using the
quantiles normalization, as implemented in Bioconductor "affy" package [89].
Quantile normalization is a non-parametric procedure and the algorithm mapped
every value on any one chip to the corresponding quantile of the standard
distribution. BRB Arraytools was used to perform t-test over 2-classes experiments of
F-tests over multiple classes.
29
3.1.2
Calculation of Information Content
First, all samples were classified according to their organ-, tissue- and celltype; then
the normal samples were grouped in specific systems and the disease samples in
specific pathological states. To assess the specificity of miRNA expression across
groups, we needed to estimate what fraction of the total, for a given miRNA belonged
to each single group. We used the procedure described in the first miRNA expression
atlas [90], with the only exception that we called Em,t the value of miRNA m in the
group t referred to as "mean expression value” (subtracted of the background value,
100). From here onwards, we essentially proceeded as the reference, therefore: To
allow for comparisons between tissue types, we first normalized the counts in each
tissue type t:
Fm,t = Em,t / Σm' Em',t
If a miRNA m is expressed with high specificity in tissue type t, then the value Fm,t is
large (close to 1) not only relative to other miRNAs m' m in the same tissue type t (or
column of F), but also relative to the same miRNA m in other tissue types t'≠ t. It is
then natural to normalize the lines of F as:
Gm,t = Fm,t / Σt' Fm,t'
Each line m of G contains a distribution of normalized frequencies of miRNA m
across samples. When Gm,t* is close to 1 in tissue t*, we may infer that miRNA m is
specifically expressed in tissue type t*, meaning that a large fraction of clones in t*
and much smaller fractions of clones in other t≠ t* correspond to miRNA m. We use
the information-theoretic concept of "information content" to quantify how strongly
biased the distribution of Gm,t is for a given m:
30
sm = log2(number of tissue types) + t ΣGm,t log2(Gm,t).
The specificity score varies between 0, when the expression level of the miRNA m is
the same across all tissues, and log2 of the number of tissue types, when only one
tissue expresses the miRNA. To minimize artifacts from miRNAs or tissues with very
small expression levels, we considered only miRNAs with a total expression value
above 10 times the number of normal tissues and above 100 times the number of
cancer types; with a minimal expression value (after background subtraction) of 100.
For the calculation of overall specificity, we thus included 130 and 133 different
mature miRNAs for normal tissues and cancer, respectively. Therefore, it is possible
that we missed some specifically expressed miRNAs that in our data had either very
low expression or were specific to tissues/diseases that we did not sample
sufficiently. The same approach is used for the T-UCR information content.
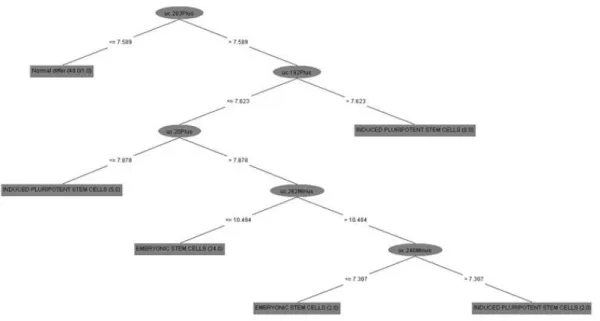
3.1.3 Decision Tree
The expression matrix of T-UCRs values was used to infer an ultra-selection system
using weka software [91]. First, for all the samples we have applied a supervised
attribute filter to select attributes (in this case the T-UCRs expressions value). This
process has selected 16 attributes; after we used the weka classifiers trees J48 graft
-C 0.25 -M 2, in order to calculate how these attributes produce an accurate
classification of the tissue selected. We used also JRip (RIPPER) algorithms.
Classes were examined in increasing size and an initial set of rules for the class was
generated using incremental reduced error JRip proceeds by treating all the
examples of a particular judgment in the training data as a class, and finding a set of
rules that cover all the members of that class. So, it proceeded to the next class and
repeat the same, repeating this until all classes have been covered. J48 is an open
source Java implementation of the C4.5 algorithm in the weka data mining tool. C4.5
31
builds decision trees from a set of training data, using the concept of information
entropy. The training data is a set S = (s_1, s_2, ...) of already classified samples.
Each sample s_i consists of a p-dimensional vector and the x_j represent attributes
or features of the sample, as well as the class in which s_i falls. At each node of the
tree, C4.5 chooses the attribute of the data that most effectively splits its set of
samples into subsets enriched in one class or the other. The splitting criterion is the
normalized information gain (difference in entropy). The attribute with the highest
normalized information gain is chosen to make the decision. The C4.5 algorithm then
recourses on the smaller sub-lists. All the samples in the list belong to the same
class. When this happens, it simply creates a leaf node for the decision tree saying to
choose that class. None of the features provide any information gain. In this case,
C4.5 creates a decision node higher up the tree using the expected value of the
class. Work flow of the information that we have used for performing analysis using
weka software are in APPENDIX B.
32
3
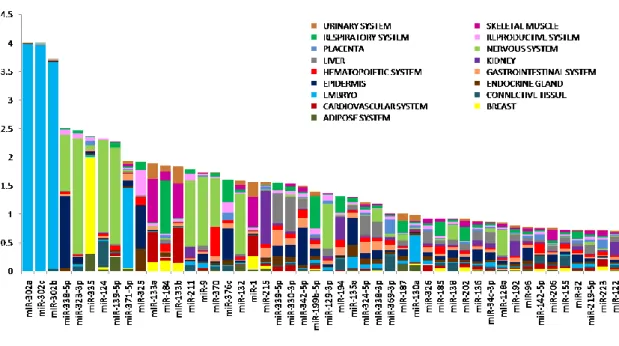
.2 miRNAs tissue specificity in normal and embryonic samples
The first microRNA that we found specific for the embryonic cell types was the
hsa-miR-302: embryonic cell types, such as embryonic bodies, trophoblasts, endoderm,
or other stem cells including induced pluripotent stem cells (iPS) also harbored high
levels of this miRNA. In the figure 7, after hsa-miR- 302, the most specific miRNAs
were hsa-miR-338-5p, hsa-miR-323-3p, and hsa-miR-335, with presented highest
expression in epidermis /nervous system, nervous system and breast respectively.
All the values of the IC were listed in the Table A3.
Hsa-miR-371-5p was here well represented in embryonic cell types, in particular
there was a high hsa-miR-371-5p expression in embryoid bodies. Hsa-miR-129-3p is
specific for nervous system in both datasets. We detected hsa-miR-142-5p in
hematopoietic system and connective tissues. Hsa-miR-9, miR-128 and
hsa-miR-138 were expressed in nervous system.
Nevertheless, the IC distributions were very similar: 25 miRNAs with IC higher than
1.35 for the microarrays. The most notable IC was without doubt the
hsa-miR-302a/b/c.
33
Figure 7. miRNA specificity in 50 normal tissues grouped by system. The tissue specificity was calculated by using the information content (IC), value expressed on y-axis; each color represents a system. miR-302 cluster is the most representative for embryo tissues.
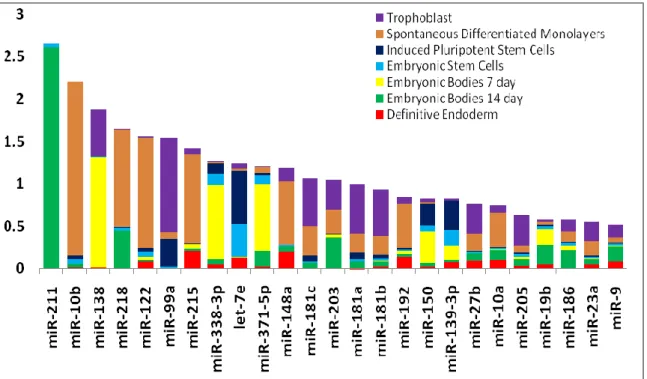
Since hsa-miR- 302 expression only partially decreased throughout these stages of
ES differentiation, its IC in embryonic tissues was low (0.5). This variation might be
due to the fact that we assayed different cell types of embryonic origin, in comparison
to only ES cells. The miRNAs which had highest tissue specificity in embryos were:
211 in 14 day embryoid bodies (EBs), 10b, 218,
hsa-miR-122, and hsa-miR-148a in spontaneous differentiated monolayers, hsa-miR-138 and
hsa-miR-338-3p in 7 day EBs, and hsa-miR-99a in trophoblast (Figure 8 and Table
A4).
34
Figure 8 The specificity was calculated by using the information content (IC). The miRNA specificity during ES cell differentiation.
35
3.3 T-UCRs tissue specificity in normal and embryonic samples
We used the same approach for check the expression of the T-UCRs. We tested the
expression in 374 samples from 46 types of normal tissue derived from 16
histological groups. Tissue specificity was calculated using the information content
(IC) as described previously in 3.1.2 Material and Methods section. For this profile we
used data obtained with the OSUMC microarray platform, where there were 974
different probes for putative T-UCRs in both genomic strands (sense, designated
‘plus’ and antisense, designated ‘minus’).
First, a wide analysis of expression showed that only a portion among the tested
UCRs (224 out of 974) was expressed in human tissues (p-value < 0.05). Of these:
48% were non-exonic, 26% possibly exonic and 26% exonic, thus reflecting
previously published studies. Fifty-seven T-UCRs were bi-directionally transcribed
(57 on 224) and their frequencies were: 37% non-exonic, 23% possibly exonic, and
40% exonic (Table A5).
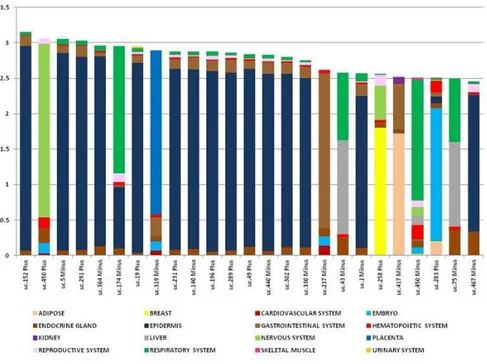
The most tissue specific T-UCRs were represented by a group of 13 T-UCRs,
exclusively expressed in epidermis, with an IC value ranging from 3.23 to 1.70,
composed of 67% non-exonic, 19% possibly exonic, and 14% exonic sequences
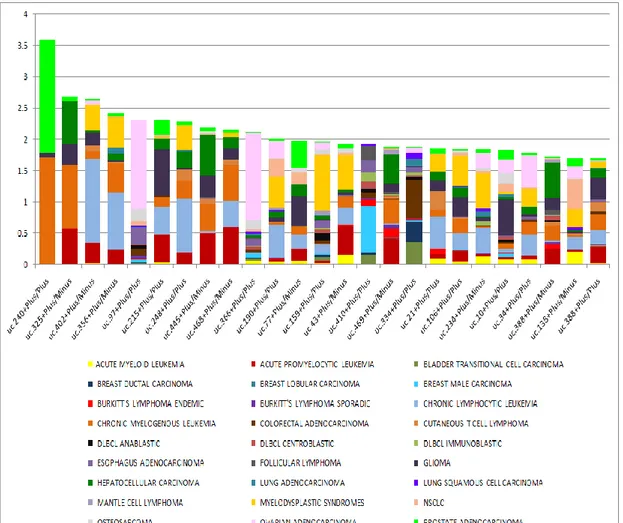
(Figure 9 and Table A6 ).
36
Figure 9. T-UCR specificity in 46 normal tissues grouped by 16 systems. The tissue specificity was calculated by using the information content (IC), value expressed on y-axis; different colors represents different systems.