Università degli Studi di Urbino “Carlo Bo”
Dipartimento di Scienze Biomolecolari (DISB)
Corso di Dottorato di ricerca in Scienze della Vita, Salute e Biotecnologie Sezione Scienze Motorie e della Salute XXXI ciclo
Detection of physical efficiency and
performance of footballers by using
GPS
and K4
Relatore
Chiar.mo Prof. Riccardo Izzo
Dottorando
Ciro Hosseini Varde’i
Co-Relatore
Mirko Marcolini
1
Index
Abstract ... 2
Introduction ... 3
1 Performance Analysis in Football ... 5
1.1 Player Performance Model ... 9
1.2 The performance of the footballers ... 12
1.3 The internal effort and physiology of football ... 13
1.4 The external effort ... 16
2 State of Art ... 21
2.1 Global position system ... 22
2.2 Video tracking system ... 24
2.2.1 Comparing GPS and Video Tracking System ... 27
2.3 Breathing Analysis and Metabolimeter ... 28
2.4 Metabolic Power ... 33
2.4.1 Theoretical Model ... 35
2.5 Limit of Metabolic Power Model ... 38
3 Research Projects ... 44
3.1 Means and Methods ... 44
3.1.1 K-Sport GPS ... 44
3.1.2 Cosmed K4 b2 ... 45
3.2 Metabolic Power Comparison Research Project ... 46
3.2.1 Data Analysis ... 50
3.2.2 Discussion ... 61
3.3 Armenian Premier League Match Performance Analysis Research Project ... 64
3.3.1 Data Analysis ... 65
3.3.2 Discussion ... 69
4 Conclusion ... 71
Acknowledgments ... 75
2
Abstract
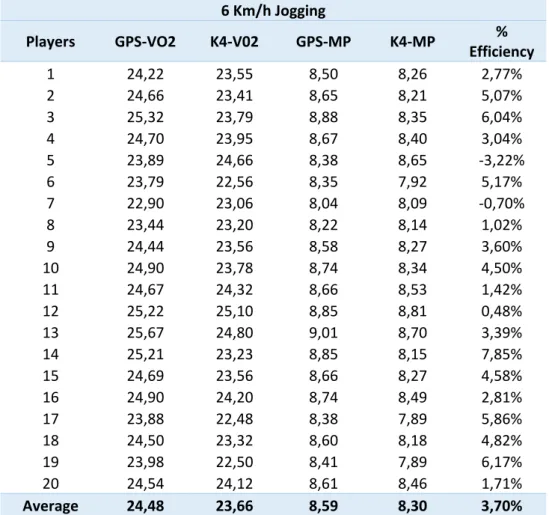
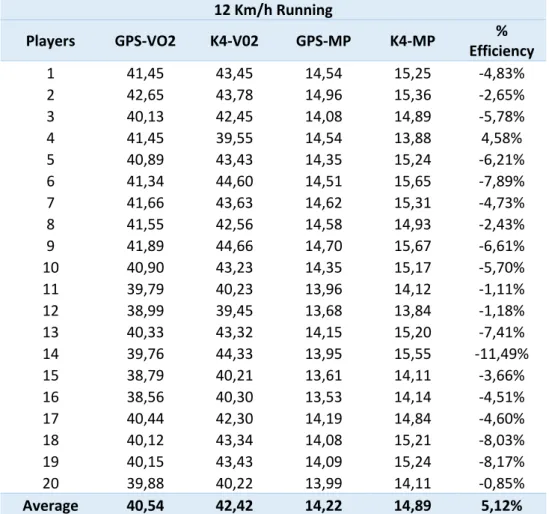
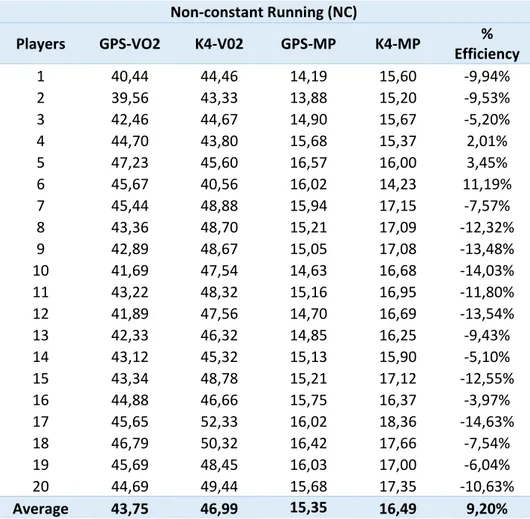
The aim of this Ph.D. thesis is to analyze and compare the player performance model (PPM) of footballers. The thesis tries to analyze the PPM through two different studies. The first part of the project wants to analyze the internal effort of footballers comparing the metabolic power (MP) approach of Osgnach and Di Prampero derived from the external load with use of GPS or video tracking system, with the real metabolic effort gained with a portable metabolimeter. Two different protocols were used. First protocol was performed on 20 amateur footballers from 7Th Italian League (Age: 27,3 ± 3,3, eight: 1,77 ± 3,4 and weight: 80 ± 4,5). Subjects were running 10 minutes with two different velocities 8 Km/h and at 16 Km/h (5 minutes for both) and performing a 5 minutes pause between the two. The type of running was circular asking players to maintain the velocity without performing changes of speed or direction, during the test the players were analyzed with the use of 50Hz GPS (K-Sport Universal, Italia) and a portable metabolimeter Cosmed K4 b2. The second protocol was performed on 20 semi-professional football players (Age: 26,3 ± 3,6, eight: 1,78 ± 4,5 and weight 77 ± 4,3) from a football team of 4Th Italian Championship league. Change the sample was important in order to investigate the possible differences that can be recorded between amateur and semi-professional athletes. The test protocol it was composed in 6 parts (18 minutes) including 2 recovery periods, one at the beginning of the test in order to evaluate the individual basal metabolism and one at the end of the test to determinate the recovery time. The second part of the Ph.D. project was to analyze the PPM of Armenian Premier League during matches using 25 GPS 10 Hz (K-Sport, Montelabbate, Italy), in order to compare data obtained with literature from major European championship. In total were analyzed 25 matches (10 wins, 10 Loses and 5 draws), 33 different players (age 24,3 ± 4,2, eight 1,76 ± 4,2 and weight 74 ± 3,5) and in 270 performances (10,8 for matches).
3
Introduction
The Performance Analysis nowadays as become crucial in sport, every day we are surrounded by a big amount of data, from T.V broadcasting, newspapers, web pages, and specific apps. We are living in an era of data; the new technologies have entered strongly in the world of sport, trying to measure at first, sport events such as matches, races, championships, and tournament, for individual or team sports. Everything was starting with live handmade notification analysis made by coaching staff during an event in the middle of 90’s, with the progress of technology was possible at first to use photos and after videos, in order to execute a more accurate post-analysis. Nowadays is possible with the use of some specific software and hardware analyses events in live, and build one instant report useful to give specific information to coaches. This monitoring is used for tactical, technical, fitness, biomechanical and even psychological performance analysis, clearly every sports has built one, sport specific analysis in order to detect only data that are more important and to avoid the useless amount of numbers. The same analysis can be operated during training in order to compare individual or team performance with competitions events. It seems useful to point out that, in sports specific field and in the dedicated literature, do not exist one universal analysis method that is scientifically recognized as the golden standard of performance monitoring. In addition, even that the evaluation, measurement, control, and creation of corrective parameters according to increase performance cannot be unique. Notwithstanding the great difficulty, complexity, and diversity of the casuistry of gambling, of the psycho-attitudinal problems specific and general sports of individuals as such and as an integral part of a group or team, it is clear that hypothesizing a unique and valid winning method for everyone is not that simple. All this is linked to the great difficulty of controlling the too many different variables that can come into play, in the complex physical psychic
4 evaluation of a single athlete or a team; it is therefore assumed that creating a unique and winning method for everyone is a utopia.
However, which is the final goal of Performance analysis?
Although is not universally recognized one performative method in sport training, no doubts that we can define that the main objective of Performance Analysis is to establish key performance indicators (KPI) that will be useful as parameters aimed at optimizing performance where lacking. The challenge that the coaches will have to face, therefore, will be to determine with scientific clarity specific critical factors that can be improved in absolute, defined strategic variables, which are identifiable as successful or unsuccessful. In order to build one individual guide that has to be different players by players, team by team, championship by the championship, in this way will be possible to achieve higher improvements.
5
1 - Performance Analysis in Football
Nowadays the knowledge of the specific performance model has placed at baseline o the training protocol. Coaches, fitness trainer and sports scientist, have to analyses, study and after organizing the new researches, in order to plan the training program in the more specific way. Is important to define that the player’s performance model (PPM), is always updated, and that is not the same for every countries, championships, and tournaments. One easy example is that if you are one Jamaican speedrunners, in order to participate at the Olympic Games, your PPM have to follow and be near the national records and not the average of all of the others countries. In order to organize and plan a work plan properly, it is necessary to know the real demands imposed by the competitions of the sport in question and the real skills and qualities of the athlete (D'Ottavio, Tranquilli, 1992)1. Therefore the knowledge of the stresses imposed by the
competition and the potential quality of the athletes is of extreme importance for the definition of a project useful for the correct administration of specific workloads. The evolution of technology applied to sport and the use of a statistical analytical system for the study of competitions and training has started to create new reference figures, that is, the Match Analyst. Is possible to define the match analysis as the method of data collection that, through the scientific and statistical investigation, allows to evaluate objectively, the physical and technical-tactical performance of the single athlete and the whole team2; also
according to Sacripanti (2007), the match analysis can represent the keystone that, on the basis of new technologies, can provide the winning card in the hands of the coach and his team.
1 D’Ottavio S., Tranquilli C., “ La prestazione del giocatore di calcio”, sds- Scuola dello Sport 1992
Gennaio- Marzo, n.24.
2 Sacripanti, “La match analisi: fondamenti scientifici e metodologici”, SdS/Rivista di cultura sportiva
6 It therefore useful to establish objectively what happens during matches, allowing coaches to optimize the training process3, especially considering that
the best international trainer has a capacity to recall at most 30% of the key factors that determine the success during a single live game4.
In particular, the match Analyst, also known as a tactical analyst, is a professional with tactical and computer skills that allow him to work with specific computer software for the study of a game; he can be part of the technical staff of a football club and have direct contact with the team or he can be an external collaborator, in support of the technical staff.
The match analysis is therefore crucial especially in the open skill disciplines, such as football and basketball, where the performance does not take place in a simplified and cyclical disciplines but is influenced by several variables due to the presence of the opponents; the succession of events leads to situations that are always different and difficult to assess with the naked eye.
Data collection statistics are used (SCOUTING) in order to break down matches into its most frequent components; this helps the coaches to detect particular events and thus improves the communication between the competition field and the technical staff5 (Izzo, 2014). The analysis process is not free from practical
and technical problems, the main one's concern:
1. Use of complex equipment that involves transport difficulties,
2. The use of these systems provides an exclusively athletic analysis, so the tactical interpretation of the various movements is very subjective,
3. The psychological component of the player is not evaluated,
3 Bangsbo J., M. Mohr, P. Krustrup, “Physical and metabolic demands of training and match--‐play in
the élite football player. J Sport Sci, Jul 2006;24(7), 665--74,
4 Franks, I.M. e Miller. G., “Eyewitness testimony in sport“. Jopurnal of Sport Behavior, 1986, 9, 39-45 5 R. Izzo, “Analisi della Performance sportiva: prima parte”, Urbino, 2014
7 4. The high cost of the instrumentation, therefore limited availability only to clubs of from the highest series.
The functions of match analysis can be divided into three main general directions:
a) Main functions referred to Performance:
- Qualitative and quantitative description of events, typical or probable courses of invariant action: competition determinants;
- Identification of the phases and critical actions of the competition;
- Scientific knowledge and evolution of the race-competition system;
- Definition of winning profiles (individual and/or team) and prediction of the optimal outcome: modeling;
- Identification of opposing profiles.
b) Main functions referred to Coach:
- Verify or not the subjective perceptions of the coaches;
- Calculation of individual and team efficiency indices;
- Creation of databases and archives;
- Identification of development objectives for training optimization.
c) Main functions referred to the training model:
- Development of technical strategies and training tactics;
- Individual and team history;
- Physical preparation (estimation of external load) and reconstruction of competition situations during training;
8 - Comparison between expectations and the reality of events.
The match analysis allows the coaching staff to analytically partition the objectives of the workouts in three different levels6:
First level training; It is the organization of repeated physical exercise to produce progressively increasing efforts that stimulate the physiological adaptation processes, improving the athlete's technical and physical abilities and enhancing the match performance (Super Compensation). Second level training; in this phase the "competition invariants" are
identified that characterize the positive performance, studying the technique thanks to the software and the slowed images; therefore aims to the acquisition and improvement of the technical-tactical elements that are reported during matches.
Third level training; It aims to teach local strategies (that is, in certain areas of the field) and global strategies (game modules in all fields).It is obtained from the tracing of the trajectories. The trainer can manage them to improve their strategies, considering important data that would otherwise be lost.
Figure 1; Phases of Training (Izzo, 2014)
All this has allowed an improvement in the programming of the workouts, which have become more rational thanks to a better physiological knowledge
6 Ivi
1° Level
• Supercompensation • Improvement of physiological processes2° Level
• Competition invariants • Tactical specialization based on the role3° Level
• Global and local strategies • Crucial tactical
9 of the efforts that take place during matches. Workloads are customized based on role, characteristics, and needs. Even the athletic training has benefited, the planned setting now provides an accurate periodization that allows the achievement of certain objectives in the different periods of the year: now they are mainly programmed specific microcycles with precise weekly work, while in the past it tended to organize only megacycles or macrocycles with little consideration of the actual athletic conditions of the players.
1.1 Player Performance Model
The Player Performance Model (PPM) of footballers is composed of numerous components that work together to create sports performance. A sports performance model tends to organize in the simplest and most schematic way all the aspects and elements that together create the performance, in this way it will be easy to assess the level of a single player or an entire team by relating it to reference data obtained through statistical surveys and analyzes. The model describes individual elements that lead to forming a totality that obviously cannot be considered a simple sum of the components7. Every modification
action towards one or more elements influences all the others, both positively and negatively. It should be noted that the sports performance model is constantly evolving, in particular, that of team sports and in this case even in football.
The model is, therefore, a set of complex interactions between its various components but at the same time, it must be dynamic and adaptable to the various situations and contexts that can be created.
7 Bangsbo J. “The physiology of soccer—with special reference to intense intermittent exercise.” Acta
10 Football is characterized by an alternating aerobic-anaerobic metabolic commitment with load at the level of muscular engagement that varies between phases of high commitment of short duration and less intense phases. The physical performance is given by the sum of different components that is possible to describe with a very simple formula8.
Performance = Fitness Status - Fatigue State
The state of Fitness is the set of numerous conditional skills and their subgroups of which important for football we remember: Strength (Functional Strength, Explosive Strength, Strength Resistance, and Speed), Resistance (Aerobics, Anaerobic, and Pcr) and Agility.
The state of fatigue refers to the Doms, Over-reaching, Over-training, Tampering, and de-training. The performance of a player, however, is not only conditioned by conditional factors but also by technical, tactical and mental aspects.
Figure 2; Graphical description of PPM
11 Through numerous studies and surveys, it was possible to determine the performance model of the elite professional football player.
The average anthropometric characteristics of the player are the following9: Height (cm): 184 ± 6
Weight (Kg): 80 ± 5 BMI (Kg / m2): 23.7 ± 1.0 Fat (%): 13 ± 3
The average distance traveled per game is about 11 Km, it is obviously influenced by the different roles, the game module, and the tactical settings. Usually, the players who travel more kilometers are the midfielders to follow the attackers and last by the defenders. During a match, a player makes about 1100 changes of activity, for example, from the path to the low-intensity sprint race. It is important to point out that the distance traveled with the ball is about 2% of the total distance.
1.2 The performance of the footballers
In the physiological field, football has always been identified as a high-intensity intermittent sport. Using a classification based on the prevailing or exclusive energy mechanisms involved in the performance model, Dal Monte (1983) places it among the "alternating aerobic-anaerobic" activities, characterized by the alternation of aerobic and anaerobic phases10. Bangsbo (2006) states that the aerobic energy production system provides the largest amount of energy used during a meeting, taking into account that a top player maintains an intensity equal to 70% of the maximum oxygen consumption, makes 150-200 actions to high intensity and undergoes depletion ranging from 40 to 90% of muscle
9 Giulio S.Roi, “I test di valutazione funzionale nel calcio”, Edizioni Correre, 2014;
12 glycogen stores during a game11. Both authors then agree that in the
determinism of performance, the tactical, technical, coordinative and psychological elements prevail over the energetic ones. The type of work that the player performs is largely made up of short or very short efforts, carried out maximally and repeatedly, alternating with recovery phases that are generally longer. Always Bangsbo (2006) has found that during a match the players make about 1300 variations in the intensity of exercise (metabolic changes)12. It has
been shown that by increasing the athlete's level of performance and category, his ability to express activity, running or not, at high intensity will be greater. It has long been accepted in the literature that the contribution of aerobic metabolism has a crucial importance in the performance of players: high levels of anaerobic threshold and aerobic power correlate with the coverage in matches of greater distances and with a greater number of sprints also allowing a faster post-match recovery13 (Ekblom, 1994). During an official 90-minute competition, a player travels a distance between 10 and 13 km, 10-20% of which is high intensity in the form of high-intensity runs or sprints, the remaining quota is traveled at 4/8 km/h (about 25%), light run 8/13(35-40%) and backward run (5%). The overall distance traveled in acceleration and deceleration (> 2.5 m/s2, < - 2-5 m/s2) varies between 800 and 1000 meters, with unit distances
between 5 and 10 meters14. The actions of "tackle", "dribbling", "ball kick",
"jump", "header", even if only partially occupying the time of an entire match, have one important weigh on the athlete's workload. Their impact is being quantified in terms of "metabolic load" through algorithms that weigh, data
11 J.Bangsbo, “Preparazione fisico-atletica del calciatore; allenamento aerobico e anaerobico nel
calcio”, Calzetti- Mariucci Ed., Torgiano, 2006, p.11.
12 Ivi, p.9.
13 B. Ekblom, “Applie physiology of soccer”, Sports Medicine 3, 1994, p. 50-60.
14 J.Bangsbo, M. Mohr, P. Krustrup, “Physical and metabolic demands of training and match play in
13 obtained with GPS or Video Tracking monitoring during training sessions or matches15.
Another important aspect is that linked to the distance traveled to the various game intensities we take as examples the data obtained from some recent studies on elite players16:
• ± 3700m Way (0.2 to 7.2 km/h)
• ± 4400m Low-intensity race (7.3 to 14.4 km/h)
• ± 1800m Run at moderate intensity (14.5 to 19.8 km/h) • ± 750m High-intensity race (19.9 to 25.2 km/h)
• ± 270m Sprint (> 25.2 km/h)
During game footballers make a sprint every 90 seconds approximately, each of the average duration of 2-4 seconds and that corresponds to 0.5-3% of the total game time. They are in 96% of the cases shorter than 30m and 50% shorter than 10 m17. The external effort of footballers will be better investigated in the following chapters.
1.3 The internal effort and physiology of football
In evaluating the energy cost and the metabolic load of football, this task is made difficult by the particularity of the athletic gesture and its heterogeneity due to the different individual requests derived from the role and the variability induced by the tactical component of the game. Starting from the second half of the 80s, heart rate was used as a performance parameter, it was observed that
15 M. Sanders, I. Mujika, A. Hewitt, J. Santisteban, R. Bishoff, R. Solano, A. Zubillaga, E. Peltola, P.
Krustrup, M. Mohr, “ Applications of four different football match analysis: a comparative study”, Journal of sport sciences, 2010, p.171-182.
16 Franco M. Impelizzieri, Ermanno Rampinini, & Samuele M. Marcora, Physiological assessment of
aerobic training in soccer, Journal of Sports Sciences, June 2005; 23(6): 583 – 592
17 Whebe, G. M., Hartwig, T. B., and Duncan, C. S.,“Movement Analysis of Australian National League
Soccer Players Using Global Positioning System Technology.” J. Strength Cond. Res. 28 (3): 834-42, 2014.
14 during the 90 minutes it was fairly stable around 80-98% of the f.c. maximum (obtained in the during of a sub-maximal exhaustion test)18. The data obtained,
considering the relationship between the trend of the heart rate and the consumption of oxygen, have led to the conclusion that the aerobic commitment of football is still high, even if, as considered by Bangsbo (2006), during a match there are factors such as mental stress, dehydration, and hyperthermia which cause the stop of linear relationship between heart rate and oxygen consumption19.
Considering these factors, it is likely that the aerobic metabolic task during a football match is around 70-80% of the VO2max20. These parameters may seem
high if compared to the fact that for about half the match, the player walks or run in jogging, or the parameters of average distance/average speed reached (11Km/ 7.2 Km/ h). In reality, these parameters only partially reflect the footballer's activity profile, including as mentioned also high-intensity performance phases. The contribution of the anaerobic alactacid mechanisms (Pcr) in this performance model is considered essential and prevalent21 (Raven
et al, 1976).
However, lactacidemia can vary considerably during match events, with phases whit very high levels of lactate can be found. This and other observations, such as the depletion of muscle glycogen stores from 40 to 90% found at the end of games (Bangsbo et al 2007), show how the glycolytic mechanism of energy production is actually involved22. However, the average lactate value detected during competition is not very high (6.6mmol/l during the first half, 4 mmol/l
18 B. Ekblom, “Applie physiology of soccer”, Sports Medicine 3, 1994, p. 50-60.
19 J.Bangsbo, M. Mohr, P. Krustrup, “Physical and metabolic demands of training and match play in
the élite football player”, Journal of sport sciences, 2006, p.665-674.
20 T. Stolen, K. Chamari, C. Castagna, U. Wisloff, “Physiology of soccer: an update”, Sports Medicine,
2005, p.501-536.
21 PB. Raven, LR. Gettman, ML. Pollock, KH. Cooper, “A physiological evaluation of professional
soccer players”, British Journal of Sports Medicine, 1976, p. 209-215.
22 J.Bangsbo, M. Mohr, P. Krustrup, “Physical and metabolic demands of training and match play in
15 during the second half, Bangsbo, 2006), footballers performance seem not be involved with situations of high muscle acidosis23. In the final analysis, as
regards the contribution of aerobic metabolism in the game of football, it is worth considering that while in the first measurements of many decades ago, football athletes often showed parameters of aerobic potency superimposable to healthy homogeneous sedentary populations by age, today's values, parallel to the athletic evolution of the game of football in the last decades, are lower than what can be observed in resistance athletes, such as cross-country skiers, but with a decidedly different gap24. As is reported in the literature, elite footballers
show in average a VO2max values between 55 and 65 ml/kg/m, with individual records of 70-75 ml/kg/m25. These are relatively modest parameters (lower than
at least 10 ml/kg/m) if compared to those found in endurance athletes such as runners, cyclists, cross-country, and skiers, also because football, unlike this type of discipline, does not train aerobic metabolism in such a specific and exclusive way26. Some authors argue that there are differences, albeit not
significant, in terms of O2 consumption in relation to the position in the field27.
As in endurance sports, even in football, the anaerobic threshold is considered the best indicator of aerobic performance compared to VO2max28. In fact, it is
known that specific training is able to produce an increase in the anaerobic threshold even without a corresponding increase in VO2max29. Players with the
high anaerobic threshold are able to cover, compared to athletes with similar
23 Ibid.
24 AM. Edwards, N. Clark, AM. Macfadyen, “Lactate and ventilatory thresholds reflect the training
status of professional soccer players where maximum aerobic power is unchanged”, Journal of Sports Medicine, 2003, p. 23-29
25 Ibid.
26 B. Saltin, PO. Astrand, “Maximal oxigen consumption in atlete”, Journal of Applied Physiology,
1967, p. 353-358.
27 PB. Raven, LR. Gettman, ML. Pollock, KH. Cooper, “A physiological evaluation of professional
soccer players”,
British Journal of Sports Medicine, 1976, p. 209-215.
28 AM. Edwards, N. Clark, AM. Macfadyen, “Lactate and ventilatory thresholds reflect the training
status of professional soccer players where maximum aerobic power is unchanged”, Journal of Sports Medicine, 2003, p. 23-29.
16 values of VO2max, but with a lower anaerobic threshold, longer distances and perform higher intensity events, before reaching the lactacid anaerobic phase (lactate> 4 mM/l)30.
1.4 The External load
“In modern soccer training control and regulation is regarded as a relevant methodological procedure to optimize training adaptations to maximize match performance”31 (Stølen et al, 2005).
Players progress is the result of the interplay of external and internal loads imposed on players during training sessions. Physiological adaptations are mediated by internal load functional variation, that is influenced by external load effort effectuated during training32. The recent exponential advancement
of match analysis systems such as multi-camera video tracking and Global Position System Technology (GPS) has enabled the evaluation of player’s external load during specific training and matches in elite and sub-elite soccer. Beside the replicability and accuracy of match analysis hardware have vital importance, such as the validity and reliability of the variables used to describe player’ activities33. External training load is usually assessed evaluating
distances and time performed in arbitrary selected speed categories.
30AM. Edwards, N. Clark, AM. Macfadyen, “Lactate and ventilatory thresholds reflect the training status of professional soccer players where maximum aerobic power is unchanged”, Journal of
Sports Medicine, 2003, p. 23-29
31 Stølen T, Chamari K, Castagna C, Wisløff U. Physiology of Soccer: An Update. Sports Med.
2005;35:501-536.
32 Manzi V, Impellizzeri F, Castagna C. “Aerobic fitness ecological validity in elite soccer players: a
metabolic power approach.” Journal of strength and conditioning research / National Strength & Conditioning Association. 2014;28:914-919.
33 Castagna, C., Varley, M., Póvoas, S.C., and D’Ottavio S. 2016. “The Evaluation of the Match External
Load in Soccer: Methods Comparison.” International journal of sports physiology and performance September 2016.
17 “Despite the interest in information obtained through the speed method, if acceleration is not considered the actual nature of soccer-specific training results underestimated.”34
In 2010 (Osgnach et al) proposed a new metabolic approach (MP) in order to provide an instantaneous picture of soccer-specific activities35. This method
considers acceleration and speed to profile individual distances and time spent by players at arbitrary chosen estimated power thresholds. While the MP approach may provide a more detailed tracking of player’ game activity, there is limited research regarding the validity of this method36 (Buchheit et al, 2015).
Thus, information regarding the objective difference and or association of the MP approach over the speed threshold method is unknown37. This information has huge practical implications, a growing number of football match analysts are reporting and studying players activity with the MP variables in the attempt to characterize matches and training external-load.
Different studies were trying to investigate the real external effort of professional footballers, not every study was using the same parameters, in this case, the following data are from papers that using the same thresholds38-39.
The following parameters were taken in consideration:
Total Distance (meters, D);
Distance per minutes (meters/minutes, Drel);
Distance covered at High-Intensity (speed ≥ than 16 km/h, HI);
34 Ibid.
35 Osgnach C, Poser S, Bernardini R, Rinaldo R, di Prampero PE. “Energy cost and metabolic power in
elite soccer: a new match analysis approach.” Med Sci Sports Exerc. 2010;42:170-178.
36 Buchheit M., Manouvrier C., Cassiram J. and Benoit Morin J., “Monitoring Locomotor Load in Soccer:
Is Metabolic Power, Powerful?” International Journal of Sports Medicine, September 2015
37 Castagna, C., Varley, M., Póvoas, S.C., and D’Ottavio S. 2016. “The Evaluation of the Match External
Load in Soccer: Methods Comparison.” International journal of sports physiology and performance September 2016.
38 Ibid.
39 Osgnach C, Poser S, Bernardini R, Rinaldo R, di Prampero PE. “Energy cost and metabolic power in
18 Distance covered at High-Intensity Running (speed ≥18.97 to ≤21.99
km/h, HIR);
Distance covered at Very High-Intensity Running (speed>21.99 km/h, VHIR);
Distance covered at High-Metabolic Intensity (MP≥20 watt·kg-1, MPHI);
Distance at Medium Acceleration > 2 m/s2 (meters, Acc); Distance at Medium Deceleration < 3 m/s2 (meters, Dec); Distance at Very High Acceleration > 3 m/s2 (meters, HIAcc); Distance at Very High Deceleration < 3 m/s2 (meters, HIDec); Average Metabolic Power (W/kg, AMP).
Following tables contains data from studies made in professional leagues, table 1 is from Castagna et al (2016), match physical-performance was evaluated in professional top-class players competing during 20 European first-division championships matches (Liga BBVA, Premier League and Bundesliga 1), table 2 shows data from Osgnach et al (2010), that analyzed 56 matches from Italian Serie A. Both studies were carried out using video tracking analysis.
Table 1; Physical performance data from European Championships (Castagna et al, 2016)
Table 2; Physical performance data from Italian Championship (Osgnach et al, 2010).
D Drel AMP HI HIR VHIR MPHI Acc Dec HIAcc HIDec
Average 10672 116 10.6 1778 482 239 2759 636 612 215 209
SD 347 ---- 0.4 208 67 48 241 118 97 56 48
Min 9417 102 9.1 1156 298 127 2028 397 437 106 120 Max 11595 126 12.0 2310 656 335 3344 911 890 370 380
D Drel AMP HI HIR VHIR MPHI Acc Dec HIAcc HIDec
Average 10950 119 10.7 1996 546 531 2839 591 599 180 188
19 Footballer travels about 10 km per game, traveled with a range from 9 to 14 km/h, with 1330 change of status, more or less 220 of them carried out at high speed, with variations between first and second half (second half, higher distance traveled at low speed and less sprint)40. Considering that in 98% of the
time the players are not in possession of the ball, it becomes fundamental to understand when is the best time accelerate and which instead, and which to decrease their energy expenditure41. With regard to the various roles, the Central
Defenders (CD) are the players who travel less total distance (10.554 Km), less sprint (1.8% of the D), less distance at high intensity > 14 Km/h (2.1% of D) but performing more accelerations and decelerations42. The central midfielders
(CM) are those who travel the most distance (11,401 km), following several studies43. The external midfielders (EM) and the full-back (FB) reach the
greatest number of accelerations and sprints compared to other positions44, even
if others researches suggest that forward (FO) have this record (2.6% of sprint compared to D), FO records reach even the highest values in peak velocity45.
Even if with small differences between the various studies, however, they all say that for each specific role there is a precise physiological demand, coaches must train the different characteristics in a personalized way for each position46.
The differences in the speed peaks are constant but still modest47.
40 Rampinini, E., Coutts, A., Castagna, C., Sassi, R., & Impellizzeri, F., “Variation in top level soccer match
performance.” International Journal of Sports Medicine, 2007, 28(12), 1018–1024.
41 Reilly T, Thomas V. “Motion Analysis of Work-Rate in Different Positional Roles in Professional
Football Match-Play.” J Hum Movement Stud, 1976; 2, 87-97
42 J. Mallo, E. Mena, F: Nevado, V. Paredes, “Physical Demands of Top-Class Soccer Friendly Matches
in Relation to a Playing Position Using Global Positioning System Technology.” Journal of Human Kinetics, 2015, 47, 179-188
43 Vigne, G., Gaudino, C., Rogowski, I., Alloatti, G., & Hautier, C. “Activity profile in Elite Italian Soccer
Team.” International Journal of Sports Medicine,2010, 31(5), 304–310.
44 Ibid.
45 A. Ferro, J. Villacieros, P. Floria, J.L. Graupera, “Analysis of Speed Performance In Soccer by a Playing
Position and a Sports Level Using a Laser System” Journal of Human Kinetics, 2014, section 3, 143-153
46 Ibid. 47 Ibid.
20 Weight (Kg) Height (m) D (Km) D > 24 (Km/h) D > 21-24 Km/h) VMAX (Km/h) CD 77,70 1,81 10.556 1,8 % 2,1 % 27,7 FB 71,38 1,76 10.712 2,4 % 2,4 % 29,2 CM 71,05 1,75 11.401 2,2 % 2,7 % 26,2 EM 71,05 1,75 11.140 2,3 % 2,6 % 29,3 FO 71,71 1,79 10.759 2,6 % 2,7 % 29,3
Table 3; Anthropometrical and Physical data from different roles (Ferro et al, 2014). To try to have the most global and prospective vision possible, is possible to analyze, the variations of parameters using different tactic modules: each module provides a different physiological request.
Among the most relevant results is possible to note that:
- 3-5-2 is the most expensive module as regards D, HSR, and MPHI; - 4-2-3-1 is the module that required more acceleration and deceleration
for the entire team;
- FO of 3-5-2 perform more of 45% distance in HSR than 4-2-3-1;
- In 3-3 FO perform more of 50% acceleration and deceleration than 4-2-3-1.
Observing these data, we understand once again how the physiological demands of the players must be trained in a personalized way, taking into account the different variables (role, age, physical structure, etc.).
21
2 State of Art
The sports performance of footballers during games and training has been the subject of research for years. Nowadays there is an increasing number of football analyst that organize the variables detected with different and various methods.
Reilly and Thomas (1976) who described a football competition counting the number of steps taken for each movement performed by the players (walking, running and shooting) took one of the pioneering studies48. From that starting
point, the match analysis has undergone significant changes, through the notational analysis (notational analysis, which can be manual or computerized), motion analysis (which analyzes the activity and movements of athletes) and video analysis (it is practically realized with the installation of automated systems inside the stadiums)49. Thanks this new technology during years were
executed some studies, that took into consideration the distances traveled and the movements of the players in the field (Rienzi et al, 2000, Ohashi et al, 2002, Mohr et al, 2003, Figueroa et al., 2004, Rampinini et al., 2007 and Di Salvo et al, 2009).
In 2010 (Osgnach at al.) was proposed a new method to analyze the PPM during matches and training, this was a turning point the evolution of performance analysis. The new method analysis was based on the evaluation of training load using the metabolic power (MP), mediating changes in speed activities and acceleration of the individual athlete. Subsequently numerous studies were performed through GPS technology and semi-automatic video tracking system, trying to evaluate, accelerations, decelerations, changes in speed and relative
48 Reilly T., Thomas V., “A motion analysis of work-rate in different positional roles in professional
football match-play”, J Hum Mov Stud, 2 : 87 – 97, 1976.
22 energy expenditure (D'Urbano et al., 2010, Akenhead et al., 2012, Guadino et al., 2013, Keiner et al., 2014, Black et al., 2015, Dalen et al., 2016).
Subsequently, the state of the art of the individual hardware taken into account in the development of the thesis will be described in detail.
2.1 Global Position System
The Global Position System (GPS) is a system that processes position signals, sent from satellites in orbit, providing position and time to a GPS receiver.
Calculates the position in the 3 axes, x, y, and z is possible to calculate the coordinates thanks to the trilateration process; the hardware is composed by:
- Space segment: consisting of 31 satellites;
- Control segment: composed of several control stations and antennas;
- User segment: it is the GPS receiver; it is based on the spherical positioning method, which consists in measuring the time taken by a radio signal in traveling the satellite-receiver distance (the signal must be received by at least 4 satellites).
The GPS can be used in a static or kinematic to measure the movement of the players and then quantify the level of physical effort. The accuracy of the detection depends on weather conditions, satellite position, and type of receivers and radio propagation effects of the radio signal50. In recent years the sports
world has been interested in GPS to evaluate the physical parameters of athletes; with GPS you can analyze the athlete's actions and movements thanks to satellite triangulation, thus allowing to measure different parameters51.
50 R. Izzo, “Analisi della Performance sportiva: seconda parte” Urbino, 2014
51 R. Izzo, “Analysis of significance of physical parameters in football through GPS detection in a
23 GPS can have different frequencies: 5, 10, 25 and 50 Hz (a higher sampling frequency allows greater measurement validity). Their accuracy is influenced by several variables, but it has been shown that the latest 10 Hz GPS is quite reliable in calculating accelerations, decelerations, and distance covered during the various stages of games in team sports, while those at 5 Hz are less reliable52.
In general, GPS is reliable in assessing the external load of training53, even if
they tend to overestimate the distances during curvilinear changes of direction and underestimate them during the shuttle tests54, so their accuracy decreases in
high-intensity actions and changes of direction55.
The 10 Hz GPS is more reliable than the 15 Hz56, although the 15Hz is more
accurate in evaluating the maximum speed peaks, while the 10 Hz one more accurately detects the total distance (error: <1 %), average speeds and duration times of actions. However, both devices are limited in evaluating speeds exceeding 20 km/h (error: from 0.8 to 19.9%); 1 and 5 Hz GPS is less reliable in measuring total distance (error: <7.2%), speaking speed (error: 10%), and speeds exceeding 20 km/h (error from 17 to 30%)57.
Reliability can also be negatively influenced by sudden changes of direction during the competition, fast speed variations and also by the presence of high
52 Varley MC, FI H, Aughey RJ. “Validity and reliability of GPS for measuring instantaneous velocity
during acceleration, deceleration, and constant motion.” J Sports Sci 2012; 30, 121–127
53 Vickery WM, Dascombe BJ, Baker JD, Higham DG, Spratford WA, Duffield R. “Accuracy and reliability
of GPS devices for measurement of sports-specific movement patterns related to cricket, tennis, and field-based team sports.” J Strength Cond Res, 2014; 28, 1697-1705
54 Rawstorn JC, Maddison R, Ali A, Foskett A, Gant N. “Rapid directional change degrades GPS distance
measurement validity during intermittent intensity running.” PLoS One, 2014; 9, e93693
55 Jennings D, Cormack S, Coutts AJ, Boyd L, Aughey RJ. “The validity and reliability of GPS units for
measuring distance in team sport specific running patterns.” Int J Sports Physiol Perform, 2010; 5, 328-341
56 Johnston RJ, Watsford ML, Kelly SJ, Pine MJ, Spurrs RW. Validity and interunit reliability of 10 Hz and
15 Hz GPS units for assessing athlete movement demands. J Strength Cond Res, 2014; 28, 1649-165
24 walls or with the presence of a roof full coverage, that significantly reduces GPS satellite detection58 (Jeggins, et al., 2011).
Rampini (2015) compared a device at 10 Hz and one at 5 Hz, noting that the 5 Hz has a low error (2.8%) in calculating the total distance and the medium-low thresholds of metabolic power (4.5%) while the error increases with increasing metabolic power (from 7 to 23%); the 10 Hz GPS has a negligible error on the total distance (1.9%), medium-low metabolic power (2.4%) while increasing with the high metabolic powers (4-10%). He concludes that both evaluate the total distance well, but not the parameters concerning the high intensities, moreover the difference in error between the two devices varies between 30 and 50%59.
Type Total Distance Speed Peak Velocity > 20 Km/h MP (>25 W/Kg)
1 e 5 Hz < 7,2 % 10 % 17 – 30 % 7 – 23 %
10 Hz 1-1,9 % 1,6 % 0,8 – 19,9 % 4 – 10 %
15 Hz 2 % < 1% 0,8 – 19,9 % /
Table 4; GPS Error Percentage (Castellano et al., 2011, Johnston et al., 2014, Rampinini et al., 2015)
Is important to notice that all of this data and percentage are straightly influenced from specific hardware to specific hardware, this means that different companies (K-Sport, Catapult. Stats-Sport, Colli, Gpexe etc...) can have different merits and defects, and that the previous studies were carried out not with all products present on market.
2.2 Video Tracking System
The Video analysis is carried out with the installation of cameras devices that allow to filming matches after data are analyzed thanks to specific tracking software. Can be used to study and evaluate the athlete's body movements, the
58 Castellano J., Casamichana D., Calleja-González J., San Román J. and Ostojic S.M. “Reliability and
Accuracy of 10 Hz GPS Devices for Short-Distance Exercise” J Sports Sci Med. 2011 Mar; 10(1): 233– 234.
59 Rampinini E, Alberti G, Fiorenza M, Riggio M, Sassi R, Borges TO, Coutts AJ. Accuracy of GPS Devices
25 team's tactical evolutions and even the external effort, allowing detecting reliable feedback thanks to the fact that the athlete is analyzed in a moment of true expression of the gesture, without the feeling of tension of a test or from wearing one uncomfortable hardware. These video tracking systems are an important tool for identifying players' physical efforts during the various competitions, with a low error rate, which stands at 1.8%60.
A network of cameras placed around the field, which allow a wide and precise shooting over the entire game space, characterizes this technology; movies are uploaded to a computer that is able to identify and track players during the matches, the system can be manual, semi-automatic or completely automatic. Only elite sports clubs can take advantage of this technology because of the very high costs61.
Initially, the video analysis concerned a single athlete, although it happened with high-efficiency standards, could be influenced by possible human errors in the codification and manual interpretation of a certain athletic gesture. To solve this situation, the "Time-Motion Analysis" entered the scenes and, relying on mathematical models for automatic tracking, allows the description of the most important events in the right sequence in real time.
After the succession of various techniques nowadays is possible monitoring multiple players, one example is the software “Amisco Pro", which allows a video measurement of all the subjects moving within the field of play, used for basketball, rugby and basketball.
60 Redwood-Brown A, Cranton W, Sunderland C. Validation of a real-time video analysis system for
soccer. Int J Sports Med. 2012; 33, 635–40
61 Marcolini M.,”La match analisi: un nuovo approccio scientifico”; Urbino, 5° Convegno sul calcio
26 The disadvantage of this technology, in addition to cost, is the need for an operator who organizes the captions and after the collection of the large amounts of data obtained62.
Nowadays, despite the development of other software and the high level of automatic detection, the manufacturing companies cannot give certification of complete reliability, due to ambiguous situations in which the simultaneous presence of multiple players occurs in a small portion of the field, condition that causes confusion both to automatic tracking and to the manual operator.
The video analysis takes place in 4 phases:
1) Observation: this is the phase in which data are detected with static or dynamic cameras, which allow the acquisition of video sequences and thus provide detailed information on individual and collective race behavior;
2) Preparation: the processing of information collected thanks to video recordings (scouting);
3) Application: use of the data processing results to adapt the technical-tactical strategies (delivery of the report);
4) Transformation of the results in parameters to be trained: it is the optimization of the useful work to get more prepared for future matches.
Is possible to predict how video analysis can achieve excellent levels of precision, but coaches need to focus our attention more on data quality (through integration with other technologies) than on quantity, in order to avoid the data mining63.
62 Di Salvo V, Collins A, McNeill B, et al. Validation of Prozone: A new video-based performance analysis
system. Int J Perf Anal Sport 2006 Jun; 6 (1), 108-119
63 J. Castellano, D. P. Alvarez, Paul S. Bradley, “Evaluation of Research Using Computerised Tracking
Systems (Amisco and Prozone) to Analyse Physical Performance in Elite Soccer: A Systematic Review, Sports Med (2014) 44, 701–712
27
2.2.1 Comparing GPS and Video Tracking System
Video tracking systems with multiple cameras tend to overestimate the distance covered at high intensity (> 18 Km/h) compared to GPS64; video analysis also slightly overestimates the distances covered at various speeds, overestimates the peak of maximum speed and the average speed, but calculates better the total distances65, even if we must consider that often the cameras cannot be installed
in optimal locations.
GPS are more accurate in measuring accelerations66, but tend to underestimate
the distances covered (error: 1-3%)67, are more accurate in calculating linear
actions than changes in direction68, underestimate the average speed of about
6% and sprints also tend to decrease in precision with increasing distance69.
Some studies state that GPS is the most efficient technology for recording and managing data70 (Buchheit at al., 2014).
Both systems are reliable in measuring the total distance, the peak of maximum speed and the distances greater than 30 meters, while they tend to drop precision
64 Harley, J. A., Lovell, R. J., Barnes, C. A., Portas, M. D., & Weston, M. The interchangeability of global
positioning system and semiautomated video-based performance data during elite soccer match play. Journal of Strength and Conditioning Research, 2011, 25, 2334–2336.
65 Randers, M., Mujika, I., Hewitt, A., Santisteban, J., Bischoff, R., Solano, R., Mohr, M. Application of
four different football match analysis systems: A comparative study. Journal of Sports Sciences, 2010, 28, 171–182.
66 M. Beato, D. Bartolini, G. Ghia, P. Zamparo, “Accuracy of a 10 Hz GPS Unit in Measuring Shuttle
Velocity Performed at Different Speeds and Distances (5 – 20 M)”, Journal of human Kinetics, 2016, 54, DOI: 10.1515/hukin-2016-0031
67 M. Buchheit, A. Allen, T. Poon, M. Modonutti, W. Gregson & V. Di Salvo, Integrating different tracking
systems in football: multiple camera semi-automatic system, local position measurement and GPS technologies, Journal of Sports Sciences, 2014, Vol. 32, No. 20, 1844–1857
68 Petersen, C., Pyne, D., Portus, M., & Dawson, B. Validity and reliability of GPS units to monitor
cricket-specific movement patterns. International Journal of Sports Physiology and Performance, 2009, 4, 381–393.
69 Vickery, W. M., Dascombe, B. J., Baker, J. D., Higham, D. G., Spratford, W. A., & Duffield, R. Accuracy
and reliability of GPS devices for measurement of sportsspecific movement patterns related to cricket, tennis and field-based team sports. Journal of Strength and Conditioning Research, 2014, 28, 1697– 1705.
70 M. Buchheit, A. Allen, T. Poon, M. Modonutti, W. Gregson & V. Di Salvo, Integrating different tracking
systems in football: multiple camera semi-automatic system, local position measurement and GPS technologies, Journal of Sports Sciences, 2014, Vol. 32, No. 20, 1844–1857
28 with short distances, short sprints and changes of direction (the last parameter is more penalized in GPS)71.
In addition to technical applications we must consider the practicality of use of the two systems, their effective application in official competitions: GPS can be used during matches and trainings, but a large number of players don’t like to wear GPS jacket during official events, a very limiting condition for the purpose of a true contextualization of the data collected.
Video analysis, on the other hand, is applied during official competitions and, besides inhibiting the psychological aspect of an evaluation, has the advantage of providing a lot of data (both athletic and technical-tactical) much greater than GPS, although it can there is the personal interpretation of the operator who performs it. Neither system can, therefore, prevail over the other, as both have shown greater and lesser validity in different situations72.
2.3 Breathing Analysis and Metabolimeter
Metabolimetry is the study of the metabolic status of a subject, through the measurement of gaseous exchanges. It can be performed both in conditions of rest and effort: in the first case it allows us to evaluate the basal calorie consumption of the individual, in the second we show the metabolic response of the same to a determined stimulus. Is possible to find a several numbers of metabolimeters on market, we will focus in special in the analysis of the portable system, Cosmed K4 b2 (Cosmed, Italy), because is the most used in sports ambit and researches73.
71 Ivi.
72 Ballesta Castells, C.; García Romero, J.; Fernández García, J.C. y Alvero Cruz, J.R, Current methods of
Soccer Match Analysis, Revista Internacional de Medicina y Ciencias de la Actividad Física y el Deporte, 2015, vol. 15 (60) pp. 785-803
73 Naughton L.R., Sherman R., Roberts S., Bentley D.J. “Portable gas analyser Cosmed K4b2 compared
29 The metabolimeter, measure gaseous exchanges, that are: Ventilation (VE) in liter of air/minute, respiration rate, Consumption of O2 (V'O2, difference between concentration of O2 exhaled, with ambient air: range 21- 15%), CO2 production (V'CO2, as above: range 0-5%).
These parameters and those derived from them, together with the relief of the heart rate response, allow the accurate study of metabolic status during any type of stimulation or test. In particular, during a maximal incremental test, it is possible to evaluate the aerobic component, the "equilibrium" phase, and the anaerobic component. The result is, therefore, the possibility to define accurately: prevalence or less of the aerobic phase compared to the anaerobic phase; the point of passage (threshold) in terms not only mechanical but from the metabolic status during the anaerobic phase until exhaustion.
Football is an alternate aerobic/anaerobic sport, where maximum sprints are performed, changes in direction, elevation, contrasts, with more or less short recovery phases. The performance consists of the athletic point of view in the ability to repeat many times seems gestures without drops in intensity.
The metabolic study of a maximal incremental effort, although not specific to the functional model of soccer, allows having fundamental information for defining the metabolic "type", identifying the thresholds of the aerobic phase, measuring the maximum aerobic power and the related mechanical parameters, study status during the anaerobic phase until exhaustion.
In fact, it is necessary to consider that, in a sport where determinants are agility, technique, reading of situations, psychological and character conditions, the elite have very different subjects from the point of view of athletic qualities and characteristics, both constitutional and developed. . It is therefore important to know the athletic type of each team member, an essential condition to propose truly personalized stimuli.
30 The cardiopulmonary exercise test, by studying the functional response of the heart-lung pair, ensures a precise, reproducible and objective measurement of the subject's ability to perform physical exercise. The principle, on which the cardiopulmonary exercise test is based, is the indirect calorimetry. Based on the measurement of the expired air volume and the analysis of gaseous composition, in relation to the amount of work performed and to the modifications that the exercise determines to heart rate frequency and arterial pressure, it is possible to follow the trend of the oxidation processes from the resting phase up to the maximal exercise.
Main concept:
• In the face of the same test and of an identical protocol, the metabolic behavior, regardless of the result in mechanical terms, varies according to the individual characteristics, mostly constitutional/genetic;
• It is however necessary that every high-level player, given the current intensity conditions of the matches and of their frequency, reaches a level of aerobic power sufficient to guarantee an optimal recovery, both "in acute" (during the match) that "in post-acute" (in the following hours); to preserve performance and prevent injuries and over-training;
Trying to simplifying, is possible to distinguish an "aerobic" behavior (usually high levels of VO2max, VO2AT, progression curves of VO2-VCO2 with a clear prevalence of the RR phase < 1, short phase after the switch, the modest differential between maximum consumption of O2 and maximum production of CO2). At the opposite extreme, the "anaerobic" behavior, with relatively low-medium values of VO2max and VO2AT, the prevailing phase at RR> 1, the high differential between VO2max and maximum production of CO2. In the middle, a "balanced" behavior, with obviously intermediate characters. Testing a football team, usually, all three types are detected, with a non-absolute correlation with the roles covered in the field.
31 Main parameters evaluated from Metabolimeter are:
- VO2: represents the amount of oxygen taken from the lungs, transported to the tissues and used to work. It is largely determined by hereditary factors, but aerobic training can increase it up to 35%; can be considered as a predictor of a person's ability to practice aerobic exercise74;
- Heart rate: Heart rate means the number of heartbeats (or pulsations) that the heart makes in one minute (bpm). During physical activity, the heart rate rises in relation to the increase in the intensity of activities75;
- VO2max: represents the maximal amount of O2 that the organism can take from the air through the ventilator function, transport through the cardiovascular system and use at the level of the muscles in the unit of time. During the execution of an effort, the consumption of O2 increases linearly with the load up to a limit value defined precisely VO2 maximum. According to the Fick76 equation (VO2 = Gs x FC x d A-V of O2), the VO2 max, therefore, represents the moment in which the cardiac output and the arterio-venous difference have reached the maximum values. In physiological conditions, the difference A-V do O2 is a constant fraction, which has a constant linear increase based on the amount of work performed and is independent of variables such as sex and age. The VO2max is therefore only a function of maximum cardiac output. In practical terms, the VO2max is identified from the moment when, at the peak of the effort, the VO2 settles into a plateau phase despite a further increase in the workload;
- VAM (maximum aerobic velocity): is intended as the running velocity corresponding to the beginning of the plateau phase of the oxygen
74 K. Patton e Thibodeau, ”Anatomia e fisiologia”, Elvesier, 2011
75 J. Bangsbo, “Preparazione fisico atletica del calciatore, allenamento aerobico e anaerobico nel
calcio”, Torgiano: Calzetti-Mariucci, 2006
76 Adolf F., "Ueber die Messung dea Blutquantums in den Herzventrikela". Verhandlungen der
Physikalisch-medizinische Gesellschaft zu Würzburg (in German) 1870. 2: XVI–XVII. Retrieved 24 Oct 2017.
32 consumption curve. The VAM is identified at the beginning of the VO2max plateau. The values of VAM are lower than those measured by indirect methods, those of anaerobic threshold have different correlations depending on the tests used, and the sub-maximal thresholds are not detectable indirectly;
- Anaerobic threshold is the maximum level of physical exertion that the body can sustain without accumulating lactate in the blood. It then indicates a level of heart rate and power beyond which the lactate product becomes more than the one disposed of. Below this threshold, the athlete's effort is mainly supported by aerobic exergonic systems and can be sustained for long periods. Above the threshold, on the other hand, anaerobic exergonic systems are activated, whit an accumulation of lactate. Hyperlactatemia is buffered by the bicarbonate system producing non-metabolic CO2 that reverses the VCO2/VO2 ratio (respiratory quotient). The anaerobic threshold (AT) can be determined by evaluating the V-slope, the function described by the VCO2/VO2 ratio. In the first part of the effort, the relationship remains constant; when the production of non-metabolic CO2 begins, the first straight curve undergoes a deviation upwards: the inflection point represents the AT77.
Following data from some studies one VO2max that tray to compare professional with amateur footballers.
VO2 Max
Studies Élite Amateur
Wells et al. (2012) 56,5 ± 2,9 55,7 ± 3,5 Haugen et al. (2015) 62 ± 2 ± 61 Rampini et al. (2009) 58,5 ± 4 56,3 ± 4,5
Yanci et al. (2015) / 54
Table 5; Comparison between Elitè and Amateur football players
33 Studies show that in term of VO2Max, is not possible define big differences between Elite and Amateur football players, this means that is not this parameter that defines quality in the team, sport such as football78.
2.4 Metabolic Power
Early assessments of metabolic demand, which were conducted through measurements of body temperature, demonstrated that the average metabolic load of a soccer player is close to 70% of V˙O2max79. More recently,
assessments of energy expenditure have been performed using continuous HR recording, allowing a detailed analysis of aerobic performance80, but this kind
of approach is not allowed during official matches. In addition, HR recordings do not yield information on high-intensity movements. Likewise, direct measurement of oxygen uptake is not suitable to provide data on high-intensity exercise, and its use during training sessions or competitions is impossible81.
Studies show that the total estimated energy expenditure during a match swing from 1200 to 1500 kcal82.
The studies conducted so far on anaerobic energy expenditure are rather scant; furthermore, the current procedures are not applicable to official matches and are definitely not suitable for continuous recordings. An example of this
78 Rampini, A. Sassi, Repeated-sprint ability in professional and amateur soccer players, Appl. Physiol.
Nutr. Metab.,2009, 34, 1048–1054, doi:10.1139/H09-111
79 Edwards A.M., Clark N.A., “Thermoregulation observations in soccer match-play: professional and
recreational level applications using an intestinal pill system to measure temperature.” Br J Sports Med. 2006;40(2):133–8
80 Esposito F., Impellizzeri F.M., Margonato V., Vanni R., Pizzini G., Veicsteinas A., “Validity of heart
rate as an indicator of aerobic demand during soccer activities in amateur soccer players.” Eur J Appl Physiol. 2004;93(1–2):167–72.
81 Kawakami Y., Nozaki D., Matsuo A. and Fukunaga T., “Reliability of measurement of oxygen uptake
by a portable telemetric system.” Eur J Appl Physiol. 1992;65(5):409–14.
82 Van Gool D., Gerven D., and Boutmans J., “The physiological load imposed in soccer players during
real match-play.” In: Reilly T, Lees A, Davids K, et al.., editors. Science and Football. London (United Kingdom): E & FN Spon; 1988. p. 51–9.
34 approach is the study by Krustrup et al. (2006)83, which measured creatine
phosphate concentration on biopsies taken from muscular tissue of athletes immediately after high-intensity exercise actions during a soccer match. Blood lactate concentration (LA) has also been considered as a marker of anaerobic energy expenditure by several researchers; the results of these studies show that its level during matches ranges from 2 to 10 mM/l84.
The methods described above are sufficiently reliable in estimating the total energy expenditure during a match. However, no method is currently available to measure or estimate instantaneous metabolic load, and this is particularly true in relation to high-intensity actions, which are actually the crucial moments in matches.
During the last few years, an increasing number of studies have been devoted to video analysis of soccer matches and to the subsequent computer-assisted analysis of performance, this leads to a significant progress in the physical assessments of individual players and is currently being used by many high-level professional soccer teams all over Europe. The most update techniques of video match analysis allow close observation of the movements of players, referees, and ball on the soccer pitch throughout the 90 min of the game. Results of these studies were analyzed previously.
However such analyses do not take into account an essential element of soccer, accelerations, decelerations, and changes in running activities. It his a fact, that a massive metabolic load is imposed on players not only during the maximally intensive phases of the match (high running speed) but every time acceleration is elevated, even when speed is low.
83 Krustrup P., Mohr M., Steensberg A., Bencke J., Kj&r M., and Bangsbo J., “Muscle and blood
metabolites during a soccer game: implica- tions for sprint performance.” Med Sci Sports Exerc. 2006;38(6): 1165–74.
35 The scientific literature provides a significant number of studies on the energetics and biomechanics of constant speed running, although the number of studies on accelerated (or decelerated) running is not many, because of the difficulty in using an energy approach in evaluating this exercises.
The few works available on the subject focus exclusively on specific mechanical features of sprinting or consider indirect estimates of its energetics.
In 2010 (Osgnach et al.) propose a new analytic approach to football performance introducing the concept of Metabolic Power85, using a theoretical
model introduce from Di Prampero.
2.4.1 Theoretical Model
The purpose of this section is to describe briefly the approach proposed by di Prampero et al. (2005) in estimating the energy cost (EC) of accelerated and decelerated running.
Di Prampero et al. (2005) have shown that, as a first approximation, accelerated running on a flat terrain is energetically equivalent to uphill running at constant speed86. During sprints, the runner’s body leans forward forming an angle with
the terrain, which is smaller, when the acceleration is greater.
If the terrain is tilted upward to bring the runner’s body vertical (Fig. 1), accelerated running can be considered equivalent to running at a constant speed up an equivalent slope (ES) = tan (90 – α).
In Figure 1 runner’s body is represented by a segment of a straight line: COM, the center of mass; T, terrain; H, horizontal; g, acceleration of gravity; af,
85 Osgnach C., Poser S., Bernardini R., Rinaldo R. and Di prampero P.E, “Energy Cost and Metabolic
Power in Elite Soccer: A New Match Analysis Approach” Medicine and science in sports and exercise · January 2010
86 Di Prampero PE, Fusi S, Sepulcri L, Morin JB, Belli A, Antonutto G. “Sprint running: a new energetic