Affording College with the Help of Asset Building: Preliminary Impact
Estimates from an RCT in Italy
DavideAzzolini AlbertoMartini BarbaraRomano LorisVergolini
1. Introduction
In many developed countries, social disparities in access to tertiary education are still prominent and pervasive. Children of socioeconomically deprived families struggle to obtain high educational degrees because of a mix of financial constraints and low educational expectations of their parents (Goldrick-Rab et al. 2016). Financial aid policy that successfully manages to attenuate disadvantaged families’ financial constraints as well as enhance their educational investments is a promising solution to tackle social inequality in education attainment (Kim et al. 2018).
Individual development accounts based on asset-building mechanisms increasingly seen as a viable policy option to foster families’ long-term development goals (Sherraden 1991, Beverly et al. 2013). Asset-building programs for post-secondary education investments (also known as individual, child or student development accounts) have been implemented in several countries (Loke and Sherraden 2009, Beverly et al. 2013). These programs are thought of having several comparative advantages over the most classical forms of financial aid such as scholarships, grants or tuition waivers (Dynarski and Scott-Clayton 2013). By stimulating stronger and longer-lasting family commitment and financial plans, asset-building programs trigger parents’ expectations and children’s attitudes toward education by making the entire family more confident about the actual sustainability of long-term education plans (Beverly et al. 2013). In contexts such as the US, asset-building programs have also been recognized as a potential strategy to reduce students’ reliance on loans (Assets and Education Initiative 2013).
Despite these arguments, sound evidence about their effectiveness is scarce (Leckie et al. 2010; Cheatham and Elliot 2013; Grinstein-Weiss et al. 2013; Kim et al. 2018). In this paper, we present the results of a randomized controlled trial aimed at assessing effectiveness of an asset-building program (Percorsi) on high-school students’ transition to university.
2 The ACHAB experiment was piloted in the province of Torino (Northwest Italy) between 2014 and 2017 and targeted students attending the last two years of high school and coming from low-income families.1 Eligible applicants, who were randomly assigned to
the treatment group, received a dedicated savings account and had to save between €5 and €50 a month to retain in the program. Deposits were matched at a rate of 2 to 1 for high-school related expenses and at a rate of 4 to 1 for university-related ones.2 The
maximum deposit amounted to € 2,000 and, hence, savings could be supplemented by a maximum grant of € 8,000, so that the total of savings to pay for university could reach €10,000. This sum is above the available estimates of the average costs of completing a standard 3-year Italian university degree (Barone et al. 2014). In addition to the savings matching account, treated families and students could also benefit from financial education classes.
Beyond the direct financial channel, three main features of the program lead us to hypothesize a positive impact of the program on university participation. First, Percorsi stimulates the active involvement of the family in the education investment plan. By saving regular amounts of money for an extended period before university, parents can improve their financial planning, and this in turn could reinforce their university expectations as well as trigger students’ motivation and attitudes towards higher education. Second, in comparison to standard financial aid measures (such as the “Diritto allo Studio” scholarships in Italy), both parents and children are aware of the actual availability of the financial resources needed to sustain the university costs. Third, Percorsi imposes strong withdrawal restrictions, as the matched savings can only be spent for duly documented university-related expenses. A further important element of the experiment was the implementation of multidimensional targeting strategy aimed at including in the study only students who were truly at risk of not enrolling at the university because of financial constraints (Azevedo and Robles 2013).
3. The data
Students were recruited through two massive promotional campaigns carried out at the beginning of school years 2014/2015 and 2015/2016. Three cohorts of students were involved: 13th graders and 12th graders in school year 2014/2015, and 13th graders in
1 Income threshold was set to 25,000 euros of family equivalent annual income (ISEE). 2 The private donor is the Ufficio Pio of Compagnia di San Paolo.
Commentato [DA1]: Sicuramente c’è qcosa di meglio che pero’
al momento non mi viene in mente
Commentato [LV2R1]: Per l’Italia di lavori recenti non me ne
vengono in mente…
Commentato [DA3R1]: Forse gli asvappiani hanno qche
riferimento da suggerire, io francamente non mi ricordo neanche cosa c’è scritto in questo articolo…forse è un meccanismo di rimozione psico…
3 school year 2015/2016. To sign in to the program, applicants had to fill in an application form (hereafter “baseline survey”) and hereby provide a set of information about their socio-demographic characteristics, social origins and past school careers.
The baseline survey was used to exclude from the study those students who were least likely to enrol (“never enrolees”) as well as those students who had a very high probability to enrol at university (“always enrolees”). Out of the total 1,239 valid applicants,3 52 were
dropped as “never-enrolees” because in the application form they reported either they had no intention to enrol in the university or they were undecided because of economic-unrelated reasons. The identification of “always enrolees” was achieved with the following procedure. First, a model of university enrolment was estimated with external data from the Survey on High School Graduates from Trento (Northeast Italy). Second, the obtained coefficients were applied to ACHAB applicants’ characteristics to predict their probability of enrolling in university. Third, the 1,187 applicants were ranked according to their predicted enrolment probability. Fourth, the 770 cases with the smallest predicted probability were retained while the remaining 417 students were dropped.4
300 applicants were randomly assigned to the treatment group and the remaining 470 to the control group. Randomization was implemented within the nine blocks given by the interaction of the three cohorts and the three upper secondary school tracks.5
Post-treatment outcomes were collected via CATI interviews conducted in March (Wave I) and in October (Wave II) in 2016 and 2017 for the three cohorts of students. Wave I collected information about university enrolment and the number of exams passed by the end of the first semester. Wave II collected information on retention and second-year enrolment. In this paper, we analyse Wave I data.
3 101 invalid or incomplete observations were excluded.
4 300 students were the maximum number of students Percorsi could fund; 470 students were used to
guarantee an adequate number of control cases, also taking into account a higher non-response.
5 Upper-secondary education in Italy is divided into three branches: academic (Liceo), technical (Istituto tecnico), or vocational (Istituto professionale). Even if higher education is formally accessible independently of the type of school attended, the latter strongly affects both enrolment and completion rates.
4 Table 1
Balancing test of treatment and control groups
(1) (2) (3) Control Group Mean Treatment Group Mean p-value t-test Female 0.546 0.592 0.224 ISEE 9553.8 9937.6 0.518 Social class
Service and white collars 0.377 0.346 0.398
Self-employed 0.133 0.142 0.749
Working class 0.489 0.512 0.553
Parental education
Up to lower secondary degree 0.396 0.443 0.210
Upper secondary degree 0.464 0.443 0.584
Tertiary degree 0.141 0.114 0.305
Migration background
Native 0.796 0.792 0.900
Mixed parents 0.061 0.042 0.257
Both parents migrants 0.143 0.166 0.397
Household size (>5) 0.108 0.100 0.752
Lower-secondary education final grade
Excellent 0.286 0.215 0.032 Very good 0.255 0.284 0.399 Good 0.321 0.398 0.034 Sufficient 0.138 0.104 0.172 No Remedial exam 0.529 0.536 0.853 No Failure 0.770 0.817 0.138
Aims to enroll in University 0.506 0.502 0.914
N 427 289 716
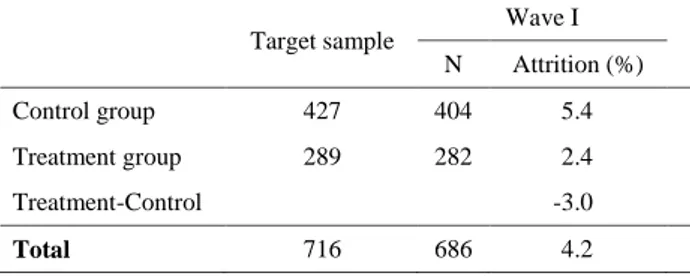
The integrity of the experiment has been tested both through group equivalence tests and attrition analysis. The two groups do not differ significantly on characteristics measured at baseline (see Table 1). As shown in Table 2, attrition rate in Wave I was very low (4.2%) with negligible differences across treatment and control groups (2.4% vs. 5.4%). Overall and differential attrition is always below the thresholds identified as recognized standards in randomized controlled trials (What Works Clearinghouse2014).
5 Table 2
Overall and differential attrition. Target sample Wave I N Attrition (%) Control group 427 404 5.4 Treatment group 289 282 2.4 Treatment-Control -3.0 Total 716 686 4.2 4. Main results
We consider two sequential outcomes related to students’ university transition and initial academic career. The first one is university enrolment. The second outcome is passing of at least one exam during the first semester, which is coded as taking value zero for both those who never took the second year and for those who never enrolled. The unconditional effects of the programme are estimated through an OLS regression:
𝑌𝑖 = 𝛽0+ 𝛽1∙ 𝑍𝑖+ 𝛽𝑗∙ 𝐵𝑖+ 𝛽𝑗∙ 𝑋𝑖+ 𝜀𝑖
Where Y is the outcome of interest, Z is the treatment assignment, B are the blocking variables and X is a set of relevant characteristics (sex, school career and family income) included in order to increase the precision of our estimates.6 Because non-compliance to
treatment assignment turned out to be negligible (only 11 crossovers and zero no-shows), we present intent-to-treat (ITT) effects as they are very similar to average treatment effects.
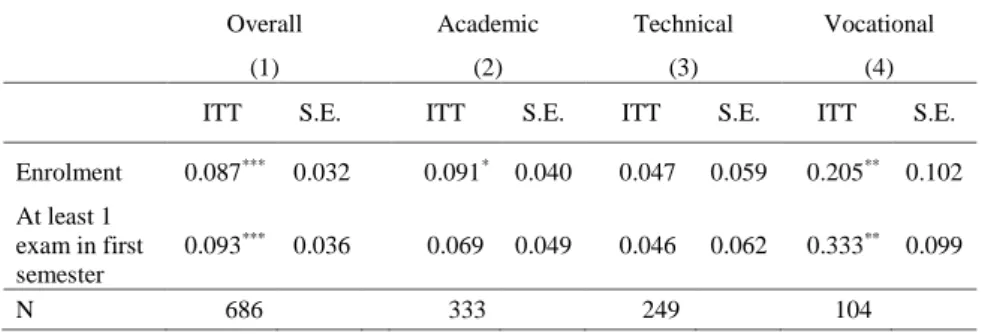
Table 3 (first column) shows the estimates for the two outcomes described above. Concerning university enrolment, control students have a transition rate of 67.1%. In the treatment group, this rate is higher (75.5%). The regression-adjusted difference amounts to 8.7 percentage points. The program shows a positive effect also for what concern the performance at the end of the first semester (+9.3 pp). These effects are quite sizeable and meaningful in substantive terms.
6 Table 3
Regression-adjusted ITT estimates for the effects of the program, overall and by high school track.
Overall Academic Technical Vocational
(1) (2) (3) (4)
ITT S.E. ITT S.E. ITT S.E. ITT S.E.
Enrolment 0.087*** 0.032 0.091* 0.040 0.047 0.059 0.205** 0.102 At least 1 exam in first semester 0.093*** 0.036 0.069 0.049 0.046 0.062 0.333** 0.099 N 686 333 249 104 * p<.1; ** p<.05; *** p<.01.
Table 3 also reports the estimates stratified by high school track. Despite the small sample size, the results show a clearly interpretable pattern. The effects on enrolment for the academic track is quite high (+9.1 pp) but marginally significant; while no significant effect is there for the technical track. The result for vocational track students is strikingly high (+20 pp) and statistically significant. The same patterns are found when looking at the second outcome. In this case, the positive effect for the vocational track exceeds 30 pp, while it disappears for the academic track.
5. Conclusions and discussion
Percorsi succeeded in increasing low-income students’ university enrolment, revealing that there exist indeed financial constrains to family investments in children’s education. The results seem to indicate that the intervention under study has a potential to be streamed into financial aid policy schemes aimed at contrasting social inequality in education.
The findings also suggest the existence of heterogeneity of the effects by school track, indicating that the program may be more successful if targeted to vocational-track students, i.e. those students with the lowest average university transition. Hence, targeting the intervention to this subgroup of students could improve the cost-effectiveness of the intervention, as the ‘deadweight’ (i.e., the share of students that would enrol at the university even in the absence of the monetary benefit) is smaller.
This paper’s main goal was presenting the innovative aspects of the tested intervention, the experimental design, alongside with the first preliminary impact estimates. In the future, data coming from the Wave II could provide more information about the effects on performance and dropout. Second, additional analyses on the
7 heterogeneity of the effects by student characteristics that are relevant predictors of university enrolment and attainment are in order to shed further light on the possible mechanisms that lie behind the impact estimates.
References
Assets and Education Initiative. (2013). Building Expectations, Delivering Results: Asset-Based Financial Aid and the Future of Higher Education. In W. Elliott (Ed.), Biannual report on
the assets and education field. Lawrence, KS: Assets and Education Initiative (AEDI).
Azevedo V., and M. Robles. 2013. Multidimensional targeting: Identifying beneficiaries of conditional cash transfer programs. Social Indicators Research 112 (2): 447–475.
Barone, C., G. M. Abbiati, and D. Azzolini. 2014. Quanto conviene studiare? Le credenze degli studenti su costi, redditività economica e rischi di fallimento dell’investimento in istruzione universitaria. Quaderni di sociologia 64: 11–40.
Beverly, S. G., W. Elliott III, and M. Sherraden. 2013. Child Development Accounts and College Success: ccounts, Assets, Expectations, and Achievements. CSD Perspective No. 13–27. Available at: http://csd.wustl.edu/publications/documents/p13-27.pdf.
Cheatham, G. A., and W. Elliot 2013. The effects of family college savings on postsecondary school enrollment rates of students with disabilities. Economics of Education Review, 33: 95–111.
Dynarski, S. M., and J. Scott-Clayton. 2013. Financial Aid Policy: Lessons from Research. The
Future of Children 23(1): 67–91.
Goldrick-Rab, S., R. Kelchen, D. N. Harris, and J. Benson. 2016. Reducing income inequality in educational attainment: Experimental evidence on the impact of financial aid on college completion. American Journal of Sociology 121 (6): 1762–1817.
Grinstein-Weiss, M., M. Sherraden, W. G. Gale, W. M. Rohe, M. Schreiner, and C. Key. 2013. Long-term effects of Individual Development Accounts on postsecondary education: Follow-up evidence from a randomized experiment. Economics of Education Review 33: 58– 68.
Kim, Y., J. Huang, M. Sherraden, and M. Clancy. 2018. Child Development Accounts and Saving for College: Mediated by Parental Educational Expectations? Social Science Quarterly Advance online publication.
Leckie N., T. S.-W. Hui, D. Tattrie, J., Robson, and J. Voyer. 2010. Learning to Save, Saving to
Learn. Ottawa: Social Research and Demonstration Corporation.
Loke, V., and M. Sherraden. 2009. Building assets from birth: A global comparison of Child Development Account policies. International Journal of Social Work 18 (2): 119–129. Sherraden, M. 1991. Assets and the Poor: A New American Welfare Policy. Armonk, NY: ME
Sharpe.
What Works Clearinghouse 2014. Procedures and standards handbook (Version 3.0). Washington, DC: US Department of Education.