Prognostic Value of Pulmonary Blood Volume by Contrast-Enhanced Magnetic
Resonance Imaging in Heart Failure Outpatients
The PROVE-HF Study
F. Ricciab°, MD, A. Barisonc, MD, PhD, G. Todierec, MD, C. Mantini b, MD, PhD, A.R.
Cotroneob, MD, M. Emdinc, MD, PhD, R. De Caterinad, MD, PhD, S. Gallinad, MD, and G.D. Aquaroc°, MD
Affiliations:
aInstitute for Advanced Biomedical Technologies, Via Luigi Polacchi, 11 - 66100 Chieti, Italy bDepartment of Neuroscience, Imaging and Clinical Sciences, “G. d’Annunzio” University, Via dei
Vestini. 31 - 66100 Chieti, Italy
cG. Monasterio Foundation, MRI-laboratory, Via Giuseppe Moruzzi, 1 - 56124 Pisa, Italy dInstitute of Cardiology, University “G. d’Annunzio”, Via dei Vestini, 31 - 66100 Chieti, Italy
Short Title: Pulmonary Blood Volume by CMR
°F.Ricci and G.D. Aquaro equally contributed to this study
Corresponding Author: Fabrizio Ricci, MD
Institute of Cardiology, University “G. d’Annunzio” Via dei Vestini, 32
66100 Chieti, Italy Fax: (+39) 0871 358622
ABSTRACT
Aims: Pulmonary blood volume (PBV) is a novel clinical application of cardiovascular magnetic resonance (CMR) imaging for the quantitative grading of haemodynamic congestion. In this study we aimed to assess the prognostic value of PBV in a cohort of outpatients with chronic heart failure (HF).
Methods and Results: 112 consecutive patients (91 men, 67±12years) and 53 age- and sex-matched healthy controls underwent echocardiography and contrast-enhanced CMR. PBV was calculated as the product of stroke volume and the number of cardiac cycles for an intravenous bolus of gadolinium contrast to pass through the pulmonary circulation determined by first-pass perfusion imaging. Compared to healthy controls, HF outpatients showed significantly higher PBV index (PBVI, 308±92 vs. 373±175, mL/m2, P=0.012) and pulmonary transit time (PTT, 6.8±1.8 vs.
9.5±4 s, P=<0.001). During a median follow-up of 26±17 months, 27 patients (24%) reached the composite end-point of cardiovascular death, HF hospitalization or sustained ventricular arrhythmias/appropriate ICD intervention. Using a cut-off point of PBVI >492 ml/m2,
corresponding to 2 standard deviations above the mean of healthy controls, event-free survival was significantly lower in patients with higher PBVI (P<0.001). At multivariable-adjusted Cox regression analysis PBVI was an independent predictor of the composite cardiovascular end-point (per 10% increase hazard ratio 1.31, 95%CI: 1.02-1.69, P=0.03).
Conclusions: PBVI is a novel application of perfusion CMR potentially useful to quantitatively determine haemodynamic congestion as a surrogate marker of left ventricular diastolic dysfunction. PBVI might prove to be helpful in stratifying the prognosis of asymptomatic or mildly symptomatic patients with left ventricular dysfunction.
Key terms: heart failure; cardiac magnetic resonance; pulmonary blood volume; hemodynamic congestion; diastolic dysfunction.
Introduction
Assessment of clinical congestion has both therapeutic and prognostic implications for the management of patients with chronic heart failure (HF). In retrospective analyses of the Acute and Chronic Therapeutic Impact of a Vasopressin-2 Antagonist in Congestive Heart Failure (ACTIV in CHF) trial and in the Studies of Left Ventricular Dysfunction (SOLVD) treatment trial, signs of congestion in patients with chronic HF were associated with both short- and long-term increased risk of all-cause death and HF hospitalization (1, 2). Importantly, patients with asymptomatic LV dysfunction have a significantly increased risk of overt heart failure and mortality. Therefore, early detection of subclinical signs of impending haemodynamic derangement would be extremely useful to identify and treat these patients in order to prevent the progression of the disease.
Clinical congestion in HF constitutes the final common pathway for a host of cardiac disorders and is defined by the contemporary presence of high left ventricular diastolic pressure associated with signs and symptoms of HF. Conversely, “pulmonary congestion” defines a situation extravasation of fluids with an excess of extravascular lung water into the pulmonary interstitium, regardless of the presence or absence of signs and symptoms of HF(3). Elevation of left ventricular filling pressure in HF patients without overt clinical congestion has been termed as “haemodynamic congestion”, and may precede both pulmonary and clinical congestion by days or even weeks(4). Thus, clinical congestion may be considered as only the tip of the iceberg of the haemodynamic instability preceding symptoms.
Bearing in mind that the primary goal for asymptomatic and mildly symptomatic HF would be to prevent or delay disease progression, haemodynamic goals are strongly supported in the modern era of advanced HF and outpatient HF management(5). Currently, the gold standard for evaluating haemodynamic congestion in HF patients is cardiac catheterization to measure right atrial pressure and pulmonary capillary wedge pressure(2, 6, 7), however it cannot be applied routinely in patients with congestive HF and in addition it lacks the ability to measure ventricular volumes. Echocardiography is the non-invasive method of choice for the evaluation of LV diastolic function, but may be sometimes misleading, with key indices yielding discrepant information, especially in acute HF, and the inclusion of many parameters in the guidelines perceived too complex and not practical to perform and repeat on every patient admitted with HF(4, 8). Ultimately, no single non-invasive test can accurately detect and quantify haemodynamic congestion, and the ability to detect congestion by haemodynamic measurements remains a diagnostic challenge as it usually precedes clinical symptoms.
A different approach to assess the presence of haemodynamic congestion is by measuring to what extent left ventricular dysfunction leads to an increase in pulmonary blood volume (PBV). In previous studies the PBV has been measured as the product of cardiac output and pulmonary transit time (PTT) by trans-pulmonary indicator dilution techniques, which are very invasive due to the need for double catheterization. In the last decade, cardiovascular magnetic resonance (CMR) has emerged as a new, non-invasive, yet highly accurate tool to quantify blood flow and changes in total heart volume by using direct volume measurements and PTT of intravenous contrast agents. In this study, we sought to explore the prognostic value of PBV determination by first-pass contrast-enhanced perfusion CMR in a population of chronic HF outpatients.
Methods
Study design and population
The PROVE-HF study was a prospective two-centre study carried out from January 2013 to January 2015, complying with the 1975 Declaration of Helsinki and approved by our Institutional Ethics Committee. All patients gave written informed consent and received standard optimal medical therapy according to current guidelines. We screened all consecutive outpatients with left ventricular dysfunction and at least one previous episode of acute HF decompensation (ACC/AHA stage C), who were referred to our CMR laboratory for a contrast-enhanced scan. Exclusion criteria were as follows: a) age <18 years; b) LVEF >50%; c) NYHA functional class III or IV symptoms; d) presence of any contra-indication to CMR and/or to administration of gadolinium-based contrast agents; e) any hospitalization during the last month; f) atrial fibrillation.
Of 118 eligible consecutive patients, 4 were excluded for low-quality images and 2 for claustrophobia. We finally enrolled 112 chronic stable HF outpatients (91 men, 67±12years) and 53 age- and sex-matched healthy controls.
All patients underwent a standard clinical assessment including medical history, physical examination, routine serum blood tests and a same-day transthoracic echocardiogram and contrast-enhanced CMR.
Cardiovascular Magnetic Resonance
All patients were examined on 1.5-T scanners (CVi; GE Healthcare, Milwaukee, Wisconsin, USA and Achieva; Philips Medical System, Best, the Netherlands) using phased-array cardiac synergy coils for signal reception, a dedicated cardiac software and vectorcardiographic triggering. Biventricular function was assessed by breath-hold, steady-state, free-precession cine imaging in cardiac short-axis, encompassing both ventricles by contiguous 8-mm thick slices (field of view 40
cm, repetition time/echo time = 2, flip angle 45°, matrix 224 x 224, reconstruction matrix 256 x 256, 30 cardiac phases, views per segment 12-20). Pulmonary artery flow was evaluated using a breath-hold velocity encoded phase contrast gradient-echo cine sequence with the following parameters: TR/TE 12/5 ms, flip angle 20°, field of view 30, phase field of view 1, matrix 192 x 192, reconstruction matrix 256 x 256, slice thickness 5 mm. Flow sensitivity was set to 150 cm/s of encoded velocity and corrected when aliasing occurred. Then, to correct phase offset errors, acquisition was repeated with the same slice orientation and parameters in a stationary phantom. CMR perfusion imaging was performed with the first pass technique as previously described [14]. Briefly, a bolus of gadolinium–based contrast agent (0.05 mmol/kg at 4 ml/s of infusion velocity, Dotarem, Schering-AG, Berlin, Germany) was injected into a peripheral vein, followed by a saline flush (injection rate 4 ml/s). First pass images were obtained using cardiac-gated gradient echo-train echo planar pulse sequences. Images from three short axis planes (basal, middle and apical) and from a horizontal long axis view were acquired with the following parameters: field of view 30 mm, slice thickness 10 mm, no gap between each slice, repetition time 6 ms, echo time 1.1 ms, flip angle 20°, bandwidth 25 Hz, 60 phases, matrix 128 x 128, reconstruction matrix 256 x 256. Image acquisition was begun at the same time as the contrast media injection.
Image analysis
All CMR studies were analysed off-line using dedicated workstations and software (Advantage Workstation, GE Healthcare; MASS 6.1, Medis, Leiden, The Netherlands; MR WorkSpace 2.6.3.2, Philips Medical Systems Nederland B.V.) by two experienced operators (A.B. and G.T.) blinded to clinical and follow-up data.
Biventricular volumes and ejection fraction, as well as left ventricular mass, were determined using cine short-axis images. Left and right atrial areas were measured in the end-systolic frame of the four-chamber cine sequence, excluding atrial appendages and pulmonary veins. Pulmonary artery flow and aortic flow were measured by the analysis of velocity encoded phase contrast images using the conventional method(9). The effective anterograde right ventricular stroke volume (RVSV) was measured as previously reported(10).
Pulmonary transit time
A modified approach with respect to the method proposed by Ugander et al. has been adopted to measure PTT(11). The heart is a pulsatile pump and with every heartbeat RV ejects in the pulmonary circulation an amount of blood equal to the anterograde RVSV. Hence, PTT may be measured as the number of cardiac cycles, or pulmonary transit beats (PTB), required for a bolus of
contrast agent to pass from the RV to the left atrium. The gadolinium first-pass perfusion imaging allows us to obtain an image for each heartbeat for 60 consecutive beats and it may be used to measure the PTT. Briefly, in the horizontal long-axis view of first pass imaging, a region of interest was placed in the RV cavity and copied in the same position for the entire stack of images. The average signal intensity (SI) of the region of interest was measured in every images and a SI/heartbeat curve was generated (Figure 1A-B). A second SI/heartbeat curve was generated from another region of interest placed in left atrium. The PTT was measured as the peak-to-peak time interval between the curves. PTB was defined by the peak-to-peak number of cardiac cycles between the two curves. In a preliminary study we compared the measurement of PTT and PTB as onset-to-onset, peak-to-peak and half-width time interval of the wash-in phase of SI/heartbeat curves. In a preliminary evaluation, we found no significant differences among such methods, and we finally chose the peak-to-peak time interval as the most reproducible, yielding intra-class correlation coefficient values of 0.99 and 0.97 for intra-observer and inter-observer reliability, respectively.
Pulmonary blood volume
PBV was measured by the product of PTB and the anterograde RVSV, and indexed to body surface area as PBVI (ml/m2) (Figure 1A-B). This is better understood if one considers PBV as being
analogous to a cargo train, with the number of wagons equivalent to the number of cardiac cycles for intravenous bolus of gadolinium contrast to pass through the pulmonary circulation, or PTB, being each individual wagon equal to the anterograde RVSV.
Transthoracic echocardiography
All patients underwent standard transthoracic echocardiography (TTE) immediately before the CMR examination. A comprehensive echocardiographic assessment of LV diastolic function was performed in agreement with international guidelines(8), including structural assessment of LV size and mass, LA volume, mitral inflow and pulmonary venous flow patterns, pulsed-wave tissue-Doppler imaging of mitral annular velocities and systolic pulmonary artery pressure (sPAP). LV diastolic dysfunction was defined as the presence of a grade II or III diastolic dysfunction with Doppler echocardiography (12).
Clinical follow-up
Follow-up was performed until December 2016 by telephone interviews, reviews of clinical records and contact with patients’ primary care physician. Cause of death was classified according to
modified Hinkle–Thaler system. Patients who died of noncardiac causes were censored at the time of the event. The predefined primary end-point was a composite of cardiovascular death (heart failure, sudden death), hospitalization for heart failure (requiring intravenous diuretics and/or inotropes) and sustained symptomatic ventricular arrhythmias (requiring intravenous antiarrhythmic drugs and/or electrical cardioversion and/or appropriate defibrillator intervention).
Statistical analysis
Continuous variables were expressed as mean ± standard deviation (SD) or median and interquartile range, while categorical variables were expressed as frequency and percentage. Student’s independent t-test, or Mann-Whitney nonparametric test, were used to compare continuous variables, while categorical variables were compared using the Chi-square or Fisher’s exact test. The correlation between continuous variables was estimated with Pearson’s or Spearman’s correlation coefficient analysis, as appropriate. Event-free survival curves were estimated using the Kaplan-Meier method and analysed by chi-square log-rank test. Univariate and multivariate analyses were performed to determine predictors of the primary endpoint. Multivariable-adjusted Cox regression model was applied and PBVI was entered as an independent variable. The adjusted model was built by adding age, sex and those covariates found to be statistically significant at univariate analysis. The significance level of all analyses was set at p<0.05. Statistical analyses were performed using MedCalc for Windows, version 12.5 (MedCalc Software, Ostend, Belgium) and Wizard for Mac, version 1.7.8 (Boston, USA).
Results
Baseline characteristics of the study population are summarized in Table 1 and 2. All patients had a history of heart failure symptoms (ACC/AHA stage C) and were receiving optimal medical therapy. At enrolment 60 patients (54%) were in NYHA functional class I, and 52 patients (46%) were in NYHA class II. Of 112 HF outpatients with LV dysfunction, 57 (51%) had been diagnosed with ischemic cardiomyopathy, 37 (33%) with an idiopathic DCM, 5 patients (4%) with a genetic syndrome (one Becker’s muscular dystrophy and 4 laminopathies,), 8 patients (7%) had a previous myocarditis, 2 patients (2%) had incessant supraventricular tachycardia and developed tachycardiomyopathy, 3 patients (3%) had previous exposure to chemotherapy.
Compared with controls, HF outpatients showed significantly increased LV volumes and mass, as well as reduced LV and RV ejection fraction. Both pulmonary transit time and PBVI were significantly higher in patients compared to controls (Table 1).
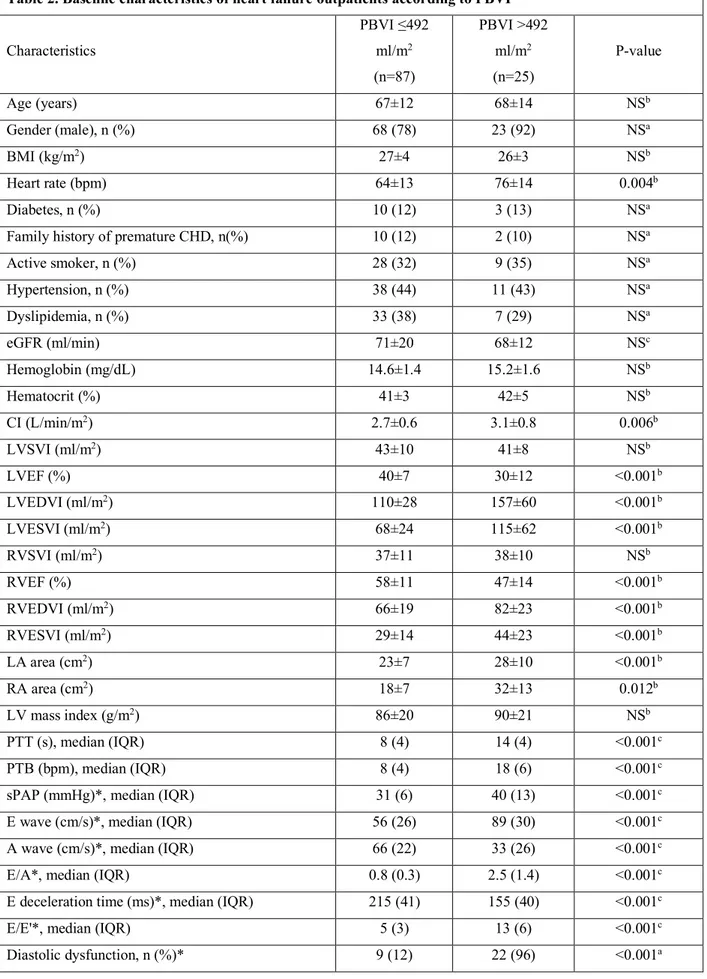
Baseline characteristics of chronic HF outpatients stratified by PBVI values are reported in Table 2. At a cut-off point for PBVI of 492 mL/m2 (corresponding to 2 SD above the mean of our control
population), 25 (22%) HF outpatients had increased PBVI. Compared with patients with normal PBVI, subjects with PBVI>492 ml/m2 were more likely to have more advanced diastolic
dysfunction (Figure 2) and worse biventricular systolic function (P<0.001) (Table 2).
Of note, PBVI was significantly associated with several echocardiographic indices of diastolic dysfunction by TTE (Figure 3). In particular, PBVI showed a significant positive correlation with tissue-Doppler E/e’ ratio and systolic pulmonary artery pressure by CW-Doppler (Figure 3 A-D).
Survival analysis
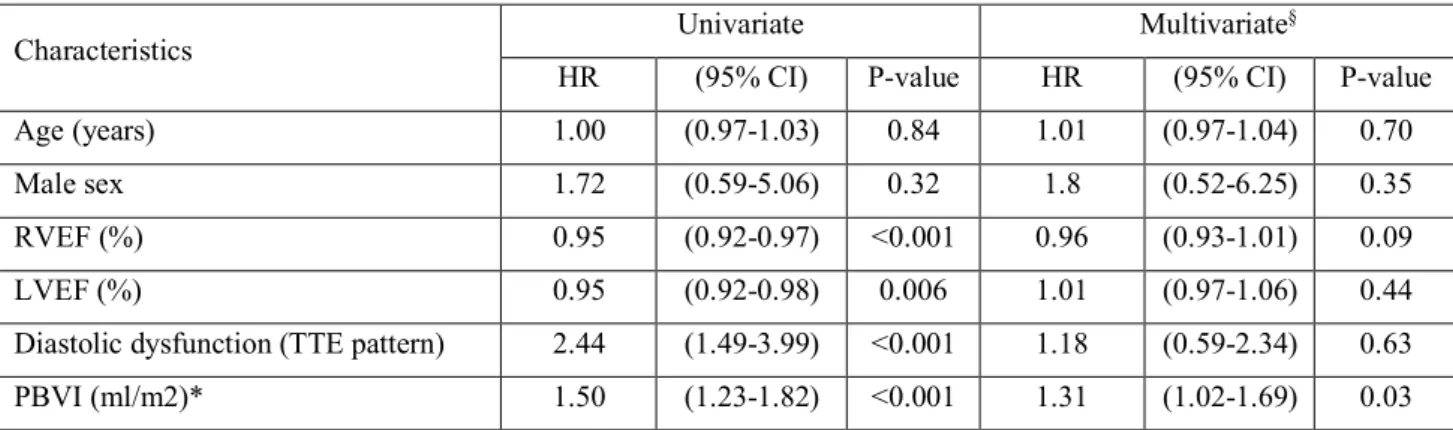
During a median follow-up period of 26±17 months, 16 patients (14%) underwent ICD implantation and 27 patients (24%) reached the primary composite end-point: 4 cardiovascular death, 10 sustained ventricular arrhythmias (with or without appropriate ICD intervention) and 13 hospitalizations for acute decompensated HF. Of these, 18 patients showed abnormally high PBVI. PBVI>492 ml/m2 was associated with a significant lower event-free survival (log-rank test
P<0.001) (Figure 4). On multivariable-adjusted Cox regression analysis PBVI was an independent predictor of the composite cardiovascular endpoint (P=0.03)(Table 3). Important interaction terms such as estimated glomerular filtration rate, left atrium area, right and left cardiac index, PTT and LV mass were also included; however, none of the interactions were significant and therefore were not included in the final model of the analysis.
Discussion
In this proof-of-concept study we have demonstrated the utility of first-pass perfusion imaging by CMR for the quantification of PBVI in HF outpatients. The major findings of this study were that: 1) HF outpatients showed higher PBVI and longer mean pulmonary transit time compared with age- and sex-matched healthy controls; 2) severity of diastolic dysfunction increased in parallel to the increase of PBVI; 3) PBVI was found to be an independent predictor of poor mid-term cardiovascular outcome.
The two main haemodynamic abnormalities leading to acute HF are low cardiac output and increased LV filling pressures, but the main reason by far for hospitalization for worsening HF is related to the symptoms of congestion. Importantly, many patients are discharged with persistent signs and symptoms of congestion, which has prognostic relevance in HF patients. Indeed, incomplete decongestion at discharge is a strong predictor of poor prognosis(13) and has been proposed as a major determinant of early death and heart failure readmission. Current HF
guidelines recommend treating patients in order to improve symptoms and signs of congestion, and achieve near-optimal volume status prior to discharge(14). Unfortunately, standardized metrics or (de)congestion scores are still an unmet clinical need(4, 15). Currently, the gold standard for evaluating haemodynamic congestion in HF patients is cardiac catheterization to measure right atrial pressure, pulmonary artery wedge pressure and/or left ventricular end-diastolic pressure, but the invasive nature of catheterization limits its routine use in clinical practice. Multiple modalities have been introduced to estimate hemodynamic parameters without invasive measurement. Natriuretic peptides have been helpful in urgent care settings to suggest cardiac aetiology of dyspnoea and to identify patients at high or low risk for early adverse outcome, albeit related to wide inter-individual variability to ventricular filling pressures (16, 17).
Several non-invasive techniques, including external and internal bio-impedance measurement and Doppler echocardiography, have generated estimates significantly correlated with filling pressures and cardiac output. Unfortunately, these techniques lack accuracy to guide therapies on the basis of serial changes(7). Furthermore, sensitivity and negative predictive value of the 2009 and 2016 echocardiographic grading algorithms for diagnosis of LV diastolic dysfunction have been recently questioned by the results of the multicentre EACVI Euro-Filling study(18).
Our knowledge of the haemodynamic of the pulmonary vascular bed is based on the measurement of three main variables: the pulmonary blood pressure, pulmonary blood flow, and PBV. Of these, PBV has found little clinical favour due to technical difficulties associated with its measurement that has largely limited its use so far(19). Previous attempts have been based on invasive electromagnetic flowmetry or Stewart-Hamilton dye-dilution based techniques during both right heart and transseptal left heart catheterization, radioactive isotope injection or echocardiography(20-26). However, catheterization is associated with potential major vascular complications, radionuclide studies pose the risk of radiation exposure, and echocardiography is of questionable accuracy for the quantification of cardiac output.
PTT is proportional to PBV, and represents the time for a bolus of contrast to pass from the right ventricle to the left ventricle, measured according to the indicator dilution principles. An increase in PTT reflects the reduction in cardiac output and an increase in PBV in HF. PTT by contrast-enhanced ultrasound has been shown to correlate to a fair degree with measures of systolic and diastolic function, NT-pro-BNP, pulmonary vascular status, right ventricular function and quality of life among patients with and without LV dysfunction, and has already been indicated as a biomarker of global cardiopulmonary function(27, 28).
Previous research has shown that variations in PBV and PTT can be accurately evaluated using CMR(11, 29). CMR provides additional incremental data in patients with HF, supplying accurate
quantification of systolic dysfunction and tissue characterization, allowing understanding of aetiology and pathophysiology of HF in the individual patient and permitting specific therapy to be administered and predicting prognosis(30). Furthermore, CMR is the gold-standard imaging technique for the non-invasive quantification of cardiovascular flow volumes(10) and its use has been strongly advocated in serial follow-up assessment for determination of cardiac recovery after episodes of acute decompensated HF(31).
Our study corroborates and extends preliminary findings supporting the feasibility of measuring PBVI by first-pass perfusion CMR imaging(11, 32), and the ability of PBVI to differentiate between stages of diastolic dysfunction(28) and predict prognosis(33).
As a quantitative marker of HF, PBVI could be useful for early detection, grading and monitoring of haemodynamic congestion in patients with left ventricular dysfunction, especially during the so-called ‘vulnerable phase’. This is a critical time-window during which nearly 30% of patients hospitalized with HF will be readmitted for HF or other cardiovascular reasons, due to the return or worsening of congestive symptoms with even a modest incremental rise in filling pressures after discharge(31, 34). In this setting PBVI by CMR could be a sensitive tool to unravel poor haemodynamic reserve and help the clinician to tailor optimal medical treatment. As the list of indications to the use of CMR in HF patients is rapidly expanding, measurement of PTT and PBVI would certainly deserve appropriate consideration as a complementary clinical application(35). Kanski et al. observed that patients recently diagnosed with systemic sclerosis, as a group, have a reduced amount of PBVI, assessed by phase-contrast imaging and normalized to lung volume, compared to healthy controls(36). However, authors failed to observe a relationship between PBVI and sPAP, as estimated by Doppler echocardiography. The source of differences between that study and our results should be very carefully interpreted, taking into account how they might be affected by methodological issues and different patient populations.
Further studies are warranted in order to: i) confirm our results; ii) assess the utility of PBVI in different clinical settings; iii) investigate the association between PBVI and serum levels of natriuretic peptides; iv) determine whether PBVI has any incremental diagnostic and/or prognostic value above conventional diastolic function assessment; v) test the diagnostic accuracy of PBVI with established gold-standard invasive techniques for the measurement of pulmonary artery wedge pressure and LV filling pressure.
Limitations
We acknowledge that there are a few limitations of the present study. Firstly, because of the limited sample size and the relatively low event rate, the multivariable analysis is likely to be
underpowered to derive a robust predictive model and our findings should only be intended as hypothesis-generating. Secondly, the accuracy of measuring PBVI may be limited due to the uncertain relationship between the bolus concentration of contrast material and the signal intensity on CMR images used for PTT measurements. Thirdly, the cut-off value of PBVI derived in our cohort of healthy controls is limited to the age group studied, thus larger cohorts are required to validate the sensitivity and specificity of PBVI at different cut-off points. Fourthly, we did not compare PBVI values to invasive haemodynamic measurements and serum levels of natriuretic peptides.
Lastly, CMR is a third level imaging technique and one might consider this application inappropriate because of the high cost. However, in patients with chronic HF undergoing a CMR scan for functional assessment and tissue characterization, the assessment of PBVI may provide the clinician with additive quantitative information useful for grading of diastolic dysfunction.
Conclusions
PBVI by contrast-enhanced CMR is a novel imaging application useful to quantitatively determine pulmonary intravascular blood pool and a promising surrogate marker of diastolic dysfunction. In our series of HF outpatients, increased PBVI was associated with an increase in the severity of diastolic dysfunction and poor cardiovascular outcome. Further studies are warranted to confirm our results and to assess the clinical and prognostic utility of PBVI by CMR in different clinical settings.
Funding sources: none. Disclosures: none.
Acknowledgements: We thank Leanne King for assistance with English language editing. References 1. Drazner MH, Rame JE, Stevenson LW, Dries DL. Prognostic importance of elevated jugular venous pressure and a third heart sound in patients with heart failure. The New England journal of medicine. 2001 Aug 23;345(8):574-81. PubMed PMID: 11529211. 2. Gheorghiade M, Gattis WA, O'Connor CM, Adams KF, Jr., Elkayam U, Barbagelata A, et al. Effects of tolvaptan, a vasopressin antagonist, in patients hospitalized with worsening heart failure: a randomized controlled trial. Jama. 2004 Apr 28;291(16):1963-71. PubMed PMID: 15113814.
3. Ricci F, Aquilani R, Radico F, Bianco F, Dipace GG, Miniero E, et al. Role and importance of ultrasound lung comets in acute cardiac care. European heart journal Acute cardiovascular care. 2014 Sep 29. PubMed PMID: 25267879. 4. Gheorghiade M, Follath F, Ponikowski P, Barsuk JH, Blair JE, Cleland JG, et al. Assessing and grading congestion in acute heart failure: a scientific statement from the acute heart failure committee of the heart failure association of the European Society of Cardiology and endorsed by the European Society of Intensive Care Medicine. European journal of heart failure. 2010 May;12(5):423-33. PubMed PMID: 20354029. 5. Adamson PB, Magalski A, Braunschweig F, Bohm M, Reynolds D, Steinhaus D, et al. Ongoing right ventricular hemodynamics in heart failure: clinical value of measurements derived from an implantable monitoring system. Journal of the American College of Cardiology. 2003 Feb 19;41(4):565-71. PubMed PMID: 12598066. 6. Swan HJ, Ganz W, Forrester J, Marcus H, Diamond G, Chonette D. Catheterization of the heart in man with use of a flow-directed balloon-tipped catheter. The New England journal of medicine. 1970 Aug 27;283(9):447-51. PubMed PMID: 5434111. 7. Stevenson LW. Are hemodynamic goals viable in tailoring heart failure therapy? Hemodynamic goals are relevant. Circulation. 2006 Feb 21;113(7):1020-7; discussion 33. PubMed PMID: 16490837. 8. Nagueh SF, Smiseth OA, Appleton CP, Byrd BF, 3rd, Dokainish H, Edvardsen T, et al. Recommendations for the Evaluation of Left Ventricular Diastolic Function by Echocardiography: An Update from the American Society of Echocardiography and the European Association of Cardiovascular Imaging. European heart journal cardiovascular Imaging. 2016 Dec;17(12):1321-60. PubMed PMID: 27422899. 9. Kramer CM, Barkhausen J, Flamm SD, Kim RJ, Nagel E, Society for Cardiovascular Magnetic Resonance Board of Trustees Task Force on Standardized P. Standardized cardiovascular magnetic resonance (CMR) protocols 2013 update. Journal of cardiovascular magnetic resonance : official journal of the Society for Cardiovascular Magnetic Resonance. 2013;15:91. PubMed PMID: 24103764. Pubmed Central PMCID: 3851953. 10. Aquaro GD, Barison A, Todiere G, Festa P, Ait-Ali L, Lombardi M, et al. Cardiac magnetic resonance 'virtual catheterization' for the quantification of valvular regurgitations and cardiac shunt. Journal of cardiovascular medicine. 2015 Oct;16(10):663. PubMed PMID: 25643193. 11. Ugander M, Kanski M, Engblom H, Gotberg M, Olivecrona GK, Erlinge D, et al. Pulmonary blood volume variation decreases after myocardial infarction in pigs: a quantitative and noninvasive MR imaging measure of heart failure. Radiology. 2010 Aug;256(2):415-23. PubMed PMID: 20656833. 12. Mitter SS, Shah SJ, Thomas JD. A Test in Context: E/A and E/e' to Assess Diastolic Dysfunction and LV Filling Pressure. Journal of the American College of Cardiology. 2017 Mar 21;69(11):1451-64. PubMed PMID: 28302294. 13. Coiro S, Rossignol P, Ambrosio G, Carluccio E, Alunni G, Murrone A, et al. Prognostic value of residual pulmonary congestion at discharge assessed by lung ultrasound imaging in heart failure. European journal of heart failure. 2015 Nov;17(11):1172-81. PubMed PMID: 26417699. 14. McMurray JJ, Adamopoulos S, Anker SD, Auricchio A, Bohm M, Dickstein K, et al. ESC Guidelines for the diagnosis and treatment of acute and chronic heart failure 2012: The Task Force for the Diagnosis and Treatment of Acute and Chronic Heart Failure 2012 of the European Society of Cardiology. Developed in collaboration with the Heart Failure Association (HFA) of the ESC. European heart journal. 2012 Jul;33(14):1787-847. PubMed PMID: 22611136. 15. Voors AA, Ter Maaten JM. Tackling Early Heart Failure Deaths and Readmissions by Estimating Congestion. JACC Heart failure. 2015 Nov;3(11):894-5. PubMed PMID: 26541788.
16. Horwich TB, Patel J, MacLellan WR, Fonarow GC. Cardiac troponin I is associated with impaired hemodynamics, progressive left ventricular dysfunction, and increased mortality rates in advanced heart failure. Circulation. 2003 Aug 19;108(7):833-8. PubMed PMID: 12912820. 17. Miglioranza MH, Gargani L, Sant'Anna RT, Rover MM, Martins VM, Mantovani A, et al. Lung ultrasound for the evaluation of pulmonary congestion in outpatients: a comparison with clinical assessment, natriuretic peptides, and echocardiography. JACC Cardiovascular imaging. 2013 Nov;6(11):1141-51. PubMed PMID: 24094830. 18. Lancellotti P, Galderisi M, Edvardsen T, Donal E, Goliasch G, Cardim N, et al. Echo- Doppler estimation of left ventricular filling pressure: results of the multicentre EACVI Euro-Filling study. European heart journal cardiovascular Imaging. 2017 Apr 22. PubMed PMID: 28444160. 19. Hannan WJ, Vojacek J, Connell HM, Dewhurst NG, Muir AL. Radionuclide determined pulmonary blood volume in ischaemic heart disease. Thorax. 1981 Dec;36(12):922-7. PubMed PMID: 7336371. Pubmed Central PMCID: 471862. 20. Donato L, Giuntini C, Lewis ML, Durand J, Rochester DF, Harvey RM, et al. Quantitative radiocardiography. I. Theoretical considerations. Circulation. 1962 Aug;26:174-82. PubMed PMID: 13887190. 21. Giuntini C, Lewis ML, Luis AS, Harvey RM. A Study of the Pulmonary Blood Volume in Man by Quantitative Radiocardiography. The Journal of clinical investigation. 1963 Oct;42:1589-605. PubMed PMID: 14077387. Pubmed Central PMCID: 289438. 22. Schreiner BF, Jr., Murphy GW, James DH, Yu PN. Pulmonary blood volume in patients with congestive heart failure. Transactions of the Association of American Physicians. 1966;79:250-61. PubMed PMID: 5333535. 23. Mischi M, Korsten HH. Transpulmonary dilution system identification for pulmonary blood volume measurements by contrast echocardiography. Conference proceedings : Annual International Conference of the IEEE Engineering in Medicine and Biology Society IEEE Engineering in Medicine and Biology Society Annual Conference. 2006;1:1818-21. PubMed PMID: 17945670. 24. Mischi M, Kalker TA, Korsten EH. Contrast echocardiography for pulmonary blood volume quantification. IEEE transactions on ultrasonics, ferroelectrics, and frequency control. 2004 Sep;51(9):1137-47. PubMed PMID: 15478975. 25. Herold IH, Soliman Hamad MA, van Assen HC, Bouwman RA, Korsten HH, Mischi M. Pulmonary blood volume measured by contrast enhanced ultrasound: a comparison with transpulmonary thermodilution. British journal of anaesthesia. 2015 Jul;115(1):53-60. PubMed PMID: 25753598. 26. Fishman AP. The volume of blood in the lungs. Circulation. 1966 Jun;33(6):835-8. PubMed PMID: 5328603. 27. de Lepper AGW, Herold IHF, Saporito S, Bouwman RA, Mischi M, Korsten HHM, et al. Noninvasive pulmonary transit time: A new parameter for general cardiac performance. Echocardiography. 2017 Jun 09. PubMed PMID: 28600804. 28. Brittain EL, Doss LN, Saliba L, Irani W, Byrd BF, 3rd, Monahan K. Feasibility and Diagnostic Potential of Pulmonary Transit Time Measurement by Contrast Echocardiography: A Pilot Study. Echocardiography. 2015 Oct;32(10):1564-71. PubMed PMID: 25682691. Pubmed Central PMCID: 4536186. 29. Shors SM, Cotts WG, Pavlovic-Surjancev B, Francois CJ, Gheorghiade M, Finn JP. Heart failure: evaluation of cardiopulmonary transit times with time-resolved MR angiography. Radiology. 2003 Dec;229(3):743-8. PubMed PMID: 14657311.
30. Sado DM, Hasleton JM, Herrey AS, Moon JC. CMR in Heart Failure. Cardiology research and practice. 2011;2011:739157. PubMed PMID: 21876825. Pubmed Central PMCID: 3157673. 31. Greene SJ, Fonarow GC, Vaduganathan M, Khan SS, Butler J, Gheorghiade M. The vulnerable phase after hospitalization for heart failure. Nature reviews Cardiology. 2015 Apr;12(4):220-9. PubMed PMID: 25666406. 32. Ugander M, Jense E, Arheden H. Pulmonary intravascular blood volume changes through the cardiac cycle in healthy volunteers studied by cardiovascular magnetic resonance measurements of arterial and venous flow. Journal of cardiovascular magnetic resonance : official journal of the Society for Cardiovascular Magnetic Resonance. 2009;11:42. PubMed PMID: 19878570. Pubmed Central PMCID: 2773236. 33. Skrok J, Shehata ML, Mathai S, Girgis RE, Zaiman A, Mudd JO, et al. Pulmonary arterial hypertension: MR imaging-derived first-pass bolus kinetic parameters are biomarkers for pulmonary hemodynamics, cardiac function, and ventricular remodeling. Radiology. 2012 Jun;263(3):678-87. PubMed PMID: 22509050. Pubmed Central PMCID: 3359516. 34. Zile MR, Bennett TD, St John Sutton M, Cho YK, Adamson PB, Aaron MF, et al. Transition from chronic compensated to acute decompensated heart failure: pathophysiological insights obtained from continuous monitoring of intracardiac pressures. Circulation. 2008 Sep 30;118(14):1433-41. PubMed PMID: 18794390. 35. Karamitsos TD, Francis JM, Myerson S, Selvanayagam JB, Neubauer S. The role of cardiovascular magnetic resonance imaging in heart failure. Journal of the American College of Cardiology. 2009 Oct 6;54(15):1407-24. PubMed PMID: 19796734. 36. Kanski M, Arheden H, Wuttge DM, Bozovic G, Hesselstrand R, Ugander M. Pulmonary blood volume indexed to lung volume is reduced in newly diagnosed systemic sclerosis compared to normals--a prospective clinical cardiovascular magnetic resonance study addressing pulmonary vascular changes. Journal of cardiovascular magnetic resonance : official journal of the Society for Cardiovascular Magnetic Resonance. 2013;15:86. PubMed PMID: 24066703. Pubmed Central PMCID: 3850930.
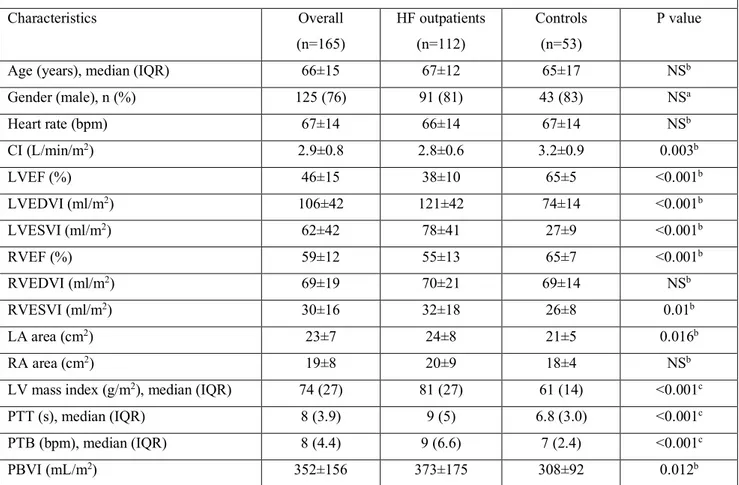
Table 1. Baseline characteristics of HF outpatients and healthy controls Characteristics Overall (n=165) HF outpatients (n=112) Controls (n=53) P value
Age (years), median (IQR) 66±15 67±12 65±17 NSb
Gender (male), n (%) 125 (76) 91 (81) 43 (83) NSa Heart rate (bpm) 67±14 66±14 67±14 NSb CI (L/min/m2) 2.9±0.8 2.8±0.6 3.2±0.9 0.003b LVEF (%) 46±15 38±10 65±5 <0.001b LVEDVI (ml/m2) 106±42 121±42 74±14 <0.001b LVESVI (ml/m2) 62±42 78±41 27±9 <0.001b RVEF (%) 59±12 55±13 65±7 <0.001b RVEDVI (ml/m2) 69±19 70±21 69±14 NSb RVESVI (ml/m2) 30±16 32±18 26±8 0.01b LA area (cm2) 23±7 24±8 21±5 0.016b RA area (cm2) 19±8 20±9 18±4 NSb
LV mass index (g/m2), median (IQR) 74 (27) 81 (27) 61 (14) <0.001c
PTT (s), median (IQR) 8 (3.9) 9 (5) 6.8 (3.0) <0.001c
PTB (bpm), median (IQR) 8 (4.4) 9 (6.6) 7 (2.4) <0.001c
PBVI (mL/m2) 352±156 373±175 308±92 0.012b
Data are presented as mean±SD unless otherwise indicated. CI= cardiac index; HF=heart failure; IQR=interquartile range; LA=left atrium; LVEDVI=left ventricular end-diastolic volume index; LVEF=left ventricular ejection fraction; LVESVI=left ventricualr end-systolic volume index; LV=left ventricle; PTB= pulmonary transit beats; PTT=pulmonary transit time; PBVI=pulmonary blood volume indexed to body surface area; RA=right atrium; RVEDVI=right ventricular diastolic volume index; RVEF=right ventricular ejection fraction; RVESVI=right ventricular end-systolic volume index; SD=standard deviation. aChi-squared test; bStudent' t-test for unpaired data; cMann-Whitney U
Table 2. Baseline characteristics of heart failure outpatients according to PBVI Characteristics PBVI ≤492 ml/m2 (n=87) PBVI >492 ml/m2 (n=25) P-value Age (years) 67±12 68±14 NSb Gender (male), n (%) 68 (78) 23 (92) NSa BMI (kg/m2) 27±4 26±3 NSb Heart rate (bpm) 64±13 76±14 0.004b Diabetes, n (%) 10 (12) 3 (13) NSa
Family history of premature CHD, n(%) 10 (12) 2 (10) NSa
Active smoker, n (%) 28 (32) 9 (35) NSa Hypertension, n (%) 38 (44) 11 (43) NSa Dyslipidemia, n (%) 33 (38) 7 (29) NSa eGFR (ml/min) 71±20 68±12 NSc Hemoglobin (mg/dL) 14.6±1.4 15.2±1.6 NSb Hematocrit (%) 41±3 42±5 NSb CI (L/min/m2) 2.7±0.6 3.1±0.8 0.006b LVSVI (ml/m2) 43±10 41±8 NSb LVEF (%) 40±7 30±12 <0.001b LVEDVI (ml/m2) 110±28 157±60 <0.001b LVESVI (ml/m2) 68±24 115±62 <0.001b RVSVI (ml/m2) 37±11 38±10 NSb RVEF (%) 58±11 47±14 <0.001b RVEDVI (ml/m2) 66±19 82±23 <0.001b RVESVI (ml/m2) 29±14 44±23 <0.001b LA area (cm2) 23±7 28±10 <0.001b RA area (cm2) 18±7 32±13 0.012b LV mass index (g/m2) 86±20 90±21 NSb PTT (s), median (IQR) 8 (4) 14 (4) <0.001c PTB (bpm), median (IQR) 8 (4) 18 (6) <0.001c
sPAP (mmHg)*, median (IQR) 31 (6) 40 (13) <0.001c
E wave (cm/s)*, median (IQR) 56 (26) 89 (30) <0.001c
A wave (cm/s)*, median (IQR) 66 (22) 33 (26) <0.001c
E/A*, median (IQR) 0.8 (0.3) 2.5 (1.4) <0.001c
E deceleration time (ms)*, median (IQR) 215 (41) 155 (40) <0.001c
E/E'*, median (IQR) 5 (3) 13 (6) <0.001c
Data are presented as mean±SD unless otherwise indicated. BMI=body mass index; CHD=coronary heart disease; CI=cardiac index; E wave Doppler transmitral flow early diastolic peak velocity; A wave=pulsed-wave Doppler transmitral flow late diastolic peak velocity; E'= tissue-Doppler early diastolic mitral annular velocity; eGFR=estimated glomerular filtration rate; HF=heart failure; IQR=interquartile range; NYHA=New York Heart Association; LA=left atrium; LVEDVI=left ventricular end-diastolic volume index; LVEF=left ventricular ejection fraction; LVESVI=left ventricular end-systolic volume index; LV=left ventricle; LVSVI=left ventricular stroke volume index; PTB=pulmonary transit beats; PTT=pulmonary transit time; PBVI=pulmonary blood volume index; PV=pulmonary volume; RA=right atrium; RVEDVI=right ventricular end-diastolic volume index; RVEF=right ventricular ejection fraction; RVESVI=right ventricular end-systolic volume index; RVSVI=right ventricular stroke volume index; SD=standard deviation; sPAP=systolic pulmonary artery pressure.
aChi-squared test; bStudent' t-test for unpaired data; cMann-Whitney U test.
Table 3. Relations between PBVI and incident risk of cardiovascular composite outcome in crude and multivariable-adjusted Cox regression model
Characteristics Univariate Multivariate
§
HR (95% CI) P-value HR (95% CI) P-value
Age (years) 1.00 (0.97-1.03) 0.84 1.01 (0.97-1.04) 0.70
Male sex 1.72 (0.59-5.06) 0.32 1.8 (0.52-6.25) 0.35
RVEF (%) 0.95 (0.92-0.97) <0.001 0.96 (0.93-1.01) 0.09
LVEF (%) 0.95 (0.92-0.98) 0.006 1.01 (0.97-1.06) 0.44
Diastolic dysfunction (TTE pattern) 2.44 (1.49-3.99) <0.001 1.18 (0.59-2.34) 0.63
PBVI (ml/m2)* 1.50 (1.23-1.82) <0.001 1.31 (1.02-1.69) 0.03
*per 10% increase; §adjusted for all entered covariates; CI= confidence interval; HR= hazard ratio; LVEF= left ventricular ejection fraction; PBVI= pulmonary blood volume index; RVEF= right ventricular ejection fraction; TTE= transthoracic echocardiography;
LEGEND TO FIGURES:
Figure 1. Calculation of pulmonary transit time and pulmonary blood volume index (see methods section). A) 49 years-old healthy control (BSA 1.8 m2) with preserved LV systolic function (LVEF
65%), normal diastolic function, normal PTT (6 s; R-R interval 1000 ms), normal RVSV (90 ml) and normal PBVI (300 ml/m2); B) 65 years-old HF outpatient (BSA 1.8 m2) with severe left
ventricular dysfunction (LVEF 25%), grade 3 diastolic dysfunction, prolonged PTT (9 s; R-R interval 833 ms), normal RVSV (90 ml) and elevated PBVI (550 ml/m2).
BSA=body surface area; HR=heart rate; LV=left ventricle; LVEF=left ventricular ejection fraction; PBVI=pulmonary blood volume index; PTT=pulmonary transit time; RVSV=right ventricular stroke volume.
Figure 2. Histograms of pulmonary blood volume index across different echocardiographic stages of diastolic dysfunction.
PBVI=pulmonary blood volume index.
Figure 3. Relationship between pulmonary blood volume index and echocardiographic indices of diastolic function.
E/A=mitral valve E velocity divided by A-wave velocity; E/e’=mitral valve E velocity divided by mitral annular e’ velocity; PBVI=pulmonary blood volume index; sPAP=systolic pulmonary artery pressure.
Figure 4. Kaplan–Meier survival curve according to pulmonary blood volume index. Patients with PBVI >492 ml/m2 (corresponding to 2 standard deviations above the mean of healthy controls) had
a significantly higher incidence of the composite outcome of cardiovascular death, heart failure hospitalization or sustained ventricular arrhythmias/appropriate ICD intervention than the other subgroup of patients with PBVI ≤492 ml/m2.