Clinical impact of different exosomes’ protein
expression in pancreatic ductal carcinoma
patients treated with standard first line
palliative chemotherapy
Riccardo GiampieriID1*, Francesco Piva2, Giulia Occhipinti2, Alessandro Bittoni1,
Alessandra Righetti2, Silvia Pagliaretta1, Alberto Murrone1, Francesca Bianchi1, Consuelo Amantini3, Matteo Giulietti3, Giulia Ricci1, Giovanni Principato2, Giorgio Santoni3, Rossana Berardi1, Stefano Cascinu4
1 Oncologia Clinica c/o UniversitàPolitecnica delle Marche, Dipartimento Scienze Cliniche e Molecolari – Azienda Ospedaliera Universitaria Ospedali Riuniti di Ancona, Ancona, Italy, 2 Biologia e biochimica c/o UniversitàPolitecnica delle Marche, Dipartimento di Scienze Cliniche Specialistiche ed
Odontostomatologiche – Azienda Ospedaliera Universitaria Ospedali Riuniti di Ancona, Ancona, Italy, 3 Farmacia, Universitàdi Camerino, Camerino, Italy, 4 Dipartimento Onco-ematologia Ospedale Universitario di Modena, Universitàdi Modena e Reggio Emilia, Modena, Italy
*[email protected],[email protected]
Abstract
Introduction
Pancreatic ductal adenocarcinoma is associated to dismal prognosis despite the use of pal-liative chemotherapy, partly due to the lack of knowledge of biological processes underlying disease progression. Exosomes have been identified as biomarkers sources in different cancer types. Aim of the study was to analyse the contents of circulating exosomes in patients with pancreatic cancer who received palliative chemotherapy.
Patients and methods
Patients were submitted to blood sample collection before chemotherapy (T0) and after 3 months (T3). We quantified by an ELISA-based technique specific proteins of cancer-derived exosomes (CD44,CD44v6,EpCAM,CD9,CD81,Tspan8,Integrinα6,Integrinβ4, CD24,CXCR4). We correlated the baseline levels of these factors and changes between T3 and T0 and survival outcomes. Survival analyses were performed by Kaplan-Meier method. Correlation was assessed by log-rank test and level of statistical significance was set at 0.05. Multivariate analysis was performed by logistic regression analysis.
Results
Nineteen patients were enrolled. EpCAM T0 levels and increased EpCAM levels from T0 to T3 were those mostly associated with differences in survival. Patients having higher EpCAM had median progression free survival (PFS) of 3.18vs7.31 months (HR:2.82,95% CI:1.03–7.73,p = 0.01). Overall survival (OS) was shorter for patients having higher EpCAM
a1111111111 a1111111111 a1111111111 a1111111111 a1111111111 OPEN ACCESS
Citation: Giampieri R, Piva F, Occhipinti G, Bittoni
A, Righetti A, Pagliaretta S, et al. (2019) Clinical impact of different exosomes’ protein expression in pancreatic ductal carcinoma patients treated with standard first line palliative chemotherapy. PLoS ONE 14(5): e0215990.https://doi.org/10.1371/ journal.pone.0215990
Editor: Jeffrey Chalmers, The Ohio State University,
UNITED STATES
Received: December 13, 2018 Accepted: April 11, 2019 Published: May 2, 2019
Copyright:© 2019 Giampieri et al. This is an open access article distributed under the terms of the Creative Commons Attribution License, which permits unrestricted use, distribution, and reproduction in any medium, provided the original author and source are credited.
Data Availability Statement: All relevant data are
within the manuscript and its Supporting Information files.
Funding: This research article was funded by AIRC
(Associazione Italiana Ricerca Cancro), Via San Vito 7, 20123, Milano (MI), 800.350.350,https:// www.airc.it. The research grant (IG 2014 15821) was awarded to CS and GR (specific grant number: CUP OD:I32I14005450005). The funders had no role in study design, data collection and analysis,
(5.83vs16.45 months,HR:6.16,95%CI:1.93–19.58,p = 0.0001) and also response rates (RR) were worse (20%vs87%,p = 0.015). EpCAM increase during treatment was associated with better median PFS (2.88vs7.31 months,HR:0.24,95%CI:0.04–1.22,p = 0.003). OS was also better (8.75vs11.04 months, HR:0.77,95%CI:0.21–2.73,p = 0.66) and RR were 60% vs20% (p = 0.28). Among clinical factors that might determine changes on PFS and OS, only ECOG PS was associated to significantly worse PFS and OS (p = 0.0137and<0.001 respectively).Multivariate analysis confirmed EpCAM T0 levels and EpCAM T0/T3 changes as independent prognostic factors for PFS.
Conclusions
Pancreatic cancer patients exosomes express EpCAM, whose levels change during treat-ment. This represents a useful prognostic factor and also suggests that future treatment modalities who target EpCAM should be tested in pancreatic cancer patients selected by exosome EpCAM expression.
1. Introduction
Pancreatic ductal adenocarcinoma (PDAC) represents one of the deadliest malignancies known worldwide, with less than 20% one-year survival rate [1].
Particularly in western countries, due to the increase of its incidence, an increase in mortal-ity can be estimated in the next decades, with a number of deaths comparable with other more common cancer types such as colorectal cancer. The dismal prognosis of patients diagnosed with this disease can be traced back to the lack of early symptoms (owing to late diagnoses), the high prevalence of risk factors (such as tobacco smoking, diabetes, obesity and increased alcohol intake) and poor response to treatments. In particular, novel treatment options for patients with PDAC are lacking (with the exception of Pembrolizumab for the relatively rare number of patients who have altered mismatch repair activity in the tumour).
In the last decade advances in palliative treatment of this group of patients has mainly con-sisted of various chemotherapy combinations of 2 (Gemcitabine + Nab-Paclitaxel) [2], 3 (Fol-firinox) [3], 4 (PEXG/PEFG) [4] different drugs over Gemcitabine monotherapy [5].
Unfortunately these treatments have yielded unsatisfactory results, with median overall sur-vival of 9–11 months for the combination chemotherapy and even less for Gemcitabine mono-therapy. The reason of these results can be partly explained by pancreatic cancer heterogeneity [6] and the poor knowledge of biological mechanisms that sustain PDAC. About the latter, despite different subtypes of variation in chromosomal structure in PDAC are known (stable, locally rearranged, scattered, unstable) [6,7] clinical implications of this classification system, for the time being, seem marginal at best. There is also a great need for reliable biomarkers to stage and assess the response to therapy of PDAC and up till now Carbohydrate Antigen 19–9 (CA19-9) is the only prognostic biomarker approved by FDA but it has limitations [8,9].
Moreover, it should be taken into account that tumour tissue samples often lack due to the anatomical difficulty to reach the primary tumour site or the critical patients’ clinical condi-tions that impede to carry out invasive and repeated biopsies in order to monitor disease development.
decision to publish, or preparation of the manuscript.
Competing interests: The authors have declared
that no competing interests exist.
Abbreviations: 95%CI, 95% Confidence Interval;
CT, Computerised Tomography; D-MMR/P-MMR, MisMatch Repair proteins expression—Defective or Proficient; ECOG PS, Eastern Cooperative Oncology Group Performance Status; EMT, Epithelial-to-mesenchymal transition; GI, GastroIntestinal; HR, Hazard Ratio; LAPC, Locally Advanced Pancreatic Cancer; MSI-H/MSI-L, MicroSatellite Instability—High or Low; OS, Overall Survival; PDAC, Pancreatic Ductal AdenoCarcinoma; PEXG, Cisplatin + Epirubicin + Capecitabine + Gemcitabine; PFS, Progression Free Survival; RECIST, Response Evaluation Criteria In Solid Tumours; RR, Response Rate.
Recently the research of biomarkers moved its attention on exosomes since their content (DNA, RNA and proteins) reflect in a dynamic way the content of cell that bud them [10–12], that is, it is not constant but reflects the status of the cell of origin.
Exosomes are vescicles secreted in the extracellular matrix and that interact with cells that absorb them, thus representing a mechanism for the paracrine-autocrine regulation in both normal and tumoural cells. Those released from cancer cells regulate microenvironment, angiogenesis and immune response [13].
By isolating exosomes from body fluids it is possible to carry out liquid biopsy, a promising and minimally invasive alternative to surgical biopsies that allows the detection of cancer bio-markers. Nowadays, molecules contained in exosomes are being evaluated to discover poten-tial biomarkers and thus, should exosomes reliably reflect the behaviour of the disease, they might offer an interesting tool to perform reproducible and relatively rapid assessments of the current status of the tumour.
In this work we measured different populations of exosomes in plasma of PDAC patients and looked for correlation with clinical variables. For example, with exosome CD133 popula-tion we mean the amount of plasma exosomes carrying CD133 protein.
2. Materials and methods
2.1 Patients
Patients candidate to be enrolled in the analysis were those with a histologically/cytologically confirmed diagnosis of metastatic/locally advanced PDAC who were candidate to receive 1st line palliative chemotherapy (either Gemcitabine+Nab-Paclitaxel, FOLFIRINOX or Gemcita-bine monochemotherapy). Patients should have received a staging chest/abdomen CT scan no longer than 4 weeks since the start of chemotherapy. Patients who had previously received sur-gery for the primary tumour were admitted as well as patients who had received adjuvant che-motherapy if more than 6 months had passed since the last cycle of adjuvant cheche-motherapy and the diagnosis or disease relapse.
All patients were treated until disease progression (as per standard guidelines), with dose-reductions/chemotherapy maintenance by investigator’s choice. Patients were evaluated by RECIST 1.1 criteria as for radiological responses to treatment, scheduled at approximately 3 months (12 weeks) after the start of 1stline chemotherapy and then every 3 months thereafter. For the means of this analysis we collected data concerning progression free survival (PFS) (defined as the time between the 1stcycle of chemotherapy and the time of the first radiological progression or lost-at-follow-up-visit or death, whichever came first) and overall survival (OS) (defined as the time between the 1stcycle of chemotherapy and patient’s death or lost-at-fol-low-up visit).
A written informed consent (that can be found inS1 File) was signed/subscribed by all patients that were enrolled in the study. This research was read, approved and signed by the local ethical committee of our hospital.
2.2 Blood sample collection
Blood samples were taken before chemotherapy treatment (T0) and after three months (T3). EDTA plasma was separated from blood cells by centrifugation at 1100g for 20 minutes at room temperature (RT). Supernatant was again centrifuged at 10000 g at 4˚C for 7 minutes to eliminate microvesicles. Finally, plasma samples from each patient were stored at -80˚C until use. In order to test different conditions for the optimum/best sample preservation we used Protease Inhibitor Cocktail (P8340 Sigma-Aldrich), 10μl in 1ml of plasma.
2.3 Antibodies
The following primary and secondary antibodies were used for exosome characterization by ELISA. Mouse monoclonal antibodies anti-human CD9 (cat. 555370), CD81 (cat. 555675), CD24 (cat. 555426), Caveolin 1 (cat. 610407) and Fibronectin (cat. 610077) were purchased from BD Biosciences, USA. Mouse monoclonal antibody anti-human TSPAN8 (cat.
WH0007103M2) was purchased from Sigma-Aldrich (Milano, Italy). Mouse monoclonal anti-bodies anti-human CD133 (cat. MAB11331), PD-L1 (cat. MAB1561), CXCR4 (cat. MAB172), EpCAM (cat. MAB9601), Integrinα6 (cat. MAB1350), Integrin β4 (cat. MAB4060), CD44s (cat. MAB7045) and CD44v6 (cat. BBA13) was purchased from R&D System, Minneapolis, USA. Mouse monoclonal antibodies anti-human CD151 (cat. 271216) and Alix (cat. 53540) were purchased from Santa Cruz Biotechnology. Rab5b polyclonal rabbit antibody anti-human (cat. HBM-RAB5-PR1, Hansa BioMed Life Sciences Ltd and cat. 598, Santa Cruz Bio-technology) was used for plate coating. Goat anti-mouse biotin conjugated antibody (cat. A16076, Thermo Fisher Scientific) was used as secondary antibody. Streptavidin Poly-HRP (cat. 21140, Thermo Fisher Scientific) is used to amplify the signal.
2.4 ELISA protocol
Transparent Nunc MaxiSorp flat bottom 96-well plates (cat. 439454, Thermo Fisher Scientific) with high protein-binding capacity (600–650 ng IgG/cm2) were used for the ELISA.
200μl of 4μg/ml anti-Rab5b in coating buffer sodium carbonate buffer (pH 8.5) are placed in each well and incubated overnight at 4˚C. Afterwards the wells were washed 3 times with PBST (0.1% Tween 20 in 1 X PBS). Blocking procedure was performed by 1% of Bovine Serum Albumine (BSA) protease and fatty acid free (cat. A7030, Sigma Aldrich) in PBS for 90 minutes at RT under shaking. After washing in PBST, 100μl plasma were incubated 2h at 37˚C and then overnight at 4˚C. After washing in PBST, 100μl of 1 μg/ml of primary antibodies was incubated for 3 hours at RT. After washing, 100μl of 50 ng/ml of secondary antibody was incu-bated for 45 minutes at RT. After washing, 100μl of 50 ng/m of Streptavidin Poly-HRP was incubated for 45 minutes at RT. Dilution buffer for all antibodies was PBS with 300 mM of NaCl, 0.05% Tween 20, 0.5% BSA. Note that the use of 300 mM of NaCl instead of 150mM resulted in an increased in specificity. The substrate solution 1-Step Ultra TMB-ELISA (cat. 34028, Thermo Fisher Scientific) was added for 20 minutes at RT under shaking and the reac-tion was stopped by 2N H2SO4. Optical densities were recorded at 450 nm by Multiskan FC
Microplate Photometer (Thermo Fisher Scientific). Washings were done by Wellwash Versa Microplate Washer (Thermo Fisher Scientific) to assure intra-assay repeatability and incuba-tions were done in dark condiincuba-tions. To the success of the assay it is important that all buffers are freshly prepared. To adjust our protocol we used lyophilized exosomes from plasma of healthy donors (cat. HBM-PEP-100/4, HansaBioMed Life Sciences Ltd, Tallin, Estonia).
For each plate and for each kind of antibody the absorbance value of the sample (signal) was divided by the absorbance of the blank (noise) to obtain a normalized value. Blank is obtained testing PBS instead of plasma.
2.5 Statistical analysis
Survival analysis was conducted by Kaplan-Meier method whereas different survival outcomes among different strata were estimated by log-rank test. Multivariate analysis was conducted by cox-regression analysis.
Association among categorical variables were performed by Fisher exact test for binomial variables and Chi-square test for all other instances. For all tests level of statistical significance (alpha) was set at 0.05.
To identify different groups of patients based on their exosomes’ concentration, categorical tests (hierarchical clustering analysis and K-means analysis) were used.
All statistical analysis concerning survival and correlation between categorical variables were performed by using MedCalc Statistical Software version 14.10.2 (MedCalc Software bvba, Ostend, Belgium;http://www.medcalc.org; 2014), whereas K-means analysis and hierar-chical clustering analysis were performed by using R software for Windows (3.4.2 version).
3. Results
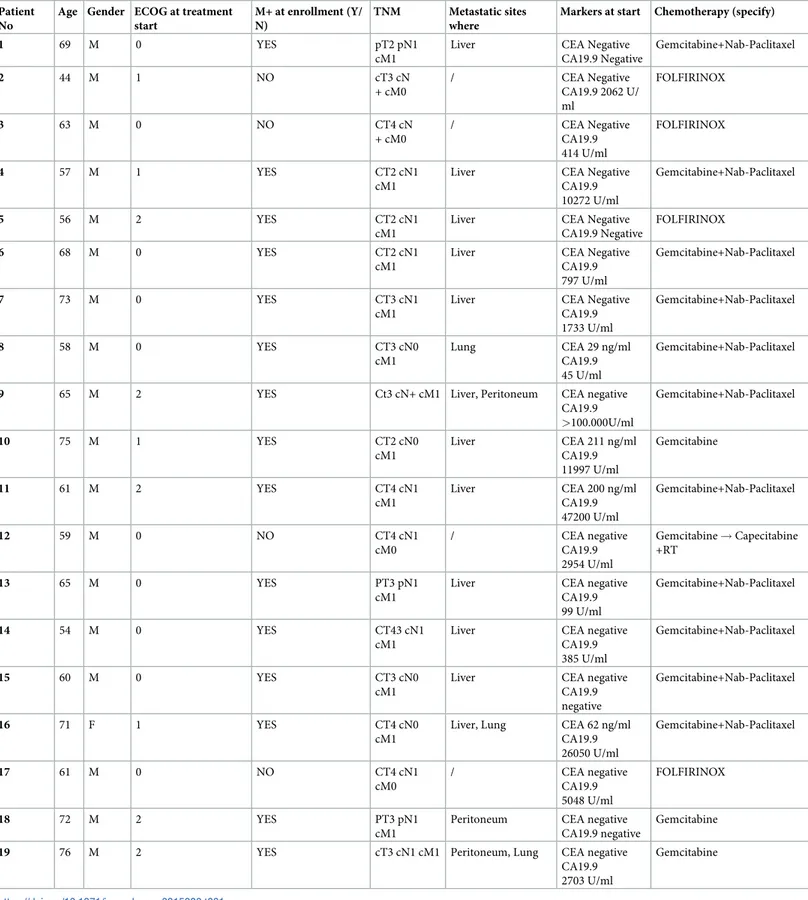
Nineteen patients were eligibible for enrollment and partecipated to our study. Patients’ clini-cal characteristics can be found inTable 1.
In particular, in the enrolled population, 15 (79%) had metastatic disease at the time of enrolment whereas the remaining 4 (21%) patients had an unresectable locally advanced pan-creatic cancer. 11 (58%) patients received 1stline chemotherapy with Gemcitabine+Nab-Pacli-taxel, 4 (21%) received FOLFIRINOX and the remaining 4 (21%) patients were treated with Gemcitabine monotherapy.
Most of patients had ECOG:0 status at the time of enrolment (10/19, 50%) and the primary site of metastatic involvement was the liver (10 patients had the liver as the only site of meta-static involvement). Only 3 (16%) patients had received surgery with radical intent on the pri-mary tumour and subsequently relapsed.
While all patients who were enrolled in the analysis received first line chemotherapy, only 12 (63%) received 2ndline therapy and an additional 3 (16%) patients also received 3rdline treatment.
During the follow-up period ALL patients did experience disease progression whereas 15 (79%) patients have died.
3.1 Overall population survival analysis
Among our patients, none patient experienced complete response, 8 (42%) partial response, 3 (16%) disease stabilisation, 4 (21%) disease progression due to the occurrence of new meta-static sites (whereas the primary tumour and the pre-existing metameta-static sites remained stable or even in partial response) and the remaining 4 (21%) experienced disease progression in metastatic sites of involvement that were already known at the beginning of the observation.
In the group of patients with proper metastatic involvement (15/19), 6 (42%) achieved par-tial response, 2 (14%) achieved stable disease, 3 (21%) progressed due to the occurrence of other metastatic sites of involvement and the remaining 4 (21%) experienced disease progres-sion in sites of metastatic involvement that were already known at the time of enrolment.
Median overall survival was 8.74 months and median progression free survival was 3.80 months.
Looking at stratification factors that might have influenced progression free survival and overall survival:
ECOG performance status was found to be a factor associated with worse progression free survival (mPFS respectively among 0-1-2 of 6.29 vs 3.01 vs 0.56 months, p = 0.0137) and with worse overall survival (mOS respectively 12.13 vs 5.80 vs 3.47 months, p<0.0001). ECOG was not associated with disease response/stabilisation/progression (p = 0.16).
Patients that received surgery for the primary tumour were not found to be associated with different progression free survival (p = 0.69), overall survival (p = 0.74) and disease response/ stabilisation/progression (p = 0.56).
Type of chemotherapy used (Gemcitabine vs Gemcitabine+Nab-Paclitaxel vs FOLFIRI-NOX) was not associated with a statistically significant difference in terms of mPFS (p = 0.55)
Table 1. Patients clinical characteristics. Patient
No
Age Gender ECOG at treatment start
M+ at enrollment (Y/ N)
TNM Metastatic sites where
Markers at start Chemotherapy (specify)
1 69 M 0 YES pT2 pN1
cM1
Liver CEA Negative
CA19.9 Negative Gemcitabine+Nab-Paclitaxel 2 44 M 1 NO cT3 cN + cM0 / CEA Negative CA19.9 2062 U/ ml FOLFIRINOX 3 63 M 0 NO CT4 cN + cM0 / CEA Negative CA19.9 414 U/ml FOLFIRINOX 4 57 M 1 YES CT2 cN1 cM1
Liver CEA Negative
CA19.9 10272 U/ml
Gemcitabine+Nab-Paclitaxel
5 56 M 2 YES CT2 cN1
cM1
Liver CEA Negative
CA19.9 Negative
FOLFIRINOX
6 68 M 0 YES CT2 cN1
cM1
Liver CEA Negative
CA19.9 797 U/ml
Gemcitabine+Nab-Paclitaxel
7 73 M 0 YES CT3 cN1
cM1
Liver CEA Negative
CA19.9 1733 U/ml Gemcitabine+Nab-Paclitaxel 8 58 M 0 YES CT3 cN0 cM1 Lung CEA 29 ng/ml CA19.9 45 U/ml Gemcitabine+Nab-Paclitaxel
9 65 M 2 YES Ct3 cN+ cM1 Liver, Peritoneum CEA negative
CA19.9 >100.000U/ml Gemcitabine+Nab-Paclitaxel 10 75 M 1 YES CT2 cN0 cM1 Liver CEA 211 ng/ml CA19.9 11997 U/ml Gemcitabine 11 61 M 2 YES CT4 cN1 cM1 Liver CEA 200 ng/ml CA19.9 47200 U/ml Gemcitabine+Nab-Paclitaxel 12 59 M 0 NO CT4 cN1 cM0 / CEA negative CA19.9 2954 U/ml Gemcitabine ! Capecitabine +RT 13 65 M 0 YES PT3 pN1 cM1
Liver CEA negative
CA19.9 99 U/ml
Gemcitabine+Nab-Paclitaxel
14 54 M 0 YES CT43 cN1
cM1
Liver CEA negative
CA19.9 385 U/ml
Gemcitabine+Nab-Paclitaxel
15 60 M 0 YES CT3 cN0
cM1
Liver CEA negative
CA19.9 negative
Gemcitabine+Nab-Paclitaxel
16 71 F 1 YES CT4 cN0
cM1
Liver, Lung CEA 62 ng/ml
CA19.9 26050 U/ml Gemcitabine+Nab-Paclitaxel 17 61 M 0 NO CT4 cN1 cM0 / CEA negative CA19.9 5048 U/ml FOLFIRINOX 18 72 M 2 YES PT3 pN1 cM1
Peritoneum CEA negative
CA19.9 negative
Gemcitabine
19 76 M 2 YES cT3 cN1 cM1 Peritoneum, Lung CEA negative
CA19.9 2703 U/ml
Gemcitabine
albeit patients treated with Gemcitabine+Nab-Paclitaxel experienced the longest mPFS (5.73 months). No difference in terms of overall survival was found (p = 0.47), albeit patients treated with Gemcitabine+Nab-Paclitaxel had the longest median overall survival (8.03 months). There was also no association with significantly different response rates (p = 0.32).
As it could be expected, patients who received 2ndline chemotherapy had greater overall survival compared with patients who just received only first line chemotherapy (11.04 vs 5,92 months, HR:0.25, 95%CI:0.06–1.17, p = 0.0027). This difference was evident also (albeit not statistically significant owing to the low number of patients), between those who received also 3rdline chemotherapy compared with those who received only first line treatment (16.45 vs 6.98, HR:0.46, 95%CI:0.14–1.47, p = 0.19).
We did not find any differences in terms of median progression free survival times between patients with high values of CA19.9 vs those who did have negative values of CA19.9 (despite having metastatic disease) (p = 0.34). Overall survival was also not significantly different (p = 0.75) as well as different profile of response (p = 0.43).
3.2 Exosome analysis
Blood samples were collected from PDAC patients before (T0) and three months (T3) after chemotherapy treatments. Through our ELISA assay we measured levels of different exosome populations, in particular those carrying the ubiquitous CD9, CD81 and some markers already found in tumour exosomes of pancreatic cancer such as CD44v6, Tspan8, EpCAM, CD24, CXCR4, Integrinsα6 and β4, CD133.
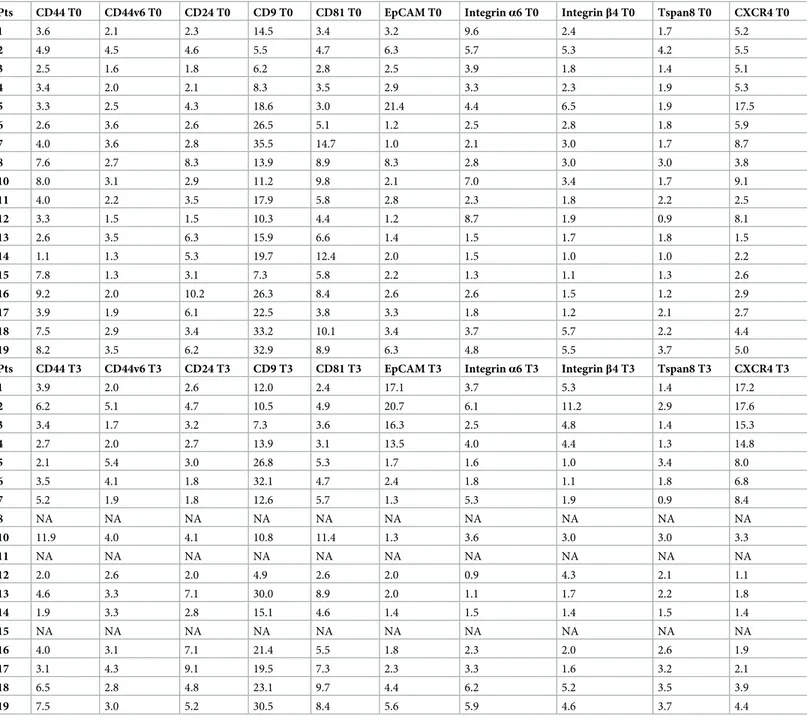
During the phase of protocol optimization, we assured that the storage of plasma at -80˚C minimally affect the measures, in particular, results of stored sample were smaller than the fresh samples within 10%. The addition of protease inhibitors to plasma before storing did not restore the values. However, since the lowering of the signal was slight (<10%) we stored the samples without protease inhibitors. The absorbance values were multiplied by 1000 and suc-cessively normalized dividing each sample values with the blank value. Results are reported in theTable 2. Since CD151, Caveolin-1, PD-L1, Alix, CD133 and Fibronectin antibodies were not used for all enrolled patients, correlations of their levels and clinical features were carried out only for CD9, CD81, EpCAM, Integrinα6, Integrin β4, CD44s, CD44v6, CXCR4, Tspan8 and C24.
In 18/19 (94%) patients the blood sample that was collected at timepoint 0 (baseline) yielded meaningful results in terms of exosomes evaluation. Only in 15/19 (80%) patients we were able to perform the blood sample after 3 months of treatment. In one patient, due to early disease progression (and death), it was not possible to repeat blood sample collection and sub-sequent analysis. In 3 additional patients it was not performed blood sample collection after 3 months (due to early progression and subsequent loss at follow-up).
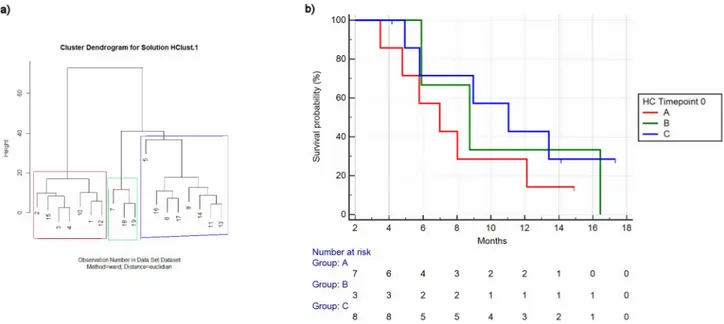
We performed hierarchical clustering analysis on sample T0 by using as stratifying factors the expression values of examined proteins (CD9, CD81, EpCAM, Integrinα6, Integrin β4, CD44, CD44v6, CXCR4, TSPAN8) and we observed three different clusters (Fig 1a).
K-means analysis (K = 3 means 3 different clusters) identified as main determinants of dif-ferent allocation among the three groups the difdif-ferent expression of CD9 and CD81 for one group whereas the other group allocation was influenced by EpCAM and CXCR4 expression (with Integrinα6 and β4 having a minor role). Different expression of CD44, CD24, CD44v6, TSPAN8 did not influence allocation among three different groups. (Fig 2a).
The same results were obtained when performing hierarchical clustering analysis at T3 (Fig 3a).
K-means analysis (K = 3) revealed that CD9 and CD81 were associated with one group, expression of EpCAM, CXCR4 with another group and Integrinα6 and Integrin β4 were mar-ginally associated (Fig 2b).
Then we performed three different analyses as to identify the correlation between exosome expression and different patient outcomes:
The first analysis was conducted by stratifying patients on the basis of CD81, CD9, EpCAM and CXCR4, as they were proven to be associated with different clusters by K-means analyses. Median concentration of the selected marker was used as cut-off point.
Table 2. Results of exosomes’ protein evaluation respectively for T0 (baseline) and T3 (after 3 months of treatment).
Pts CD44 T0 CD44v6 T0 CD24 T0 CD9 T0 CD81 T0 EpCAM T0 Integrinα6 T0 Integrinβ4 T0 Tspan8 T0 CXCR4 T0
1 3.6 2.1 2.3 14.5 3.4 3.2 9.6 2.4 1.7 5.2 2 4.9 4.5 4.6 5.5 4.7 6.3 5.7 5.3 4.2 5.5 3 2.5 1.6 1.8 6.2 2.8 2.5 3.9 1.8 1.4 5.1 4 3.4 2.0 2.1 8.3 3.5 2.9 3.3 2.3 1.9 5.3 5 3.3 2.5 4.3 18.6 3.0 21.4 4.4 6.5 1.9 17.5 6 2.6 3.6 2.6 26.5 5.1 1.2 2.5 2.8 1.8 5.9 7 4.0 3.6 2.8 35.5 14.7 1.0 2.1 3.0 1.7 8.7 8 7.6 2.7 8.3 13.9 8.9 8.3 2.8 3.0 3.0 3.8 10 8.0 3.1 2.9 11.2 9.8 2.1 7.0 3.4 1.7 9.1 11 4.0 2.2 3.5 17.9 5.8 2.8 2.3 1.8 2.2 2.5 12 3.3 1.5 1.5 10.3 4.4 1.2 8.7 1.9 0.9 8.1 13 2.6 3.5 6.3 15.9 6.6 1.4 1.5 1.7 1.8 1.5 14 1.1 1.3 5.3 19.7 12.4 2.0 1.5 1.0 1.0 2.2 15 7.8 1.3 3.1 7.3 5.8 2.2 1.3 1.1 1.3 2.6 16 9.2 2.0 10.2 26.3 8.4 2.6 2.6 1.5 1.2 2.9 17 3.9 1.9 6.1 22.5 3.8 3.3 1.8 1.2 2.1 2.7 18 7.5 2.9 3.4 33.2 10.1 3.4 3.7 5.7 2.2 4.4 19 8.2 3.5 6.2 32.9 8.9 6.3 4.8 5.5 3.7 5.0
Pts CD44 T3 CD44v6 T3 CD24 T3 CD9 T3 CD81 T3 EpCAM T3 Integrinα6 T3 Integrinβ4 T3 Tspan8 T3 CXCR4 T3
1 3.9 2.0 2.6 12.0 2.4 17.1 3.7 5.3 1.4 17.2 2 6.2 5.1 4.7 10.5 4.9 20.7 6.1 11.2 2.9 17.6 3 3.4 1.7 3.2 7.3 3.6 16.3 2.5 4.8 1.4 15.3 4 2.7 2.0 2.7 13.9 3.1 13.5 4.0 4.4 1.3 14.8 5 2.1 5.4 3.0 26.8 5.3 1.7 1.6 1.0 3.4 8.0 6 3.5 4.1 1.8 32.1 4.7 2.4 1.8 1.1 1.8 6.8 7 5.2 1.9 1.8 12.6 5.7 1.3 5.3 1.9 0.9 8.4 8 NA NA NA NA NA NA NA NA NA NA 10 11.9 4.0 4.1 10.8 11.4 1.3 3.6 3.0 3.0 3.3 11 NA NA NA NA NA NA NA NA NA NA 12 2.0 2.6 2.0 4.9 2.6 2.0 0.9 4.3 2.1 1.1 13 4.6 3.3 7.1 30.0 8.9 2.0 1.1 1.7 2.2 1.8 14 1.9 3.3 2.8 15.1 4.6 1.4 1.5 1.4 1.5 1.4 15 NA NA NA NA NA NA NA NA NA NA 16 4.0 3.1 7.1 21.4 5.5 1.8 2.3 2.0 2.6 1.9 17 3.1 4.3 9.1 19.5 7.3 2.3 3.3 1.6 3.2 2.1 18 6.5 2.8 4.8 23.1 9.7 4.4 6.2 5.2 3.5 3.9 19 7.5 3.0 5.2 30.5 8.4 5.6 5.9 4.6 3.7 4.4
NA: Not applicable (as in missing value) https://doi.org/10.1371/journal.pone.0215990.t002
We analysed the correlation between 1stline progression free survival (PFS) and EpCAM exosome levels at T0 and we observed a statistically significant correlation with worse PFS. In particular, patients having high EpCAM exosome expression had median PFS of 3.18 vs 7.31 months of patients having lower EpCAM levels (HR:2.82, 95%CI:1.03–7.73, p = 0.01).
In the same way, overall survival was also significantly shorter for patients having higher Epcam exosome levels(5.83 vs 16.45 months, HR:6.16, 95%CI:1.93–19.58, p = 0.0001) (Fig 4a).
There was also a statistically significant association with increased EpCAM exosome expres-sion and lower response rate, with patients having high levels of EpCAM having 20% response rate vs 87% response rate of the low EpCAM levels group (p = 0.015).
Fig 1. Hierarchical clustering for timepoint 0 (Numbers refer to patients as perTable 1) (a) and relative overall survival among clusters (b).
https://doi.org/10.1371/journal.pone.0215990.g001
Fig 2. K-means (K = 3) for different exosomes’ proteins expression at timepoints 0 (a) and 3 (b).
Same trend, but not statistically significant, was observed when the same analyses were per-formed at T3. In particular, worse overall survival (mOS respectively 8.75 vs 11.04 months, HR: 1.10, 95%CI:0.34–3.60, p = 0.86) (Fig 4b) and shorter PFS (mPFS respectively 3.80 vs 5.73 months, HR:1.38, 95%CI:’0.43–4.39, p = 0.53) were seen for patients having higher EpCAM T3 levels. Response rates were respectively 33% vs 67% for high vs low EpCAM T3 levels. This dif-ference was not statistically significant (p = 0.31).
CXCR4 expression at T0 was not associated with differences in terms of overall survival (higher than median cut-off vs low, mOS respectively 8.95 vs 6.98, HR:1.02, 95%CI:0.35–2.95,
Fig 3. Hierarchical Clustering for timepoint 3 (Numbers refer to patients as perTable 1) (a) and relative overall survival analysis for different clusters (b).
https://doi.org/10.1371/journal.pone.0215990.g003
Fig 4. a. Overall survival stratified by high/low levels of Epcam exosome expression (timepoint 0). mOS respectively 5.83 vs 16.45 months, HR:6.16, 95%CI:1.93–19.58,
p = 0.0001). b. Overall survival stratified by high/low levels of Epcam exosome expression (timepoint 3). mOS for high vs low respectively 8.75 vs 11.04 months, HR:1.10, 95%CI:0.34–3.60, p = 0.86.
p = 0.96), progression free survival (mPFS respectively 6.29 vs 3.21, HR:0.42, 95%CI:0.14–1.23, p = 0.05) and response rates were 50% vs 50% for high vs low (p = 1). CXCR4 expression at T3 was also not associated with differences in terms of overall survival (high vs low, mOS respec-tively 8.03 vs 8.95, HR:1.93, 95%CI:0.61–6.08, p = 0.24), progression free survival (6.29 vs 3.23 months, HR:0.70, 95%CI:024–2.04, p = 0.49) and response rates (50% vs 50%, p = 1).
CD9 expression at T0 was also not associated with differences in terms of overall survival (high vs low, mOS respectively 8.75 vs 8.03 months, HR:1.31, 95%CI:0.45–3.79, p = 0.62), pro-gression free survival (3.21 vs 6.16 months, HR:1.31, 95%CI:0.50–3.40, p = 0.56) and response rates (50% vs 50%, p = 1).
Finally, CD81 expression at T0 was not associated with differences in terms of overall sur-vival (high vs low, mOS respectively 8.95 vs 8.03 months, HR:0.81, 95%CI:0.28–2.34, p = 0.70), progression free survival (5.78 vs 3.80 months, HR:1.18, 95%CI:0.46–3.07, p = 0.70) and response rates (66% vs 33% for high vs low respectively, p = 0.34).
The second analysis aimed at assessing whether patients identified as belonging to different clusters as indicated by hierarchical clustering at T0 and T3 showed different survival outcomes.
As per patients identified by hierarchical clustering analysis at T0, a trend towards different overall survival was seen (mOS respectively 6.98 vs 8.75 vs 11.04 months) albeit it was not sta-tistically significant (p = 0.46) (Fig 1b). When the analysis was conducted on patients stratified by the results of hierarchical clustering analysis at T3, a more evident difference among the overall survival curves was seen (mOS respectively 5.77 vs 11.04 vs 8.75 months) but still, the difference was not statistically significant (p = 0.14) (Fig 3b).
The third analysis was conducted to identify whether patient outcomes can be predicted on the basis of increased or decreased levels of exosomal proteins between T0 and T3. Percentages of the changes in the time lapse from T0 and T3 were calculated.
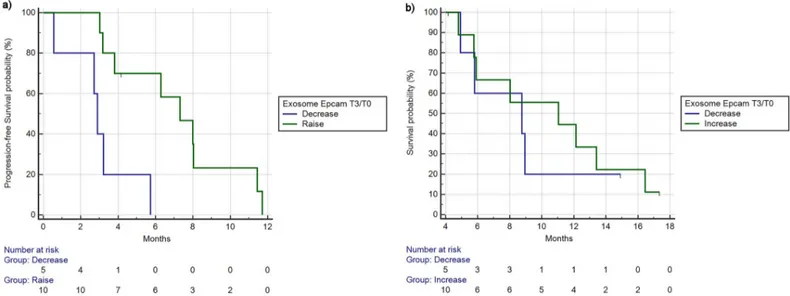
EpCAM increased levels during treatments resulted to be significantly associated with bet-ter PFS (mPFS 2.88 vs 7.31 months, HR:0.24, 95%CI:0.04–1.22, p = 0.003) (Fig 5a) and with better, but not statistically significant, OS (8.75 vs 11.04 months, HR:0.77, 95%CI:0.21–2.73, p = 0.66) (Fig 5b). Finally, response rates in the group of patients who experienced an increase in EpCAM levels were 60% vs 20% of the group of patients with decrease of EpCAM levels, albeit this difference was not statistically significant (p = 0.28).
Fig 5. Progression free survival (a) and overall survival (b) based on changes from timepoint 3 and 0 of exosome Epcam levels (reduction/increase as % from timepoint 0 to timepoint 3). a) mPFS 2.88 vs 7.31 months, HR:0.24, 95%CI:0.04–1.22, p = 0.003). b) mOS 8.75 vs 11.04 months, HR:0.77, 95%CI:0.21–2.73, p = 0.66).
3.3 Associations between exosome analyses and clinical factors
The ECOG scale of Performance Status (PS) is the strongest clinical factor as it can influence patient outcomes at the end of the therapy and overall patients’ compliance to treatment. Therefore, we assessed whether correlation with worse PS (and thus greater tumour load) could be found with different levels of those exosomal proteins resulted to stratify patients in different clusters after hierarchical cluster analysis: EpCAM, CXCR4, CD81 and CD9.
EpCAM T0 levels were correlated with worse PS. In particular, in 10 asymptomatic patients (ECOG PS:0), 7/10 (70%) had EpCAM T0 values lower than median compared with 3/10 (30%) who had high EpCAM T0 values. In 8 symptomatic (ECOG PS:1–2) patients, EpCAM T0 levels were higher than median in 7/8 (87%) vs 1/8 (13%) where low EpCAM levels were seen. This difference was statistically significant (p = 0.02 at Fisher exact test).
CXCR4 T0 levels were not correlated with different PS. In 10 ECOG PS:0 patients, 5 (50%) had high levels of CXCR4 while the remaining 5 (50%) had low levels of CXCR4. Conversely, in 8 ECOG PS:1–2 patients, 5/8 (62%) had high CXCR4 levels whereas the remaining 3/8 (38%) had low levels of CXCR4. This difference was not statistically significant (p = 0.66).
CD81 T0 levels were not correlated with different PS. In 10 ECOG PS:0 patients, 6 (60%) had low levels of CD81 whereas the remaining 4 (40%) had high levels of CD81. On the other hand, in 8 ECOG PS:1–2 patients, 3/8 (37%) had low CD81 levels whereas 5/8 (63%) had high CD81 levels. This difference was not statistically significant (p = 0.63).
CD9 T0 levels were not correlated with different PS. In 10 asymptomatic patients, 5 (50%) had low and 5 (50%) had high levels of CD9. In 8 ECOG PS:1–2 patients, 5/8 (62%) had high levels of CD9 vs 3/8 (38%) where CD9 levels were lower than median. This difference was not statistically significant (p = 0.66).
We did not find any association between different baseline CA19.9 and carcinoembryonic antigen (CEA) levels and different levels of expression of EpCAM, CXCR4, CD81 and CD9. The majority of patients was diagnosed with liver metastases but we did not find any statisti-cally significant association between EpCAM, CXCR4, CD81 and CD9 levels and the pres-ence/absence of liver metastases.
We did not demonstrate a statistically significant correlation between EpCAM changes dur-ing first line therapy and outcome in 2ndline therapy. However, there was a trend towards worse 2ndline PFS in patients who had an increase in EpCAM levels during 1stline therapy (mPFS respectively 1.57 vs 2.62 months, HR:2.01, 95%CI:0.53–7.62, p = 0.30) and there was also a trend towards worse 2ndline OS in patients who had an increase in EpCAM levels during 1stline therapy (mOS respectively 2.23 vs 5.24 months, HR:1.85, 95%CI:0.49–6.94, p = 0.36).
Finally, when we performed multivariate analysis by using in the model all those variables who resulted to be significantly related to differences in PFS (ECOG PS, baseline EpCAM, changes in EpCAM levels from T0-T3), all variables maintained their statistical significance (respectively 0.0261, 0.0027, 0.0259). The factor that resulted to be mostly associated with dif-ferences in terms of outcome was the change in EpCAM levels between T0-T3 (Exp(B):14.28 for decrease vs increase), followed by high baseline levels of EpCAM (Exp(B):5.74) and then by ECOG PS (Exp(B):5.28).
4. Discussion
Patients with metastatic or locally advanced PDAC exhibit high heterogeneity in clinical behaviour, therefore the identification of prognostic biomarkers might be helpful for the choice of palliative treatments.
ASCO, ESMO and AIOM guidelines suggest that patient’s PS and age might help clinicians in choosing which kind of palliative treatment should be offered to these patients among
Gemcitabine monochemotherapy, combination therapy with Gemcitabine+Nab-Paclitaxel, FOLFIRINOX or best supportive care.
However, ECOG PS is a relatively subjective form of assesment and it might deteriorate rather quickly during the course of the disease, thus reducing its reproducibility. Furthermore, age is not such a strong indicator of poor survival as it is correlated with increased toxicity (rather than lack of effectiveness) from different types of treatments.
Radiological assesment in pancreatic cancer is rarely fully informative, due to the frequent over or underestimation of the real size of the primary tumour due to the intrinsic limit of standard CT scan in defining differences in density between tumour tissue and the surround-ing pancreatic tissue (that is quite frequently involved by a fibrotic process due to concomitant history of chronic pancreatitis) [14,15].
Widely used tumour serum markers, such as CA19-9 or CEA, lack sensitivity and specificity since their levels are often normal in PDAC early stages or are falsely high in individuals with other pathological conditions (due to concomitant obstruction of the intrahepatic bile ducts caused by tumours located in the pancreatic head, usually associated with jaundice and high bilirubin levels) [16].
For these reasons the research of alternative biomarkers that could be non-invasively assessed is gaining great interest. Body fluids are enriched in exosomes, which carry on their membrane specific proteins that allow distinguishing those exosomes derived from different populations of cancer cells.
In our work, we analysed plasma samples from PDAC patients, with the aim of finding a cor-relation between different kinds of exosomes and patient clinical data that might be informative as prognostic and diagnostic tools. We evaluated, through our ELISA assay, the relative quanti-ties of exosome tumor markers in enrolled patients before and after chemotherapy treatments.
Our results suggest that quantification of EpCAM levels from blood-derived exosomes might have a reliable role as prognostic factor. Highest EpCAM T0 levels were seen in patients with poor performance status and they were associated with worse PFS and OS. Conversely, in patients where we observed an increase in EpCAM levels during treatment it was observed bet-ter PFS and OS. All these factors maintaned their impact on prognosis afbet-ter multivariate analy-sis and in particular, the strongest factor that was associated with worse/better prognoanaly-sis was the change in EpCAM levels during treatment.
EpCAM (Epithelial cell adesion molecule) is a glycoprotein involved in cell-signaling, migration, proliferation and homotypic cell-cell adhesion in epithelia. It has been found almost exclusively in epithelia and in epithelial-derived neoplasms and thus it has been sug-gested as potential diagnostic marker for breast cancer, colorectal cancer and squamous cervical cancer[17–19]. EpCAM is a known marker of cancer stem cells in pancreatic, liver, colorectal and breast cancers [20]. EpCAM, together with CD44v6, has been shown to have an increased expression in Panc1 cancer stem-like cells. Recently, a proteomic analysis of exoso-mal membrane has revealed that EpCAM is one of the PDAC biomarker candidates, together with CD151, in liquid biopsies from patients [21]. Interestingly, EpCAM, together with Tspan8 and CD44v6, resulted to be one of the surface proteins found to be specifically expressed in exosomes isolated from serum samples of PDAC patients and not from healthy donors [22]. It has also been suggested that this molecule might also have a role in some cancer types (mainly those arising from the GI tract such as pancreatic, colon, gastric cancer) by silencing MSH2 gene due to processes of hypermethylation and thus causing a peculiar pheno-type that is associated with altered microsatellite instability [23]. This finding might be of potential therapeutic indication as it would enable drugs such as Nivolumab or Pembrolizu-mab (that have been demonstrated to be active in tumours who are MSI-H) to work also in tumours that are EpCAM “impaired” or defective.
Contrary to our results, previous study has detected circulating EpCAM in all serum frac-tion collected from PDAC patients but it did not result a sensitive tool able to distinguish patients from healthy donors [24]. Moreover, increased levels of EpCAM mRNA extracted from circulating tumor cells, in PDAC patients after pancreatectomy, did not correlated with worse prognosis [25]. It should be noted that these results are not referred to the exosomal fraction of blood samples and this could explain the inconsistency with our results.
Our findings would suggest that EpCAM expression in circulating exosomes can have a potentially useful prognostic role. Looking at the results of the analysis it would seem that, albeit high levels of EpCAM at baseline should be correlated with worse prognosis, in those patients where actually an increase in EpCAM is found (starting from baseline up to 3rd month of treatment), there is actually a better prognosis.
Although the negative prognostic role of high EpCAM baseline levels can partly be
explained by greater tumour burden and corresponding worse performance status at diagnosis of the patients that were enrolled, it remains to be explained why, particularly in those patients who experienced partial response or disease stabilisation (and thus who benefited the most from palliative chemotherapy and that would have had less tumour burden after treatment), the INCREASE in exosomal EpCAM is associated with better survival outcomes. This is even more crucial if we consider that at multivariate analysis,it resulted to be the factor that was more strongly associated with better survival outcomes.
There might be 2 potential explanations of this findings, one from a statistical point of view and another from a biological point of view:
As for the statistical explanation of the finding, it can be expected that better survival out-comes in patients who had changes between 3rdmonth of treatment and baseline could be sim-ply related to the fact that all those patients who had a baseline blood sample and were not able to be sampled again at 3 months of treatment (due to disease progression earlier than 3 months or death) exited from the analysis BEFORE the 3rdmonth timepoint and thus, the population of patients who are able to perform both baseline and 3rdmonth sampling has in itself a better prognosis compared with the population of patients who have performed baseline sample (as in the fact that the second population also includes patients who are lost at follow-up or died). This might be particularly true for patients who have metastatic pancreatic cancer and thus might NOT have in a sizable proportion of cases life expectancy of 3 months. To further con-firm whether this proves true it would be necessary to increase the number of patients assessed and with an earlier detection of the changes in circulating exosomal EpCAM (p.e. 1-month timepoint).
From a biological point of view it is particularly intriguing the fact that better prognosis is associated with an INCREASE in EpCAM levels. Indeed, while it is known that high levels of EpCAM in epithelial cells is usually associated with an increase in proliferative activity and decrease in differentiation it is also known that cells who undergo the process of epithelial-to-mesenchymal-transition (EMT) [26] and that are usually associated with a worse clinical behaviour and less susceptibility to chemotherapy (EMT) usually have EpCAM downregula-tion [27]. It would be interesting to assess if, in patients who are actually receiving palliative chemotherapy, the presence of EpCAM in circulating exosomes would detect that number of tumours where EMT is not happening and thus suggest better prognosis for these patients. To further confirm this it would be necessary to see whether, particularly in metastatic sites of involvement, EpCAM expression is different in tumours who have a decrease in exosomal EpCAM levels vs those where an increase is seen and whether this correlates with different prognosis. However, difficulties in performing repeated biopsies in metastatic sites of pancre-atic cancer patients who are receiving palliative treatment and the heterogeneity of metastpancre-atic involvement, poses a major issue in the actual realisation of this kind of test.
Enzyme linked immunoassay (ELISA) is a commonly used method for protein detection and quantification. This method results in an elevated efficiency of recovered exosomes from complex matrices like body fluids. It is highly specific due to the antibodies that can identify one of the different proteins expressed on exosome surfaces. ELISA assay has been demon-strated to be a robust method for the detection and quantification of disease-derived exosomes in human biological samples and tumour models.
In this work, we have first optimized the ELISA protocol in order to isolate the exosome fraction from human plasma samples and to maximise the signal of plasma samples reducing the background noise. Unfortunately, the high sensitivity of this method is also a drawback, since even small difference of plate conditions could affect ELISA results.
This, together with the small number patients enrolled, is the principal limitation of our study. In conclusion, this study has provided a first approach for analysing, in plasma samples, changes of exosome levels and comparing them with the disease status of patients in order to find candidate biomarkers of PDAC and potential new therapeutic targets.
On these bases we believe that exosome analysis focused on EpCAM could prove to be potentially useful both as as prognostic factor or as a target for new treatment modalities in metastatic pancreatic cancer patients since drugs such as Edrecolomab and Catumaxomab, targeting EpCAM, are currently under investigation in a series of cancer types) [28].
Supporting information
S1 File. Informed consent.(ZIP)
S2 File. Patients’ database.
(ZIP)
Acknowledgments
This research was entirely funded thanks to AIRC IG 2014 research grant.
Author Contributions
Conceptualization: Francesco Piva, Giovanni Principato, Giorgio Santoni.
Data curation: Riccardo Giampieri, Francesco Piva, Giulia Occhipinti, Alessandro Bittoni,
Consuelo Amantini.
Formal analysis: Riccardo Giampieri.
Funding acquisition: Francesco Piva, Giovanni Principato, Stefano Cascinu.
Investigation: Riccardo Giampieri, Francesco Piva, Giulia Occhipinti, Alessandro Bittoni,
Alessandra Righetti, Silvia Pagliaretta, Alberto Murrone, Francesca Bianchi, Consuelo Amantini, Matteo Giulietti.
Methodology: Francesco Piva, Alessandra Righetti, Silvia Pagliaretta, Alberto Murrone,
Con-suelo Amantini, Matteo Giulietti.
Project administration: Riccardo Giampieri, Consuelo Amantini, Giulia Ricci, Rossana
Berardi, Stefano Cascinu.
Resources: Francesco Piva, Giulia Occhipinti, Francesca Bianchi, Giulia Ricci. Software: Riccardo Giampieri.
Supervision: Francesca Bianchi, Giovanni Principato, Giorgio Santoni, Rossana Berardi,
Ste-fano Cascinu.
Writing – original draft: Riccardo Giampieri, Giulia Occhipinti, Rossana Berardi, Stefano
Cascinu.
References
1. Vincent A, Herman J, Schulick R, Hruban RH, Goggins M. Pancreatic Cancer. Lancet. 2011 Aug 13; 378(9791):607–20.https://doi.org/10.1016/S0140-6736(10)62307-0PMID:21620466
2. Von Hoff DD, Ervin T, Arena FP, Chiorean EG, Infante J, Moore M, et al. Increased survival in pancre-atic cancer with nab-paclitaxel plus gemcitabine. N Engl J Med. 2013 Oct 31; 369(18):1691–703. https://doi.org/10.1056/NEJMoa1304369PMID:24131140Epub 2013 Oct 16.
3. Conroy T, Desseigne F, Ychou M, Bouche´ O, Guimbaud R, Be´couarn Y, et al. FOLFIRINOX versus gemcitabine for metastatic pancreatic cancer. N Engl J Med. 2011 May 12; 364(19):1817–25.https:// doi.org/10.1056/NEJMoa1011923PMID:21561347.
4. Reni M, Cordio S, Milandri C, Passoni P, Bonetto E, Oliani C, et al. Gemcitabine versus cisplatin, epiru-bicin, fluorouracil, and gemcitabine in advanced pancreatic cancer: a randomized controlled multicentre phase III trial. Lancet Oncol. 2005 Jun; 6(6):369–76.https://doi.org/10.1016/S1470-2045(05)70175-3 5. Heinemann V. Gemcitabine: progress in the treatment of pancreatic cancer. Oncology. 2001; 60(1):8–
18. Review.https://doi.org/10.1159/000055290PMID:11150902.
6. Waddell N, Pajic M, Patch AM, Chang DK, Kassahn KS, Bailey P, et al. Whole genomes redefine the mutational landscape of pancreatic cancer. Nature. 2015 Feb 26; 518(7540):495–501.https://doi.org/ 10.1038/nature14169PMID:25719666
7. Du Y, Zhao B, Liu Z, Ren X, Zhao W, Li Z, et al. Molecular Subtyping of Pancreatic Cancer: Translating Genomics and Transcriptomics into the Clinic. J Cancer. 2017 Feb 11; 8(4):513–522.https://doi.org/10. 7150/jca.17622PMID:28367231eCollection 2017.Review.
8. Le N, Sund M, Vinci A. Prognostic and predictive markers in pancreatic adenocarcinoma. Dig Liver Dis. 2016 Mar; 48(3):223–30.https://doi.org/10.1016/j.dld.2015.11.001PMID:26769569Epub 2015 Nov 14.
9. Chang JC and Kundranda M. Novel diagnostic and predictive biomarkers in pancreatic adenocarci-noma. Int J Mol Sci. 2017, 18(3):667.
10. Guerreiro EM, Vestad B, Steffensen LA, Aass HCD, Saeed M,ØvstebøR, et al. Efficient extracellular vesicle isolation by combining cell media modifications, ultrafiltration, and size-exclusion chromatogra-phy. PLoS One. 2018 Sep 27; 13(9):e0204276.https://doi.org/10.1371/journal.pone.0204276PMID: 30260987eCollection 2018.
11. Jiao YJ, Jin DD, Jiang F, Liu JX, Qu LS, Ni WK, et al. Characterization and proteomic profiling of pancre-atic cancer-derived serum exosomes. J Cell Biochem. 2018 Aug 30.https://doi.org/10.1002/jcb.27465 PMID:30160795[Epub ahead of print].
12. Chiba M, Kubota S, Sato K, Monzen S. Exosomes released from pancreatic cancer cells enhance angiogenic activities via dynamin-dependent endocytosis in endothelial cells in vitro. Sci Rep. 2018 Aug 10; 8(1):11972.https://doi.org/10.1038/s41598-018-30446-1PMID:30097593
13. Rajagopal C, Harikumar KB. The origin and functions of exosomes in cancer. Front Oncol. 2018 Mar 20; 8:66.https://doi.org/10.3389/fonc.2018.00066PMID:29616188eCollection 2018.
14. Harmsen FJ, Domagk D, Dietrich CF, Hocke M. Discriminating chronic pancreatitis from pancreatic cancer: Contrast-enhanced EUS and multidetector computed tomography in direct comparison. Endosc Ultrasound. 2018 Sep 18.https://doi.org/10.4103/eus.eus_24_18PMID:30246709[Epub ahead of print].
15. Ohira S, Yagi M, Iramina H, Karino T, Washio H, Ueda Y, et al. Treatment planning based on water den-sity image generated using dual-energy computed tomography for pancreatic cancer with contrast-enhancing agent: Phantom and clinical study. Med Phys. 2018 Sep 10.https://doi.org/10.1002/mp. 13180PMID:30198189[Epub ahead of print].
16. Tsen A, Barbara M, Rosenkranz L. Dilemma of elevated CA 19–9 in biliary pathology. Pancreatology. 2018 Sep 18.https://doi.org/10.1016/j.pan.2018.09.004[Epub ahead of print] Review.
17. Litvinov SV, van Driel W, van Rhijn CM, Bakker HA, van Krieken H, Fleuren GJ, Warnaar SO. Expres-sion of Ep-CAM in cervical squamous epithelia correlates with an increased proliferation and the disap-pearance of markers for terminal differentiation. Am J Pathol. 1996 Mar; 148(3):865–75. PMID: 8774141
18. Osta WA, Chen Y, Mikhitarian K, Mitas M, Salem M, Hannun YA, et al. EpCAM is overexpressed in breast cancer and is a potential target for breast cancer gene therapy. Cancer Res. 2004 Aug 15; 64 (16):5818–24.https://doi.org/10.1158/0008-5472.CAN-04-0754PMID:15313925.
19. Maetzel D, Denzel S, Mack B, Canis M, Went P, Benk M, et al. Nuclear signalling by tumour-associated antigen EpCAM. Nat Cell Biol. 2009 Feb; 11(2):162–71.https://doi.org/10.1038/ncb1824PMID: 19136966Epub 2009 Jan 11.
20. Heiler S, Wang Z, Zoller M. Pancreatic cancer stem cell markers and exosomes—the incentive push. World J Gastroenterol. 2016 Jul 14; 22(26);5971–6007.https://doi.org/10.3748/wjg.v22.i26.5971 21. Castillo J, Bernard V, San Lucas FA, Allenson K, Capello M, Kim DU, et al. Surfaceome profiling
enables isolation of cancer-specific exosomal cargo in liquid biopsies from pancreatic cancer patients. Ann Oncol. 2018 Jan 1; 29(1):223–220.https://doi.org/10.1093/annonc/mdx542PMID:29045505 22. Madhavan B, Yue S, Galli U, Rana S, Gross W, Muller M, et al. Combined evaluation of a panel of
pro-tein and miRNA serum-exosome biomarkers for pancreatic cancer diagnosis increases sensitivity and specificity. Int J Cancer 2015 Jun 1; 136(11):2616–27.https://doi.org/10.1002/ijc.29324PMID: 25388097
23. Tomita N, Yamano T, Matsubara N, Tamura K. [A novel genetic disorder of Lynch syndrome—EPCAM gene deletion]. Gan To Kagaku Ryoho. 2013 Feb; 40(2):143–7.Review. Japanese. PMID:23411950. 24. Gebauer F, Struck L, Tachezy M, Yashist Y, Wicklein D, Schumacher U, et al. Serum EpCAM
expres-sion in pancreatic cancer. Anticancer Res. 2014 Sep; 34(9):4741–6 PMID:25202052
25. Sergeant G, Roskams T, van Pelt J, Houtmeyers F, Aerts R, Topal B. Perioperative cancer cell dissemi-nation detected with a real-time RT-PCR assay for EpCAM is not associated with worse prognosis in pancretic ductal adenocarcinoma. BMC Cancer. 2011 Jan 31; 11:47. https://doi.org/10.1186/1471-2407-11-47
26. Tra¨ger MM, Dhayat SA. Epigenetics of epithelial-to-mesenchymal transition in pancreatic carcinoma. Int J Cancer. 2017 Jul 1; 141(1):24–32.https://doi.org/10.1002/ijc.30626PMID:28133736Epub 2017 Feb 17. Review.
27. Santisteban M, Reiman JM, Asiedu MK, Behrens MD, Nassar A, Kalli KR, et al. Immune-induced epi-thelial to mesenchymal transition in vivo generates breast cancer stem cells. Cancer Res. 2009 Apr 1; 69(7):2887–95.https://doi.org/10.1158/0008-5472.CAN-08-3343PMID:19276366Epub 2009 Mar 10. 28. Armstrong A, Eck SL. EpCAM: A new therapeutic target for an old cancer antigen. Cancer Biol Ther.